NYSE pre-market review tracks ETF movers and futures trends as AI shares stabilize, Treasury yields and oil ease, while short-term index signals remain weak.
Fundamentals: U.S. index futures moved higher in early trading as AI and semiconductor shares stabilized following a technology-led selloff. Lower Treasury yields and softer oil prices supported risk appetite, while Big Tech earnings, AI financing concerns and weaker market breadth remained key equity themes. Middle East tanker attacks, Russia sanctions policy and inflation uncertainty continued to influence energy, bonds and metals.
Technicals: Pre-market analysis highlights gains in USO, AAPL and TLT alongside declines in GOOG, QQQ and META. ES, NQ, EMD, RTY and FDAX show predominantly bearish short-term technical conditions after sharp pullbacks, while several weekly and long-term structures remain constructive. YM stands out with a bullish daily rebound within a broader mixed recovery phase.
Pre-Market Trading 360° view Market Radar of: holidays, earnings, eco-news, market-news summary, news sentiment, prior session major ETFs, MAG7, Higher Time Frame Analysis Indices Futures Summary, and E-mini S&P500, Nasdaq 100, NYMEX Crude, Gold Futures Daily Chart analysis.
As of: October 19, 2026 07:16 CT
Earnings Radar
Monitoring for earnings releases by the Magnificent 7, AI-tech-related firms, and major financial institutions.
- IBM Release: 2026-10-21 T:AMC
- META Release: 2026-10-21 T:AMC
- TSLA Release: 2026-10-21 T:AMC
Conclusion: IBM, Meta, and Tesla report after the close on October 21, concentrating broad index-relevant technology and MAG7 earnings risk in one session. Market momentum and volume can slow ahead of these releases, while post-release reactions can shape Nasdaq and S&P 500 futures sentiment.
For full details visit: Yahoo Earnings Calendar
EcoNews Radar U.S. Events
| Day | Time | Impact | Event |
|---|---|---|---|
| Wed | 10:30 | Low | Crude Oil Inventories |
| Thu | 08:30 | Medium | Unemployment Claims |
| Fri | 09:45 | Medium | Flash Manufacturing PMI |
| Fri | 09:45 | Medium | Flash Services PMI |
| Fri | 10:00 | Medium | Revised UoM Consumer Sentiment |
| Fri | 10:00 | Medium | Revised UoM Inflation Expectations |
EcoNews Summary
No qualifying high-impact EcoNews events are listed. The only oil-related release is Wednesday’s U.S. Crude Oil Inventories report, a petroleum-supply data point relevant to energy prices and inflation-linked market context.
Event Notes:
- Wednesday 10:30 – USD Crude Oil Inventories: Measures the weekly change in U.S. commercial crude oil stockpiles. Traders monitor inventory draws and builds for indications of petroleum supply-demand conditions and their relationship to crude and energy prices.
Conclusion:
The single most important listed event is Wednesday at 10:30, USD Crude Oil Inventories. High oil prices directly affect markets through inflation and geopolitical concerns.
For full details visit: Forex Factory EcoNews
Market News Summary:
Index futures rose in early trading as AI shares stabilized after a sharp technology-led decline, while lower oil prices and Treasury yields supported risk appetite.
Primary Drivers & Risks:
- Primary Driver: AI-stock rebound and falling yields
- Primary Risk: AI credit and valuation concerns
Tone:
Cautiously constructive, with elevated technology-sector fragility.
Stock Market / ETFs / Indices:
Nasdaq and Wall Street futures moved higher as investors returned cautiously to AI stocks after last week’s selloff. The technology sector ETF fell 7.7% last week, semiconductors declined sharply, and the Nasdaq recorded its worst week since June. Big Tech earnings and debate over AI debt financing remain central equity catalysts. The S&P 500 earnings yield stood at 5.28%, while commentary noted weaker breadth beneath the index and elevated volatility.
Geopolitical:
Middle East tanker attacks remained a supply-risk factor for energy markets, while a U.S. sanctions waiver affecting Russia tempered crude-price pressure. Violent protests in France added a separate European political-risk backdrop.
Oil / Energy:
Oil prices declined as traders weighed the Russia sanctions waiver against persistent Middle East supply concerns. WTI was cited near $97.27, with tanker attacks contributing to volatility; natural gas traded below $3.09. Softer crude reduced immediate inflation pressure in market pricing.
Gold / Metals:
Gold and silver were supported by lower oil prices and reduced October rate-hike odds. Gold faced resistance near $4,201, while silver tested $57.86.
Fed / Financials:
Treasury yields declined in Asian and U.S. trading as oil eased and investors assessed inflation, rates, geopolitical risks, and AI-sector weakness. Commentary identified the AI investment boom as an inflation complication for the Fed, while bond markets focused more on technology stress than renewed inflation concerns. JPMorgan’s security and resiliency initiative financed $230 billion in its first year.
Macro / Other:
AI-driven demand supported a strong revenue outlook for Chinese DRAM producer CXMT. Separate commentary highlighted longer-term concerns over the dollar’s global role amid a more multipolar monetary system.
Conclusion:
Early index-futures strength centered on a rebound in AI and chip shares, lower Treasury yields, and declining oil prices. Big Tech earnings remain a key near-term focus for equity markets.
Technology valuation, AI financing, and credit concerns remain significant cross-currents after the sector’s sharp weekly losses. Geopolitical energy-supply risks and inflation uncertainty continue to affect oil, bonds, metals, and broader risk sentiment.
Market News Sentiment
Market News Articles: 35
- Neutral: 51.43%
- Positive: 25.71%
- Negative: 22.86%
Sentiment Summary: Of 35 market news articles, 51% are neutral, 26% positive, and 23% negative, indicating predominantly balanced coverage with a slight positive skew.
Conclusion: Indices futures news tone is broadly neutral, with positive articles modestly exceeding negative articles.
GLD,Gold Articles: 4
- Positive: 50.00%
- Neutral: 50.00%
Sentiment Summary: GLD/Gold coverage was evenly split, with 50% positive and 50% neutral articles across 4 articles.
Conclusion: Gold-related news tone was balanced, with no negative articles recorded.
USO,Oil Articles: 6
- Negative: 66.67%
- Positive: 16.67%
- Neutral: 16.67%
Sentiment Summary: USO/Oil coverage is predominantly negative, with 67% negative, 17% positive, and 17% neutral articles.
Conclusion: The oil news tone is negative overall, indicating a bearish sentiment backdrop for energy-related index futures components.
Market Data Snapshot
ETF Snapshot of major stock market ETFs, Mag7, and others as of: October 19, 2026 07:16
Top Movers & Losers
- USO 161.76 Bullish 2.83% ▲
- AAPL 343.46 Bullish 0.43% ▲
- TLT 80.05 Bullish 0.10% ▲
- GOOG 336.91 Bearish -2.32% ▼
- QQQ 709.80 Bearish -2.50% ▼
- META 709.33 Bearish -3.72% ▼
Major Index ETFs: SPY, QQQ, DIA, IWM, IJH
- DIA 519.10 Bearish -0.40% ▼
- IJH 72.35 Bearish -0.93% ▼
- SPY 763.25 Bearish -1.11% ▼
- IWM 270.44 Bearish -1.69% ▼
- QQQ 709.80 Bearish -2.50% ▼
Major index ETFs are Bearish across the group. QQQ is the most bearish mover at -2.50%, followed by IWM at -1.69% and SPY at -1.11%. IJH declined -0.93%. DIA is the least negative mover at -0.40%.
Mag 7 Stocks: AAPL, MSFT, GOOG, AMZN, META, NVDA, TSLA
- AAPL 343.46 Bullish 0.43% ▲
- NVDA 214.13 Bearish -1.43% ▼
- AMZN 250.00 Bearish -1.87% ▼
- MSFT 529.05 Bearish -1.93% ▼
- TSLA 354.72 Bearish -2.13% ▼
- GOOG 336.91 Bearish -2.32% ▼
- META 709.33 Bearish -3.72% ▼
Mag7 is Mixed: AAPL is the most bullish mover at +0.43%, while META is the most bearish mover at -3.72%. Selling pressure is broad across the remaining names, led by GOOG at -2.32%, TSLA at -2.13%, MSFT at -1.93%, AMZN at -1.87%, and NVDA at -1.43%.
Cross-Market ETFs: TLT, GLD, USO, IBIT
- USO 161.76 Bullish 2.83% ▲
- TLT 80.05 Bullish 0.10% ▲
- GLD 382.01 Bearish -0.18% ▼
- IBIT 46.15 Bearish -0.94% ▼
Mixed: USO is the most bullish mover at +2.83%, while TLT is marginally Bullish at +0.10%. IBIT is the most bearish mover at -0.94%, with GLD modestly Bearish at -0.18%.
ETF, Mag7, and Cross-Market ETF Insights
Overall Tone
Bearish overall tone, with broad equity and Mag7 weakness outweighing strength in oil.
Equity ETFs and Mag7:
Major Index ETFs were broadly Bearish: QQQ led losses at -2.50%, followed by IWM at -1.69%, SPY at -1.11%, IJH at -0.93%, and DIA at -0.40%, the least negative index ETF. Mag7 participation was also uniformly Bearish, led lower by META at -3.72%; AAPL was the least negative at +0.43% and the only Bullish Mag7 name. The combination shows selective AAPL resilience amid broad large-cap growth and smaller-cap weakness.
Cross-Market ETFs:
Cross-market ETFs were Mixed: USO was the most bullish mover at +2.83%, while TLT was marginally Bullish at +0.10%. GLD was modestly Bearish at -0.18%, while IBIT was the most bearish cross-market mover at -0.94%. Oil strength diverged from the Bearish equity and bitcoin ETF moves.
Futures Indices – Higher Time Frame Analysis
Summary of the current state of US Indices Futures based on higher time-frame (HTF) technical analysis as of: 2026-10-19: 07:16 CT.
US Indices Futures
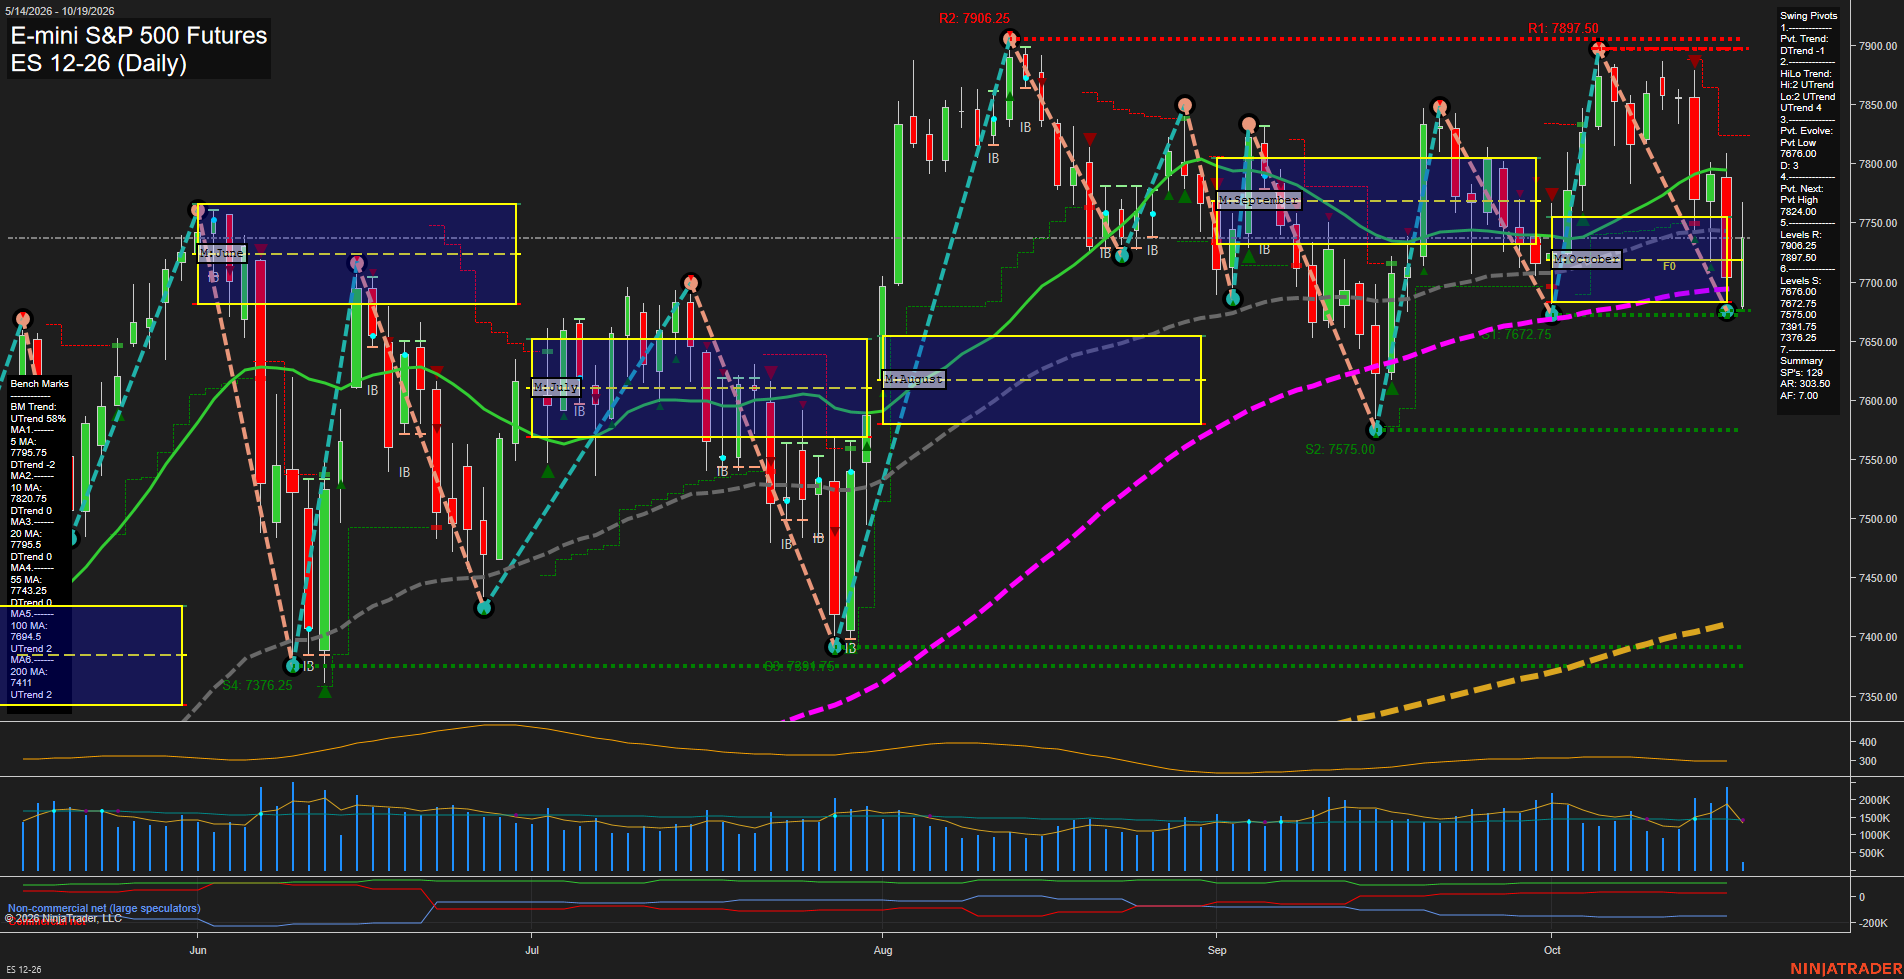
- ES YSFG above F0%, MSFG below F0%, WSFG mixed; UTrend weekly pivots, daily DTrend; resistance 7824-7906.25, support 7672.75-7676, 7502.25.
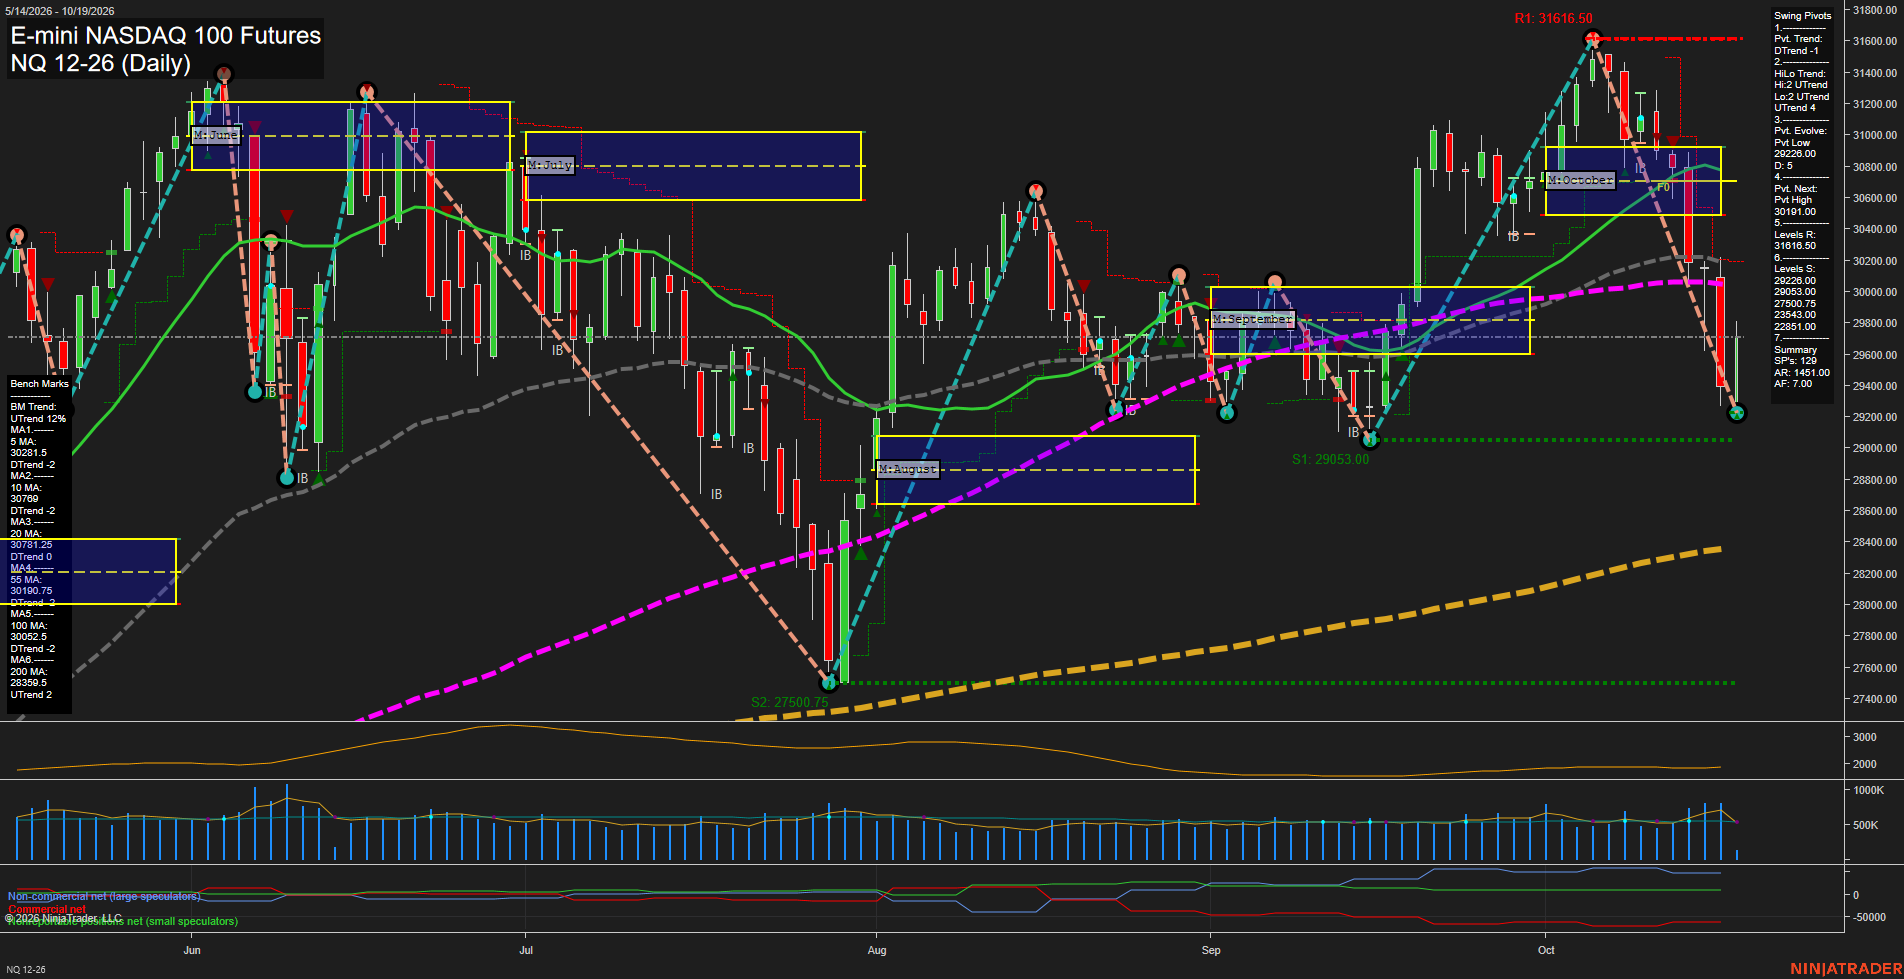
- NQ YSFG up, MSFG below F0%, WSFG rebound; weekly and daily DTrend; resistance 30191, 31369-31616.50, support 29053-29262, 27500.75.
- YM YSFG, MSFG and WSFG above F0%; weekly consolidation, daily UTrend; resistance 52838, 53199, 55316, support 51681 and 50859.
- EMD YSFG, MSFG and WSFG above F0%; weekly pullback and daily DTrend; resistance 3708.7-3737.8, 3792.3, support 3600.3.
- RTY YSFG and WSFG above F0%, MSFG below F0%; weekly and daily DTrend; resistance 2808.7, 2887.1-3101.8, support 2723.3.
- FDAX YSFG and MSFG above F0%, WSFG below F0%; weekly and daily corrective DTrend; resistance 25454-25686, 26247, support 25247-24925.
Overall State
- Short-Term: Bearish
- Intermediate-Term: Bearish
- Long-Term: Bullish
Conclusion
US index futures show broad short-term corrective alignment, led by bearish NQ, EMD, and RTY pivot and benchmark structures. ES is consolidating below resistance, while YM retains relative strength through daily UTrend recovery. YSFG positioning and rising longer-period benchmarks maintain bullish long-term structure across the complex. MSFG and WSFG conditions are mixed, with key pivot support defining current retracement boundaries.
Note: Intra-day counter-trend pullbacks or retracements may occur, HTF is context for informational usage and market structure. Glossary: Session Fib Grids periods of YSFG:’Yearly’, MSFG:’Monthly’, WSFG:’Weekly’
For full details visit: AlphaWebTrader Technicals
ES Daily View
Overall Rating
- Short-Term: Bearish
- Intermediate-Term: Bearish
- Long-Term: Bullish.
Key Insights Summary
Daily price action reflects a sharp, high-range retracement from the 7897.50-7906.25 resistance zone, with the short-term pivot structure now in DTrend and price trading beneath the 10-, 20-, and 55-day benchmarks. The October MSFG remains below its F0% area, reinforcing the intermediate corrective phase. The 7676.00-7672.75 support band is the immediate downside reference, while 7824.00 is the next pivot reversal threshold. Despite the short- and intermediate-term weakness, the higher-level structure remains constructive: the HiLo pivot trend, yearly fib-grid position, and rising 100- and 200-day benchmarks retain a longer-term bullish backdrop.
View charts on: AlphaWebTrader HTF Charts
NQ Daily View
Overall Rating
- Short-Term: Bearish
- Intermediate-Term: Bearish
- Long-Term: Neutral.
Key Insights Summary
Price has staged a sharp rebound from the 29236 pivot low, placing it above the weekly F0% area, but the daily swing structure remains in a short-term DTrend. The recovery is counter-trend relative to declining 5-, 10-, 20-, 55-, and 100-day benchmarks, with 30191 acting as the next pivot-reversal threshold. The October monthly grid remains below F0% and the intermediate trend is down, while the yearly grid and rising 200-day average preserve a constructive longer-term backdrop. The market is experiencing elevated, fast momentum and wide daily movement following a steep selloff from the 31616.50 swing high; 29226 and 29053 define the nearby support zone beneath the rebound.
View charts on: AlphaWebTrader HTF Charts
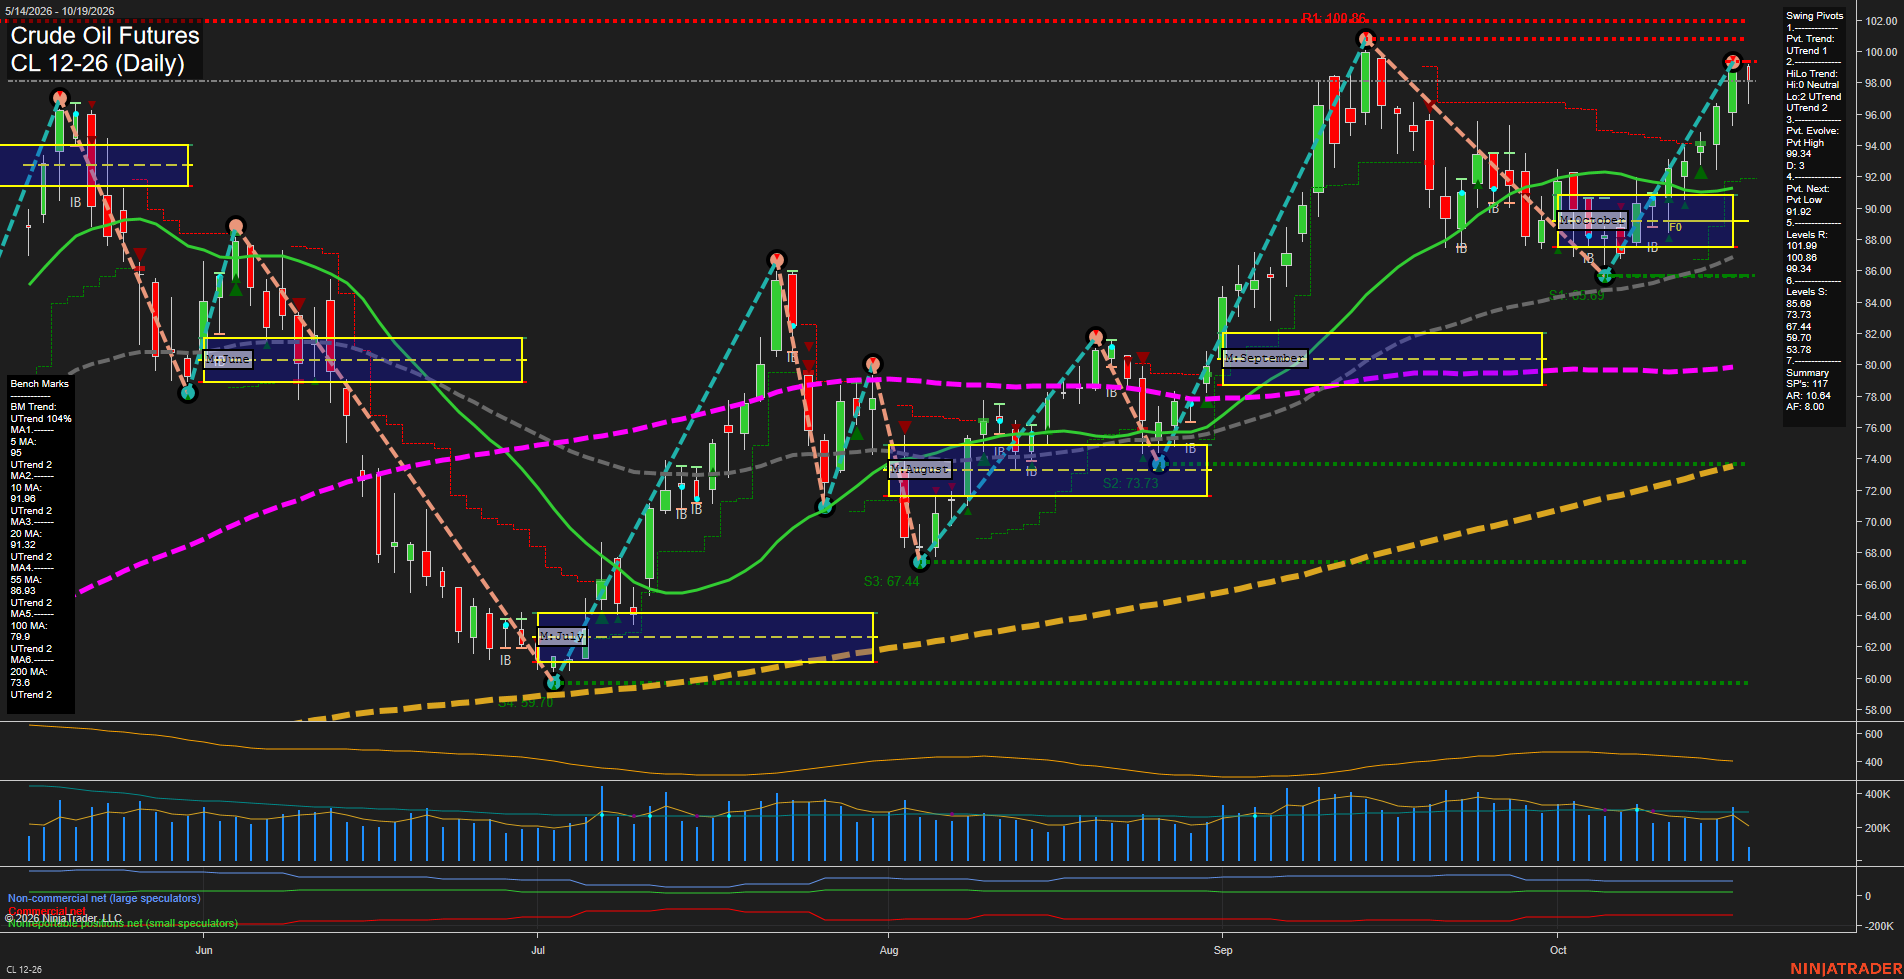
CL Daily View
Overall Rating
- Short-Term: Bullish
- Intermediate-Term: Bullish
- Long-Term: Bullish.
Key Insights Summary
Price is extending sharply from the early-October 86.09 swing low, with a sequence of higher lows and higher highs carrying CL back into the 99.34 pivot-high area. The short-term weekly grid remains countertrend bearish below its F0% reference, while the monthly and yearly grids remain positive. Price is above all rising daily benchmarks, confirming broad multi-timeframe upside alignment. The immediate chart structure is testing clustered pivot resistance at 99.34, 100.86, and 101.99 following a fast, high-range advance; 91.92 is the next pivot-reversal reference, with 86.09 the major nearby swing support.
View charts on: AlphaWebTrader HTF Charts
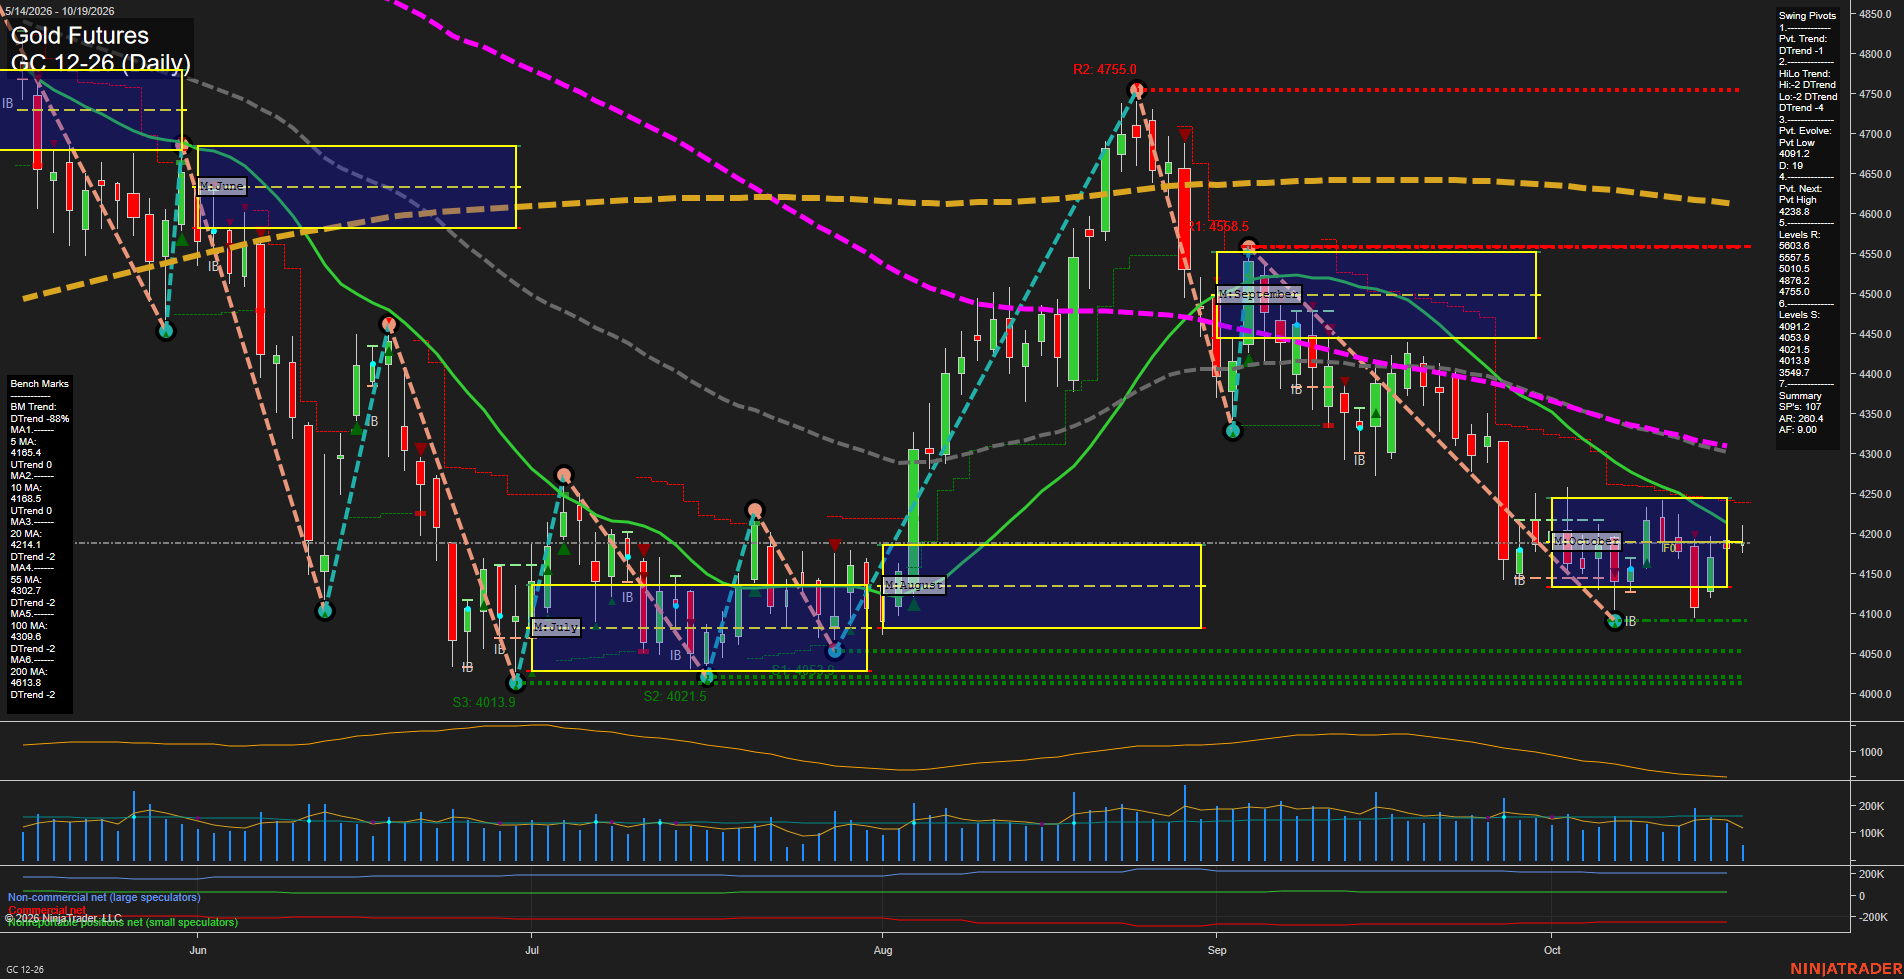
GC Daily View
Overall Rating
- Short-Term: Neutral
- Intermediate-Term: Bearish
- Long-Term: Bearish.
Key Insights Summary
Gold is consolidating in a narrow October range after a sharp September-to-early-October decline. Small daily bars and slow momentum reflect balance around the 5- and 10-day averages, while price remains below the 20-, 55-, 100-, and 200-day benchmarks. The pivot structure remains bearish on both short- and intermediate-term measures, with 4238.8 defining the next upside pivot threshold and 4091.2 as nearby downside pivot support. The monthly and yearly Fib-grid biases remain below F0%, maintaining the broader corrective, lower-high trend despite the short-term stabilization.
View charts on: AlphaWebTrader HTF Charts
ZB Daily View
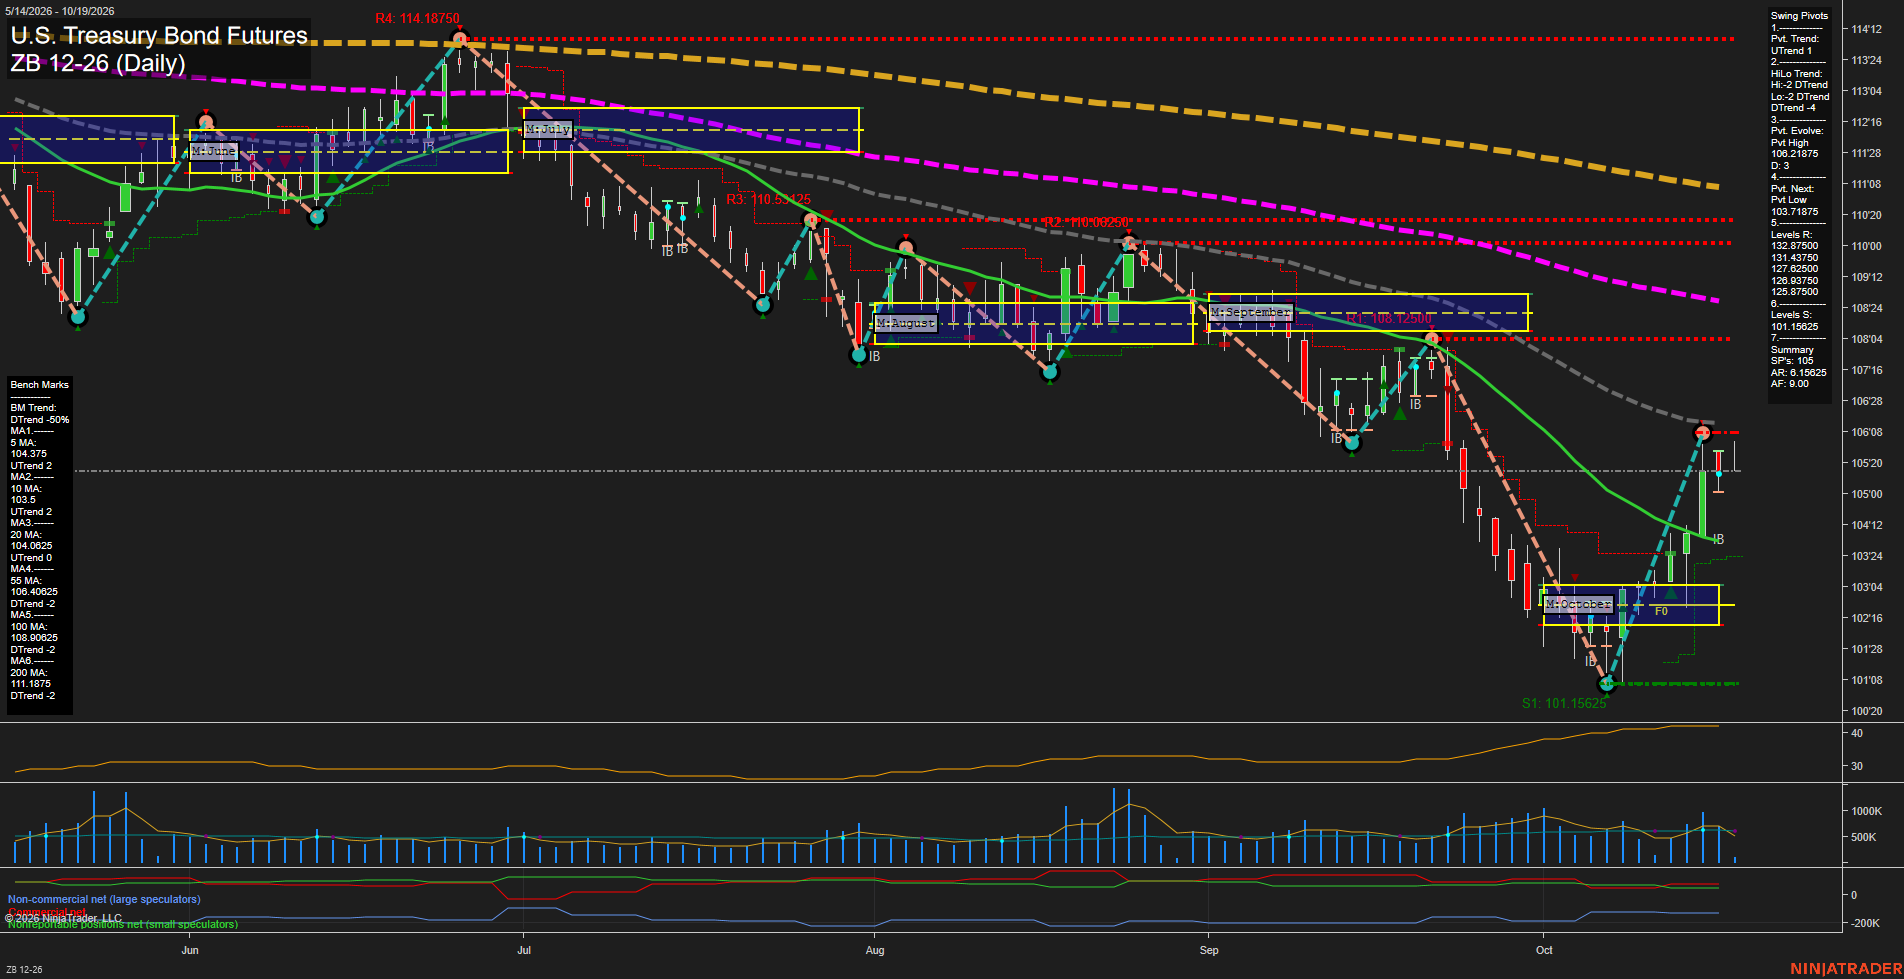
Overall Rating
- Short-Term: Bullish
- Intermediate-Term: Neutral
- Long-Term: Bearish.
Key Insights Summary
The daily chart shows a sharp V-style rebound from the 101-05 swing-low support area, with the short-term pivot structure now in UTrend and price above the rising 10-day and 20-day benchmarks. The rebound remains countertrend within a broader intermediate and long-term decline: the HiLo trend is DTrend and price remains below the declining 55-day, 100-day, and 200-day averages. Current action is testing the 105-20 region after a fast recovery, while the evolving 106-03 pivot high is the nearby structural ceiling. The October monthly grid remains constructive above F0%, but the weekly grid remains negative, highlighting a short-term recovery inside a larger bearish price cycle.
View charts on: AlphaWebTrader HTF Charts