Stocks cautious: 11:30 ET Treasury auctions, 14:00 ET Fed; Vertiv before open, Alphabet and Microsoft after close. Nasdaq rebounds remain countertrend.
Fundamentals: Stocks face a cautious Wednesday ahead of Alphabet and Microsoft earnings after close, with AI spending under scrutiny; Vertiv is scheduled before open, with no results supplied. Today's ET agenda includes EIA oil inventories at 10:30, the $30B 2-year floating-rate Treasury and $75B 17-week bill auctions at 11:30, the Fed decision at 14:00 and its press conference at 14:30. Oil rose on supply concerns, while yields near 5% constrain gold. Tomorrow, Thursday, brings GDP and PCE data at 08:30 ET.
Technicals: Stock index futures show mixed technical conditions heading into Wednesday's session. S&P 500 futures are consolidating within a broader bullish structure, while Nasdaq and Russell 2000 rebounds remain countertrend moves against weaker medium trends. Dow futures show near-term weakness despite constructive longer-term trends, and Germany's DAX retains bullish daily ratings across all time frames.
Pre-Market Trading 360° view Market Radar of: holidays, earnings, eco-news, market-news summary, news sentiment, prior session major ETFs, MAG7, Higher Time Frame Analysis Indices Futures Summary, and E-mini S&P500, Nasdaq 100, NYMEX Crude, Gold Futures Daily Chart analysis.
As of: October 28, 2026 07:16 CT
Earnings Radar
Monitoring for earnings releases by the Magnificent 7, AI-tech-related firms, and major financial institutions.
| Date/Day | Impact | Company / Symbol | Time | EPS | Revenue | ||||
|---|---|---|---|---|---|---|---|---|---|
| 2026-10-28 – Wednesday | High | Alphabet (GOOGL) | After close |
|
| ||||
| 2026-10-28 – Wednesday | High | Microsoft (MSFT) | After close |
|
| ||||
| 2026-10-28 – Wednesday | Medium | Vertiv (VRT) | Before open |
|
| ||||
| 2026-10-29 – Thursday | High | Amazon (AMZN) | After close |
|
| ||||
| 2026-10-29 – Thursday | Medium | Intel (INTC) | After close |
|
|
Conclusion: GOOGL and MSFT report after the close today (Oct. 28), followed by AMZN and INTC after the close Oct. 29—key earnings events for broad-index, major-tech and semiconductor context. VRT is listed for today’s premarket release; no actual results or publication confirmation are supplied.
Market momentum and volume can slow ahead of major tech earnings, with these releases providing context for index-futures activity.
For full details visit: Yahoo Earnings Calendar
EcoNews Radar U.S. Events
| Date | Impact | Event, Prev, Forecast, Actual | Info |
|---|---|---|---|
| 2026-10-28 Wednesday 10:30 | Low | EIA Crude Oil Stocks Change Prev: -3.06M Forecast: -0.30M Actual: — | Measures weekly changes in commercial crude inventories, offering clues about petroleum supply and demand that traders monitor for energy-sector earnings and inflation implications. |
| 2026-10-28 Wednesday 11:30 | High | 2-Year FRN Auction · $30B Prev: — Forecast: — Actual: — | Reveals demand and pricing for floating-rate Treasury debt, helping traders assess government funding conditions and appetite for securities linked to short-term rates. |
| 2026-10-28 Wednesday 11:30 | Medium | 17-Week Bill Auction · $75B Prev: — Forecast: — Actual: — | Shows demand and clearing yields for short-term government debt, providing context on cash-market conditions and near-term interest-rate pricing relevant to equity valuations. |
| 2026-10-28 Wednesday 14:00 | High | Fed Interest Rate Decision Prev: 4% Forecast: 4.00% Actual: — | Sets the central bank’s policy-rate target; traders monitor the decision and accompanying statement for implications for borrowing costs, discount rates and economic growth. |
| 2026-10-28 Wednesday 14:30 | High | FOMC Press Conference Prev: — Forecast: — Actual: — | Explains policymakers’ assessment of the economy and policy outlook; traders watch for guidance that could reshape rate expectations and equity valuations. |
| 2026-10-29 Thursday 08:30 | High | Advance GDP q/q Prev: 1.5% Forecast: 3.2% Actual: — | Provides the first estimate of quarterly economic output growth, helping traders assess demand momentum and its implications for corporate earnings and monetary policy. |
| 2026-10-29 Thursday 08:30 | High | Core Personal Consumption Expenditures – Price Index (MoM) Prev: 0.2 Forecast: 0.3 Actual: — | Measures monthly consumer-price changes excluding food and energy; traders monitor this underlying inflation gauge for implications for policy expectations and equity discount rates. |
| 2026-10-29 Thursday 08:30 | High | Gross Domestic Product Price Index Prev: 6.1 Forecast: 3.5 Actual: — | Tracks price changes across domestically produced final goods and services, helping traders distinguish inflation from real growth and assess broader pricing pressures. |
| 2026-10-29 Thursday 08:30 | Medium | Initial Jobless Claims Prev: 194K Forecast: 199K Actual: — | Counts new applications for unemployment benefits, providing a timely signal of layoffs and labor-market conditions relevant to consumer demand and monetary policy. |
| 2026-10-29 Thursday 08:30 | Medium | Personal Income (MoM) Prev: 0.2 Forecast: 0.3 Actual: — | Tracks changes in household income from wages, investments and transfers; traders monitor it for clues about spending capacity and economic momentum. |
| 2026-10-29 Thursday 08:30 | Medium | Personal Spending Prev: 0.9 Forecast: 0.6 Actual: — | Measures household outlays on goods and services, helping traders assess consumer demand, a major driver of economic growth and corporate revenues. |
| 2026-10-29 Thursday 08:30 | High | Core Personal Consumption Expenditures – Price Index (YoY) Prev: 3 Forecast: 3.1 Actual: — | Measures annual consumer-price inflation excluding food and energy, helping traders assess persistent inflation pressures and the outlook for monetary policy. |
| 2026-10-29 Thursday 08:30 | Medium | Core Personal Consumption Expenditures (QoQ) Prev: 3.3 Forecast: 2.4 Actual: — | Tracks quarterly consumer-price changes excluding food and energy, giving traders a broader-period view of underlying inflation relevant to policy expectations. |
| 2026-10-29 Thursday 08:30 | High | Gross Domestic Product Annualized Prev: 2.2 Forecast: 3.2 Actual: — | Expresses quarterly economic output growth at an annualized pace, helping traders evaluate growth momentum and potential implications for earnings and interest rates. |
| 2026-10-29 Thursday 08:30 | Medium | Personal Consumption Expenditures – Price Index (MoM) Prev: 0.3 Forecast: 0.5 Actual: — | Measures monthly changes in prices paid by consumers, including food and energy; traders watch this broad inflation gauge for policy and purchasing-power implications. |
| 2026-10-29 Thursday 08:30 | Medium | Personal Consumption Expenditures – Price Index (YoY) Prev: 3.4 Forecast: 3.6 Actual: — | Tracks annual changes in consumer prices across goods and services, helping traders assess inflation trends, household purchasing power and the monetary-policy outlook. |
| 2026-10-29 Thursday 08:30 | Medium | Personal Consumption Expenditures Prices (QoQ) Prev: 5 Forecast: 3.4 Actual: — | Measures quarterly changes in prices for household consumption, including food and energy; traders use it to assess broad inflation pressures alongside economic growth. |
| 2026-10-29 Thursday 11:30 | Medium | 4-Week Bill Auction · $115B Prev: 3.945% Forecast: — Actual: — | Reveals demand and yields for very short-term Treasury borrowing, offering context on cash allocation, funding conditions and near-term rate expectations. |
| 2026-10-29 Thursday 11:30 | Medium | 8-Week Bill Auction · $110B Prev: — Forecast: — Actual: — | Shows investor demand and clearing yields for short-term Treasury debt, helping traders gauge money-market conditions and pricing along the front end of the yield curve. |
| 2026-10-29 Thursday 13:00 | High | 7-Year Note Auction · $44B Prev: 5.085% Forecast: — Actual: — | Reveals demand and pricing for intermediate-maturity Treasury debt; traders monitor auction strength for implications for bond yields and equity discount rates. |
| 2026-10-30 Friday 08:30 | Medium | Employment Cost Index Prev: 0.9 Forecast: 0.8 Actual: — | Measures changes in employers’ wage and benefit costs, helping traders assess labor-driven inflation pressures and potential effects on profit margins and monetary policy. |
| 2026-10-30 Friday 09:45 | Medium | Chicago PMI Prev: 58.8 Forecast: 56.1 Actual: — | Surveys business activity in the Chicago region, offering clues about orders, production and employment that traders monitor for broader economic momentum. |
| 2026-10-30 Friday 12:00 | Medium | Fed's Daly speech Prev: — Forecast: — Actual: — | Provides a policymaker’s views on economic conditions and monetary policy; traders monitor any guidance for implications for interest-rate expectations and equity valuations. |
| 2026-10-30 Friday 12:30 | Medium | Fed's Musalem speech Prev: — Forecast: — Actual: — | Offers a policymaker’s assessment of inflation, employment and the policy outlook; traders watch for signals that could inform expectations for future interest rates. |
Summary: The calendar centers on U.S. monetary policy, growth and inflation, alongside Treasury financing and labor-market indicators.
Conclusion: Thursday’s releases form the largest simultaneous data cluster on the supplied calendar.
NYSE Session Open Gap Radar
Session gaps compare the predicted opening price with the prior session’s close to predict the upcoming session’s opening gap pattern.
| Instrument | Gap | Prior Close | Predicted Open | Gap % |
|---|---|---|---|---|
| USO | ▼ IGU | 163.88 | 166.37 | ▲ +1.52% |
| QQQ | ▲ OGU | 721.25 | 724.35 | ▲ +0.43% |
| SPY | ▼ IGU | 769.66 | 771.04 | ▲ +0.18% |
| IJH | ▲ OGU | 73.22 | 73.28 | ▲ +0.09% |
| IWM | ▲ IGD | 280.18 | 279.85 | ▼ -0.12% |
| DIA | ▲ IGD | 523.28 | 522.50 | ▼ -0.15% |
| GLD | ▲ IGD | 372.28 | 371.06 | ▼ -0.33% |
| TLT | ▼ OGD | 81.63 | 80.49 | ▼ -1.39% |
Before the session opens, the table shows the predicted opening price and gap. Once the session opens, it uses the recorded opening price.
Glossary: IGU — Inside Gap Up: above the prior close, within the prior session’s range. IGD — Inside Gap Down: below the prior close, within that range. OGU — Outside Gap Up: above the prior session’s high. OGD — Outside Gap Down: below the prior session’s low.
As of: 2026-10-28 07:16 CT. Predicted gaps are best estimates as of publication and may change before the regular-session open, particularly when the session is still some time away.
Market News Summary:
The Federal Reserve decision and Alphabet and Microsoft earnings dominate today’s calendar, alongside AI spending scrutiny and renewed energy supply concerns.
Primary Drivers & Risks:
- Primary Driver: Fed decision and megacap technology earnings
- Primary Risk: Hawkish policy and AI spending pressures
Tone:
Cautious, with attention on policy, technology profitability and energy costs.
Data, Market and System
Geopolitical:
- The continuing Iran war is disrupting airline fuel purchasing decisions as carriers pull back from new hedges.
Oil / Energy:
- A Saudi refinery attack lifted WTI and Brent prices as supply concerns returned.
- Jet fuel prices stand at roughly twice their pre-Iran-war levels, with airlines warning about fares.
Gold / Metals:
- Treasury yields near 5% are cited as a constraint on gold’s rebound.
Fed / Financials:
- The Federal Reserve announces its latest interest-rate decision today, with investors bracing for a hawkish hold.
- Standard Chartered delivered a standout earnings performance, while UBS met expectations and its chief executive raised concerns about tougher capital requirements.
- The average conforming 30-year fixed mortgage rate declined to 7.37% from 7.41%, marking a second consecutive weekly decrease.
Macro / Other:
- Mortgage purchase applications rose 4% for the week but remained 18% below their year-earlier level.
- Southern California ports face a strike threat.
- Meta and Snap face a Los Angeles trial over alleged harms to young social media users, with jury selection scheduled for today.
Conclusion:
Today’s central events are the Federal Reserve decision and earnings from Alphabet and Microsoft. AI investment returns, funding and spending discipline frame the technology earnings discussion.
Higher oil and jet fuel prices add an energy-cost cross-current, while Treasury yields near 5% constrain gold’s rebound. Utilities’ monthly advance contrasts with profitability and dilution concerns at major technology companies.
Market News Sentiment
Sentiment Bias shows the balance of positive and negative news coverage sampled from 2026-10-27 08:18 to 2026-10-28 07:40 ET, covering stocks, energy and gold.
▲ Market news
- Bias
- ▲ +18.04%
- Articles
- 194
- Positive
- ▲ 37.63%
- Neutral
- — 42.78%
- Negative
- ▼ 19.59%
▲ GLD / Gold
- Bias
- ▲ +36.84%
- Articles
- 19
- Positive
- ▲ 47.37%
- Neutral
- — 42.11%
- Negative
- ▼ 10.53%
Sentiment Summary: Gold coverage leaned positive (47% positive, 11% negative, 42% neutral), reflecting October 27’s rebound above $4,050 alongside a Wall Street rally as falling oil prices eased reported inflation concerns ahead of the October 28 Federal Reserve decision. October 27 releases showed weaker new-home sales and consumer confidence rising to 91.7; October 28 coverage emphasized counterweights from Treasury yields near 5%, dollar strength and renewed oil-driven rate-hike concerns.
Conclusion: For indices futures, the supported context is a pre-Fed equity rally accompanied by a gold rebound, with inflation and interest-rate risks still prominent.
▲ USO / Oil
- Bias
- ▲ +12.50%
- Articles
- 24
- Positive
- ▲ 37.50%
- Neutral
- — 37.50%
- Negative
- ▼ 25.00%
Sentiment Summary: Oil coverage was modestly positive but mixed, with 38% positive, 25% negative and 38% neutral sentiment. On October 28, oil rose after reported Houthi attacks on a Saudi refinery renewed supply concerns, reversing October 27’s decline on hopes for Middle East diplomacy; higher oil also weighed on European shares alongside earnings scrutiny. The counterweight was October 27’s technology-led U.S. rally: falling oil eased inflation concerns as the Nasdaq gained 1.14% and the S&P 500 rose 0.57%.
Conclusion: Renewed energy-supply concerns mark a shift from Tuesday’s inflation relief ahead of the October 28 Federal Reserve decision.
Glossary: Sentiment Bias = (positive articles − negative articles) ÷ total articles × 100. It ranges from −100% negative to +100% positive. A reading near zero indicates little directional bias. Neutral articles reduce the score’s strength. ▲ positive; ▼ negative; — balanced. These readings describe news coverage, not market-price direction.
Market Technical Analysis
Analysis of VIX volatility, prior-session major ETFs and mega-cap tech stocks, and real-time futures snapshots and higher-time-frame analysis.
VIX — Market Fear Gauge Daily
| Level | Open | High | MaxVix | Low | MinVix | DNC% | DOC% | VR | MaxVR | MinVR |
|---|---|---|---|---|---|---|---|---|---|---|
| 17.52 | 17.83 | 18.18 | 22.31 | 17.43 | 14.77 | -4.73% | -1.74% | 8.44 | 41.30 | -0.20 |
VIX fell 1.74% from the session's opening level. VIX fell 4.73% versus the previous session close. Expected volatility eased from the period open. VIX is 36.5% up the recent 15-session range (14.77–22.31), in the 30–40% band.
VR: ATN Volatility Ratio (VR): 8.44 – Stocks rose while expected volatility eased. VR is in the lower part of its preceding 15-session VR range (-0.20 to 41.30), in the 20–30% band. VR rose 3.85 points from the previous session, a small shift relative to that range.
Range lookback: preceding 15 completed sessions.
Major ETFs and Mega Cap Tech Stocks
- Alphabet and Microsoft earnings are in focus as investors assess AI investment returns.
- Google is using Oracle’s cloud to expand sales of its custom AI chips, while OpenAI reportedly is buying Google’s chips.
- Nvidia shares have returned to range-bound trading amid increased AI chip competition.
- Meta’s third-quarter revenue rose 26% to $64.6 billion, but its profit margin declined to 35.4% and free cash flow turned negative.
- Meta shares fell despite revenue exceeding the top end of its forecast, with shareholder dilution cited as a concern.
- Tesla closed Tuesday up 4% at $407, while its positive free cash flow reflected capital spending below analyst estimates rather than improved profitability.
- Tesla’s operating income fell 56% to $718 million, and capital expenditures totaled $4.73 billion versus roughly $7.77 billion anticipated by analysts.
- U.S. utilities have gained nearly 9% this month but remain barely positive for the year after interest-rate volatility.
- SK Hynix reported record quarterly revenue and a sevenfold profit increase.
ETF, Mag7, and Cross-Market ETF prior day Insights
Overall Tone
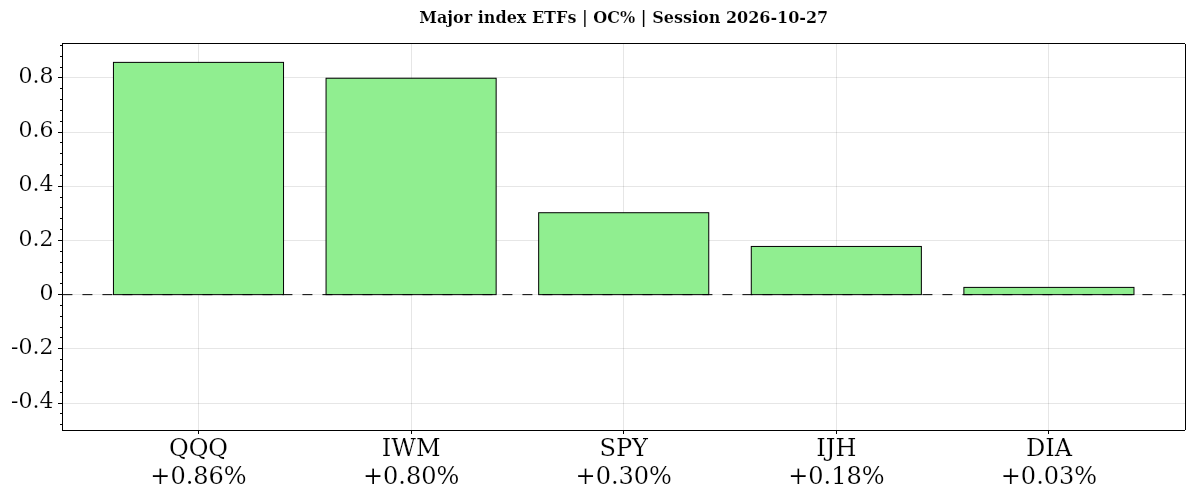
The October 27, 2026 daily session leaned risk-positive: all five index ETFs gained from the open, while mega-cap participation was uneven.
| Instrument | Bias | Date | DNC% | DOC% | O | H | L | C | VWAP | Vol |
|---|---|---|---|---|---|---|---|---|---|---|
| ▲ QQQ | ▲ ▲ ▲ | 2026-10-27 | ▲ +1.27% | ▲ +0.86% | 715.12 | 722.87 | 713.59 | 721.25 | ▲ 719.51 | 29,930,185 |
| ▲ IWM | ▲ ▲ ▲ | 2026-10-27 | ▲ +1.15% | ▲ +0.80% | 277.96 | 280.40 | 276.89 | 280.18 | ▲ 279.29 | 18,715,789 |
| ▲ SPY | ▲ ▲ ▲ | 2026-10-27 | ▲ +0.56% | ▲ +0.30% | 767.34 | 771.14 | 765.21 | 769.66 | ▲ 769.11 | 27,643,138 |
| ▲ IJH | ▲ ▲ ▲ | 2026-10-27 | ▲ +0.43% | ▲ +0.18% | 73.09 | 73.27 | 72.71 | 73.22 | ▲ 73.06 | 5,206,957 |
| ▲ DIA | ▲ ▲ ▲ | 2026-10-27 | ▲ +0.06% | ▲ +0.03% | 523.14 | 524.26 | 521.72 | 523.28 | ▲ 523.20 | 2,603,653 |
| AVG/Sum | — | — | +0.69% | +0.43% | — | — | — | — | — | 84,099,722 |
Index ETFs
Positive confluence: average DOC% +0.43% from the open, DNC% +0.69% versus the prior close. QQQ led both comparisons, followed by IWM; SPY and IJH advanced modestly, while DIA was nearly flat. All five finished above VWAP on below-average volume.
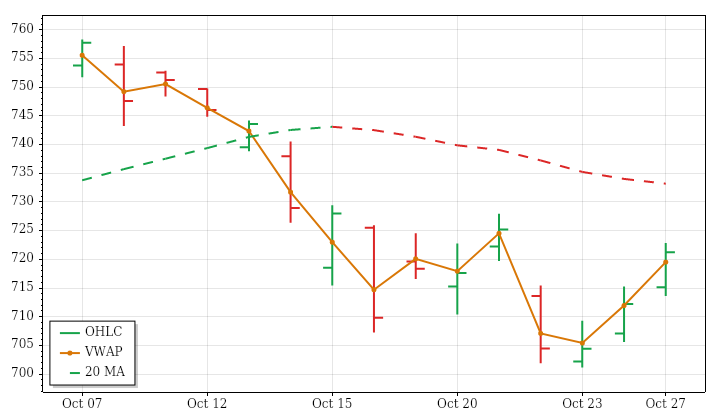
QQQ · D:2026-10-27 NC% ▲ +1.27% OC% ▲ +0.86%
QQQ – Nasdaq 100 Technicals Summary
QQQ's completed daily session on October 27 rose to 721.25, gaining 1.27% from the prior close and 0.86% from the open. Its opening gap up remained unfilled. A higher high and higher low led to a close above the previous day's high, near the session high and above VWAP, giving the latest session a clearly positive finish.
That strength did not erase the preceding 15-session downtrend. Price was above a falling near-term average but below a rising intermediate-term average, while the far-term structure retained its uptrend. The result was a recovery within an unresolved shorter-term adjustment rather than full trend alignment. The range was near average despite expanding lookback ranges, and volume was only about 78% of average despite increasing recent activity. PSAR was in a long state; a next-session low below 701.16 would trigger a bearish reversal.
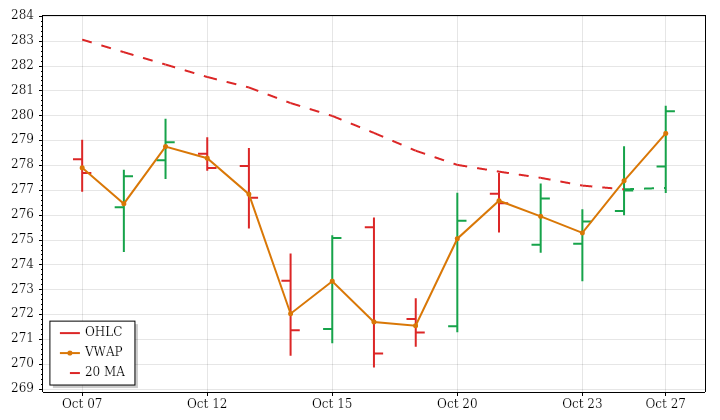
IWM · D:2026-10-27 NC% ▲ +1.15% OC% ▲ +0.80%
IWM – Small Cap Technicals Summary
IWM's completed daily session on October 27 advanced to 280.18, up 1.15% from the prior close and 0.80% from the open. Its opening gap up was filled, but the session subsequently finished above the previous day's high, near its own high and above session VWAP. The above-average range extended the broader pattern of expanding daily movement, while volume remained subdued at roughly three-quarters of average.
The rebound improved price position without fully aligning the trends. Price stood above a falling near-term average but below the falling intermediate-term average and a slightly rising far-term average. The 15-session price trend therefore remained downward despite the strong latest session. Declining lookback volume also distinguished the move from a participation-led advance. PSAR was already bullish and the median-based measure crossed upward, but a next-session low below 271.9801 would trigger a bearish PSAR reversal.
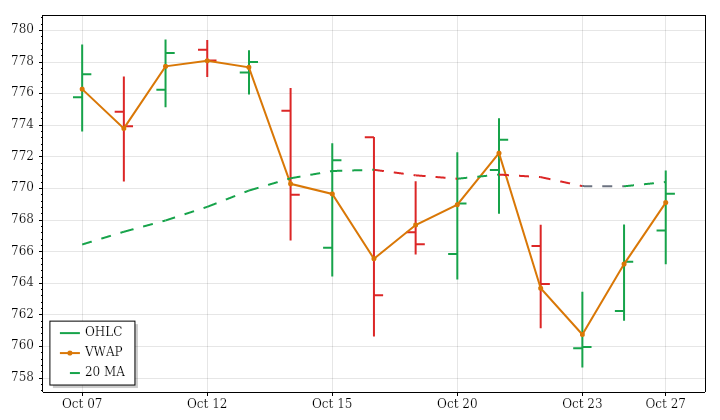
SPY · D:2026-10-27 NC% ▲ +0.56% OC% ▲ +0.30%
SPY – S&P 500 Technicals Summary
SPY's completed daily session on October 27 ended at 769.66, up 0.56% from the prior close and 0.30% from the open. The opening gap up was filled before price finished above the previous day's high. A higher high and higher low, together with a close above session VWAP, supported the positive daily result despite trading on both sides of the open.
The gain placed price above the rising intermediate- and far-term averages, while the near-term average was still falling beneath it. This left shorter-term direction mixed against a firmer broader structure. The prior 15 sessions remained a modest, inefficient downtrend. The day's range was close to average, but volume was only about 74% of average, contrasting with expanding ranges and increasing volume over the lookback. PSAR remained bearish; a next-session high above 772.9034 would trigger a bullish reversal.
IJH · D:2026-10-27 NC% ▲ +0.43% OC% ▲ +0.18%
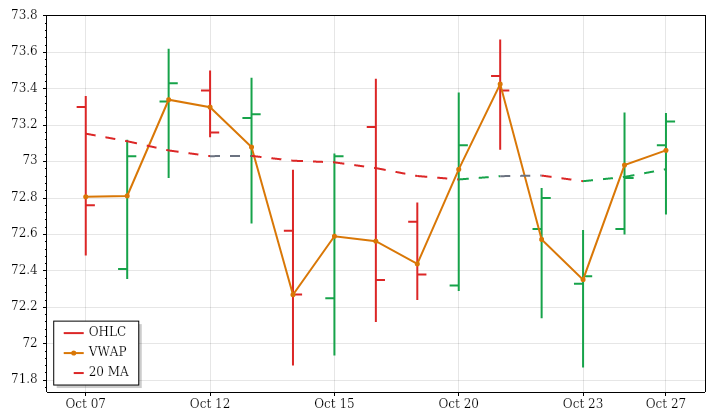
IJH – Mid Cap Technicals Summary
IJH's completed daily session on October 27 closed at 73.22, gaining 0.43% from the previous close but only 0.18% from the open. The opening gap up was filled, and the session remained entirely within the prior day's range. Its finish near the high and above session VWAP was constructive, although the inside bar showed that the advance did not extend beyond the previous session's extremes.
The moving-average picture remained conflicted. Price was above a falling near-term average, below a falling intermediate-term average and below a rising far-term average. That configuration accompanied a modest 15-session downtrend with limited net directional progress. Range and volume were below average despite expanding ranges and increasing volume over the lookback. PSAR remained bearish, with the close near its reversal threshold; only a next-session high above 73.2725 would trigger the bullish reversal.
DIA · D:2026-10-27 NC% ▲ +0.06% OC% ▲ +0.03%
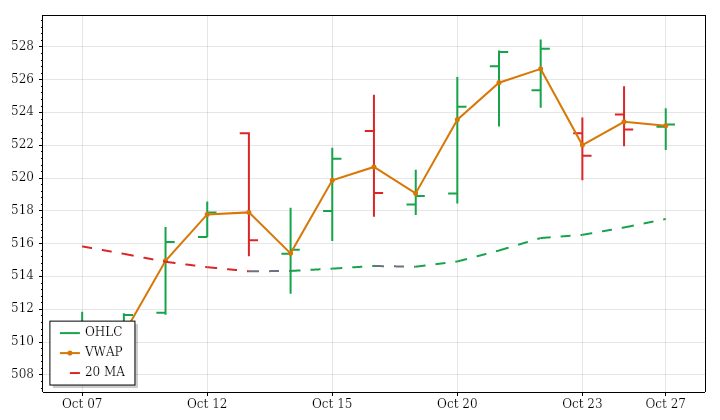
DIA – Dow Jones Technicals Summary
DIA's completed daily session on October 27 was nearly unchanged at 523.28, up 0.06% from the prior close and 0.03% from the open. The small opening gap was filled, and trading crossed both sides of the open. Although the close was marginally above session VWAP, it remained inside the prior day's range after a lower high and lower low, making the session more a pause than a clear directional extension.
The broader 15-session price trend remained upward, but the moving-average picture was uneven. Price sat just below the rising near-term average and above a falling intermediate-term average, while the far-term uptrend remained intact. The day's range was only about 55% of average, contrasting with expanding lookback ranges. Below-average volume matched the declining volume trend. PSAR remained bearish; a next-session high above 527.6144 would trigger a bullish reversal.
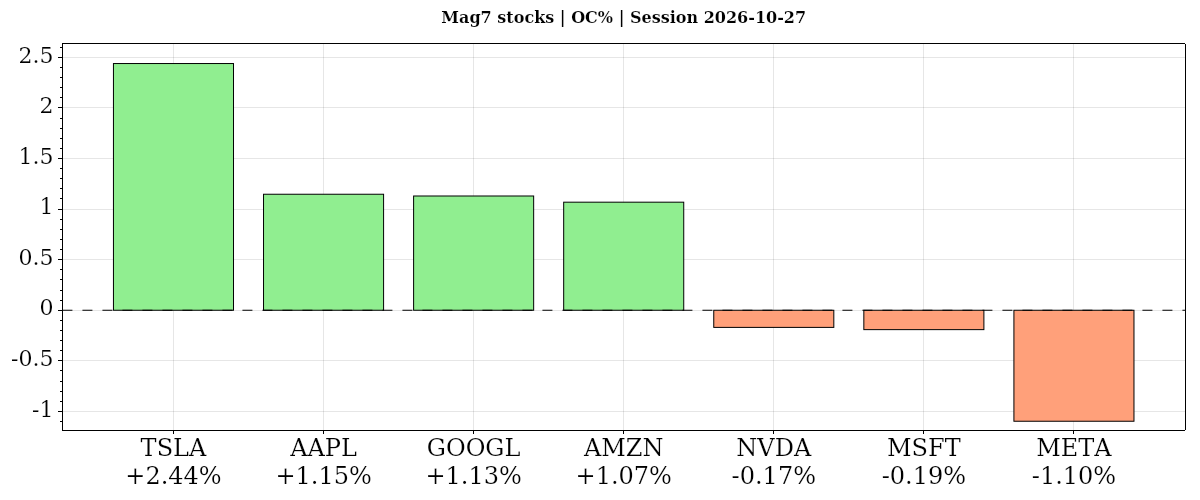
| Instrument | Bias | Date | DNC% | DOC% | O | H | L | C | VWAP | Vol |
|---|---|---|---|---|---|---|---|---|---|---|
| ▲ TSLA | ▲ ▲ ▲ | 2026-10-27 | ▲ +4.04% | ▲ +2.44% | 397.76 | 408.45 | 395.25 | 407.46 | ▲ 404.37 | 44,851,687 |
| ▲ AAPL | ▲ ▲ ▲ | 2026-10-27 | ▲ +0.93% | ▲ +1.15% | 343.17 | 347.78 | 342.39 | 347.10 | ▲ 346.29 | 38,289,690 |
| ▲ GOOGL | ▲ ▲ ▼ | 2026-10-27 | ▲ +1.19% | ▲ +1.13% | 317.00 | 323.88 | 316.86 | 320.58 | ▼ 320.61 | 28,520,958 |
| ▲ AMZN | ▲ ▲ ▲ | 2026-10-27 | ▲ +1.61% | ▲ +1.07% | 250.43 | 254.68 | 248.71 | 253.10 | ▲ 252.67 | 33,810,887 |
| ▼ NVDA | ▲ ▼ ▲ | 2026-10-27 | ▲ +0.90% | ▼ -0.17% | 218.31 | 219.19 | 215.53 | 217.94 | ▲ 217.71 | 84,838,877 |
| ▼ MSFT | ▼ ▼ ▼ | 2026-10-27 | ▼ -0.24% | ▼ -0.19% | 532.35 | 534.70 | 528.33 | 531.33 | ▼ 531.72 | 19,134,470 |
| ▼ META | ▼ ▼ ▼ | 2026-10-27 | ▼ -1.64% | ▼ -1.10% | 627.07 | 628.46 | 619.21 | 620.19 | ▼ 622.90 | 50,673,529 |
| AVG/Sum | — | — | +0.97% | +0.62% | — | — | — | — | — | 300,120,098 |
Mag7 Stocks
Positive confluence: average DOC% +0.62% from the open, DNC% +0.97% versus the prior close. TSLA led both, rising 2.44% from the open, while META lagged; four gained from the open versus five above the prior close, as NVDA’s comparisons diverged. TSLA’s breakout had above-average volume; AAPL retained aligned moving-average uptrends, while MSFT declined despite rising structures.
TSLA · D:2026-10-27 NC% ▲ +4.04% OC% ▲ +2.44%
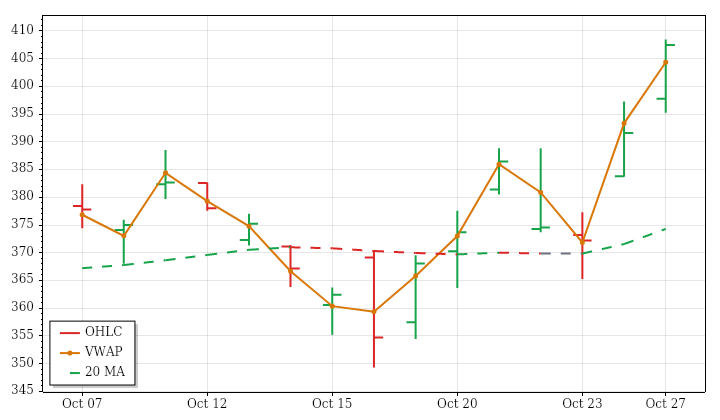
TSLA – Tesla Technicals Summary
TSLA's completed daily session on October 27 climbed to 407.46, gaining 4.04% from the prior close and 2.44% from the open. The opening gap above the prior day's range remained unfilled. Price made a higher high and higher low and finished above the previous day's high, near its own high and above session VWAP, combining a strong opening position with further intraday gains.
The advance aligned with rising near- and intermediate-term structures, while the far-term average was still falling beneath price. The broader trend was therefore not uniformly bullish, and the 15-session price advance had shown limited directional efficiency. This session nevertheless brought both above-average range and volume, consistent with expanding ranges and increasing participation over the lookback; it was also the fourth consecutive large-range session. PSAR remained bullish, with a next-session low below 366.6577 required to trigger a bearish reversal.
Tesla News and Fundamentals
Tesla reported $28 billion in third-quarter revenue and delivered 486,532 vehicles, while inventory days declined from 15 to 11. An analysis cautioned that normalized margins were weaker after adjusting for substantial tariff refunds. Full Self-Driving reached 1.74 million paying customers, with reported North American attach rates exceeding 75% and annual recurring revenue approaching $1 billion. Separate reporting indicated Tesla had curbed some of its recently elevated production costs.
AAPL · D:2026-10-27 NC% ▲ +0.93% OC% ▲ +1.15%
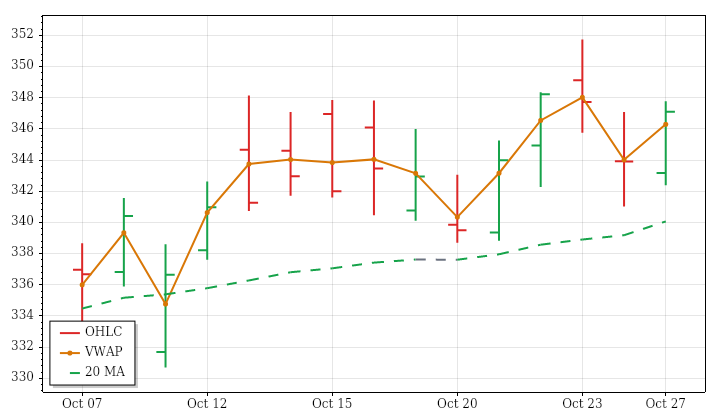
AAPL – Apple Technicals Summary
AAPL's completed daily session on October 27 closed at 347.10, gaining 0.93% from the prior close and 1.15% from the open. An initial gap down was filled, and the session produced a higher high and higher low before finishing above the previous day's high and near its own high. The close also stood above session VWAP, reinforcing the positive finish despite trading on both sides of the open.
That advance aligned with rising near-, intermediate- and far-term moving-average structures and the broader 15-session price uptrend. However, the day's range and volume were slightly below their recent averages, contrasting with expanding ranges and increasing volume across the lookback. The trend alignment therefore remained stronger than the latest session's participation. PSAR still indicated a downtrend; a next-session high above 351.195 would trigger a bullish reversal, rather than representing one already confirmed.
Apple News and Fundamentals
On Oct. 27, Apple unveiled a 14-inch MacBook Pro and iMac powered by its M6 chip, touting faster on-device AI performance. It also released iOS 27.2 with additional Siri AI languages, improved memory functions, message suggestions and Apple Pencil support for the foldable iPhone Duo. Apple acknowledged display problems affecting some newly launched iPhone Duo devices and offered replacements for faulty units.
GOOGL · D:2026-10-27 NC% ▲ +1.19% OC% ▲ +1.13%
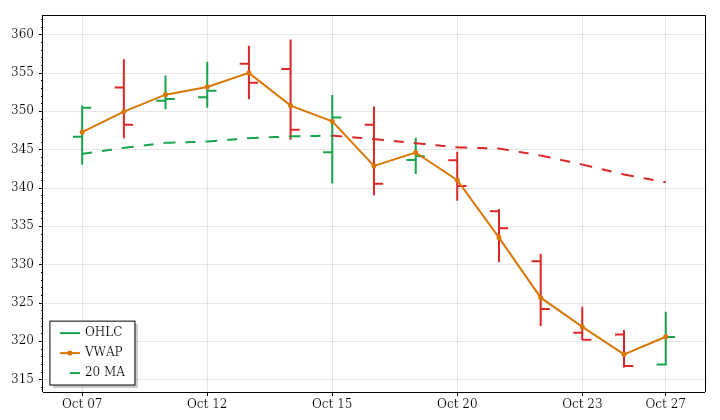
GOOGL – Alphabet Technicals Summary
GOOGL's completed daily session on October 27 closed at 320.58, up 1.19% from the prior close and 1.13% from the open. The small opening gap up remained unfilled, and price made a higher high and higher low. However, the close stayed inside the previous day's range and fractionally below session VWAP, tempering the strength implied by the daily gain.
The advance was a countertrend move within falling near-, intermediate- and far-term moving-average structures. The preceding 15-session price decline also showed substantially more directional persistence than a purely sideways market. Volume reached about 126% of average, consistent with increasing lookback volume, while the slightly below-average range matched the broader contraction in ranges. Increased activity thus accompanied a rebound without resolving the bearish trend alignment. PSAR remained in a downtrend; a next-session high above 331.7033 would trigger a bullish reversal.
AMZN · D:2026-10-27 NC% ▲ +1.61% OC% ▲ +1.07%
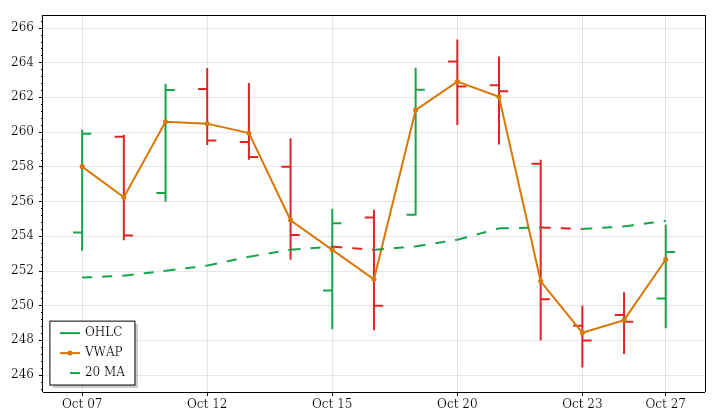
AMZN – Amazon Technicals Summary
AMZN's completed daily session on October 27 ended at 253.10, up 1.61% against the prior close and 1.07% from the open. The opening gap up was filled before the stock finished above the previous day's high. A higher high and higher low, together with a close above session VWAP, gave the latest session a positive direction despite its back-and-forth trading.
The recovery did not resolve the broader technical conflict. Price remained below rising near- and intermediate-term averages, while the far-term structure retained an uptrend. Across the prior 15 sessions, price trended lower with very little net directional progress. The day's range was approximately average and volume modestly below average, against contracting lookback ranges and increasing volume. PSAR and the median-based trend measure remained bearish. A next-session high above 260.986 would trigger a bullish PSAR reversal, but that condition had not occurred.
Amazon News and Fundamentals
Amazon will report third-quarter results after market hours on Oct. 29, with AWS growth and substantial AI and cloud capital spending in focus. Earnings previews flagged potential pressure on earnings and free cash flow from those investments. Separately, an internal memo discouraged engineering teams from measuring AI adoption solely through token consumption or generated code, calling those measures deeply flawed and emphasizing business impact instead.
NVDA · D:2026-10-27 NC% ▲ +0.90% OC% ▼ -0.17%
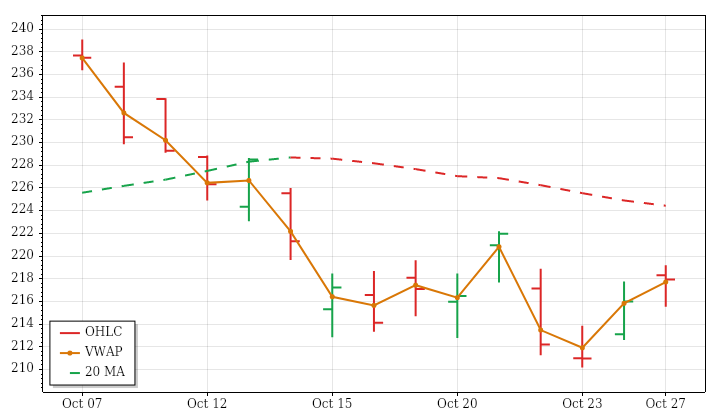
NVDA – Nvidia Technicals Summary
NVDA's completed daily session on October 27 closed at 217.94, up 0.90% from the prior close but down 0.17% from the open. That distinction matters: an opening gap above the previous day's range supplied the net daily gain, although the gap was subsequently filled. Price still made a higher high and higher low and closed above the prior day's high, with a finish slightly above session VWAP.
The broader picture remained mixed following a falling 15-session price trend. Price was above a declining near-term average, below a rising intermediate-term average and above a rising far-term average. The latest recovery therefore coexisted with unresolved shorter-term weakness. Both range and volume were below average; the range opposed recent expansion, while volume matched a nearly flat-to-declining lookback trend. PSAR remained bearish, with a next-session high above 219.4217 needed to trigger a bullish reversal.
Nvidia News and Fundamentals
Nvidia announced a $3 billion investment in Meta’s equity offering and expanded their collaboration on Muse AI models. Nvidia and Oracle also announced general availability of Vera Rubin NVL72 systems and Vera CPUs on Oracle Cloud Infrastructure, with HGX Rubin NVL8 systems planned. Separately, Nvidia backed Simplismart in a $14 million funding round. Reporting said Chinese technology companies ordered over $35 billion in Nvidia chips, but supply constraints threaten deliveries as shipments to China have fallen 44%.
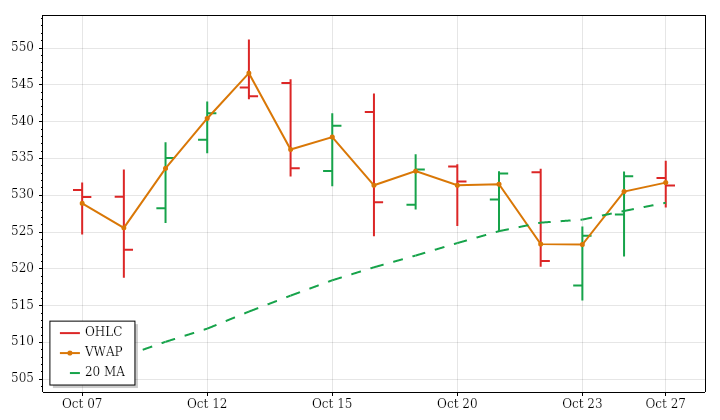
MSFT · D:2026-10-27 NC% ▼ -0.24% OC% ▼ -0.19%
MSFT – Microsoft Technicals Summary
MSFT's completed daily session on October 27 slipped to 531.33, down 0.24% from the prior close and 0.19% from the open. The small opening gap down was filled, and price formed a higher high and higher low. Nevertheless, the close remained inside the previous day's range, close to the open and slightly below session VWAP, showing limited net direction rather than a decisive downside extension.
The daily loss contrasted with aligned rising near-, intermediate- and far-term moving-average structures. Meanwhile, the prior 15 sessions showed a slight price downtrend with little directional efficiency, distinguishing recent choppiness from the broader upward alignment. The latest range was well below average despite expanding lookback ranges; volume was near average against a declining volume trend. PSAR was in a long state, but a next-session low below 515.7 would trigger a bearish reversal.
Microsoft News and Fundamentals
Microsoft offered voluntary buyouts to approximately 60,000 employees, with a staff memo identifying eligible workers at experience level 70 or below in the United States, Canada, India and the United Kingdom. Reporting linked the program to cost containment and AI infrastructure investment. Microsoft will release fiscal first-quarter results after the close on Oct. 28, its first report under a new two-segment structure. Earnings previews highlighted AI infrastructure costs and capacity constraints as margin risks.
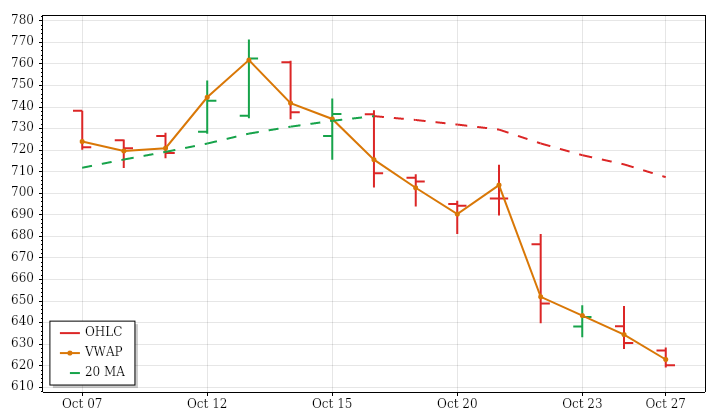
META · D:2026-10-27 NC% ▼ -1.64% OC% ▼ -1.10%
META – Meta Platforms Technicals Summary
META's completed daily session on October 27 fell to 620.19, losing 1.64% from the prior close and 1.10% from the open. An opening gap below the prior day's range remained unfilled. The session then made a lower high and lower low and finished below the previous day's low, near its own low and below session VWAP, extending the recent weakness.
The decline aligned with the falling near-term structure and the pronounced 15-session price downtrend. Intermediate- and far-term averages were still rising, but price remained below both, leaving those horizons conflicted rather than confirming an established uptrend. Volume was about two and a half times average, consistent with increasing lookback activity, while the day's unusually small range contrasted with expanding recent ranges. PSAR remained bearish; a next-session high above 679.6178 would trigger a bullish reversal, a condition not established by this session.
Meta News and Fundamentals
Meta plans to issue up to $60 billion in nonvoting Class C shares through an at-the-market offering, following a one-for-one distribution to existing shareholders scheduled for January. Norway’s main media organizations took legal action on Oct. 27 to block new Meta user terms they claim threaten rights to journalistic content. Newly unsealed court documents reportedly show employees discussing efforts to discredit social-media critic Jonathan Haidt. AI director Rohit Patel is leaving after eight years to launch startup Ndoc.
| Instrument | Bias | Date | DNC% | DOC% | O | H | L | C | VWAP | Vol |
|---|---|---|---|---|---|---|---|---|---|---|
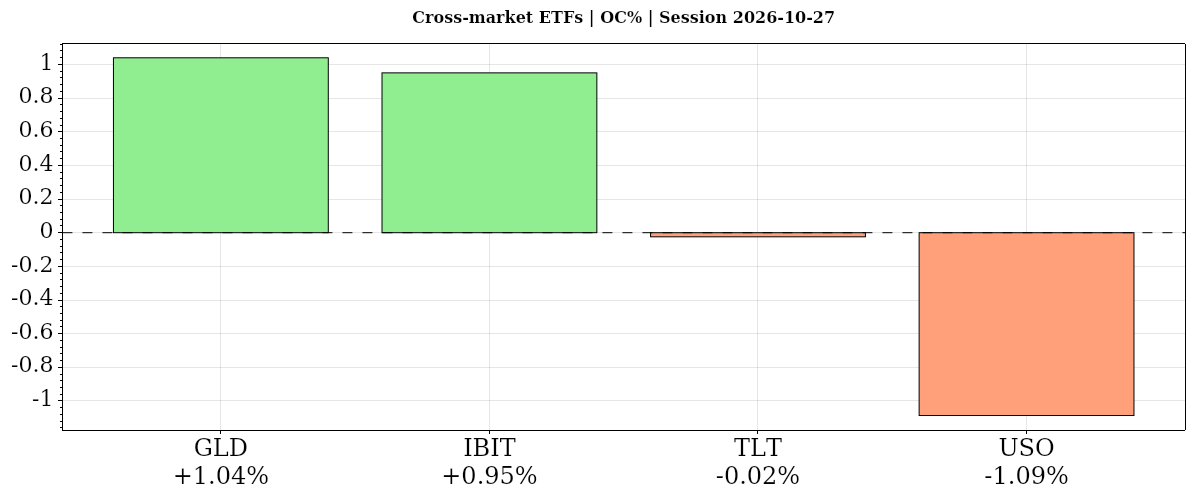
| ▲ GLD | ▲ ▲ ▲ | 2026-10-27 | ▲ +1.21% | ▲ +1.04% | 368.45 | 372.59 | 368.45 | 372.28 | ▲ 371.44 | 5,157,825 |
| ▲ IBIT | ▲ ▲ ▲ | 2026-10-27 | ▲ +1.06% | ▲ +0.95% | 45.27 | 45.71 | 45.12 | 45.70 | ▲ 45.47 | 25,795,282 |
| ▼ TLT | ▼ ▼ ▲ | 2026-10-27 | ▼ -0.06% | ▼ -0.02% | 81.65 | 81.72 | 81.47 | 81.63 | ▲ 81.63 | 19,529,425 |
| ▼ USO | ▼ ▼ ▼ | 2026-10-27 | ▼ -1.41% | ▼ -1.09% | 165.68 | 166.73 | 162.69 | 163.88 | ▼ 164.02 | 3,540,164 |
| AVG/Sum | — | — | +0.20% | +0.22% | — | — | — | — | — | 54,022,696 |
Cross-Market ETFs
Positive confluence: average DOC% +0.22% from the open, DNC% +0.20% versus the prior close. Gold and bitcoin gained on both comparisons; oil fell, diverging from equities, while bonds edged lower with a near-flat open-to-close result. Gold’s gain contrasted with falling moving-average structures; oil’s decline left its uptrends intact.
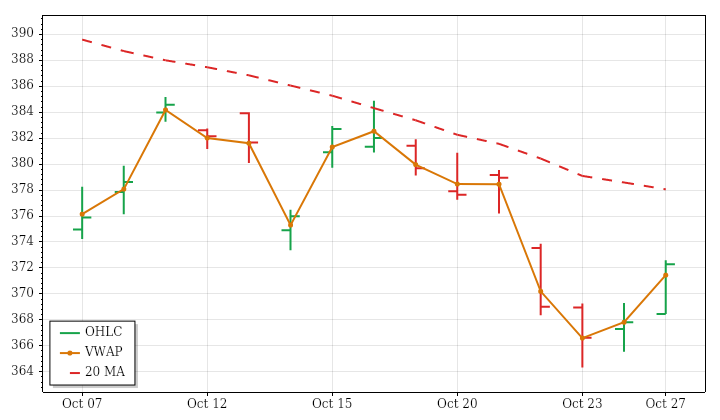
GLD · D:2026-10-27 NC% ▲ +1.21% OC% ▲ +1.04%
GLD – Gold Technicals Summary
GLD's completed daily session on October 27 rose to 372.28, gaining 1.21% from the prior close and 1.04% from the open. Its opening gap up remained unfilled, and the session established a higher high and higher low before closing above the previous day's high and near its own high. A finish above session VWAP reinforced the strength of the day's rebound.
That rebound nevertheless ran against falling near-, intermediate- and far-term moving-average structures and the 15-session price downtrend. The range was above average, consistent with expanding lookback ranges and a fourth consecutive large-range session. Participation diverged: volume was only about 63% of average even though the broader volume trend was increasing. The positive price action therefore did not establish broad trend alignment. PSAR remained bearish; a next-session high above 380.1432 would trigger a bullish reversal, not confirm one in advance.
Gold News and Fundamentals
Gold recovered from early losses on Oct. 27 and climbed above $4,050 in late U.S. trading. Kitco attributed renewed precious-metals buying to declining crude prices easing inflation concerns ahead of the Federal Reserve’s Oct. 28 policy decision. Earlier weakness was linked to expectations of further Fed tightening and uncertainty over Middle East energy supplies. Gold also reached a session high after October consumer confidence rose to 91.7, above forecasts of 81.
IBIT · D:2026-10-27 NC% ▲ +1.06% OC% ▲ +0.95%
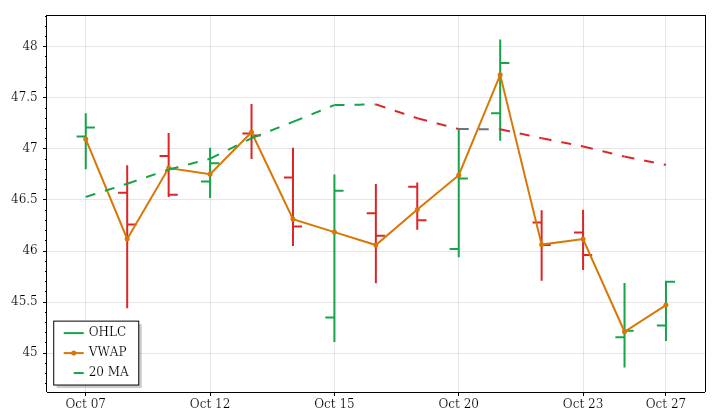
IBIT – Bitcoin Technicals Summary
IBIT's completed daily session on October 27 finished at 45.70, up 1.06% versus the prior close and 0.95% from the open. After filling its opening gap up, it formed a higher high and higher low and closed above the previous day's high, near the session high. The close above session VWAP added to the positive character of the latest day's recovery.
Shorter-term weakness nevertheless remained within a rising far-term structure. Price was still below a falling near-term average and below a rising intermediate-term average, leaving those horizons bearish and mixed, respectively. The 15-session price trend also remained downward. Both range and volume were around 70% of average: the narrow session opposed expanding lookback ranges, while subdued participation matched declining volume. PSAR remained bearish, and a next-session high above 47.9095 would be required to trigger its bullish reversal.
TLT · D:2026-10-27 NC% ▼ -0.06% OC% ▼ -0.02%
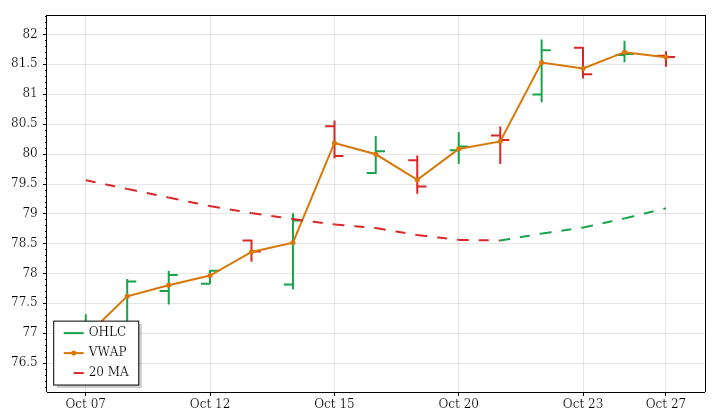
TLT – Long-Term Treasury Bonds Technicals Summary
TLT's completed daily session on October 27 was essentially flat at 81.63, down 0.06% from the previous close and 0.02% from the open. Its small opening gap down was filled. Although the session recorded a lower high and lower low, the close stayed inside the previous day's range, near the open and marginally above session VWAP, indicating little net movement.
The pause followed a comparatively directional 15-session advance. Near-term averages remained rising beneath price, but the intermediate-term average was still falling and the far-term structure remained bearish above price. Short-term strength therefore continued to conflict with the longer-term trend. The day's range was about 40% of average, consistent with contracting lookback ranges, while volume fell to roughly half of average despite an increasing recent trend. PSAR remained bullish; a next-session low below 80.8525 would trigger a bearish reversal.
USO · D:2026-10-27 NC% ▼ -1.41% OC% ▼ -1.09%
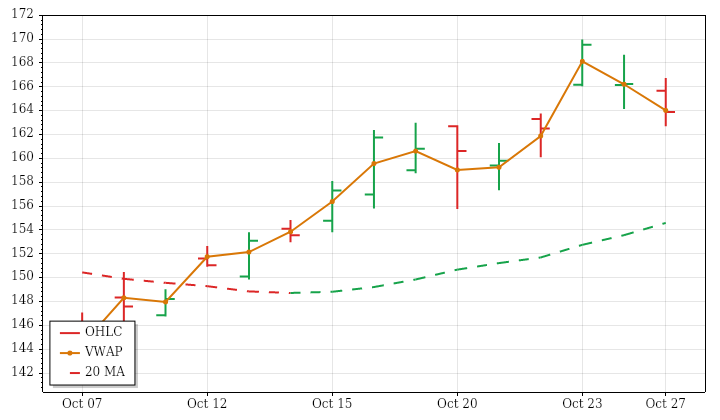
USO – Oil Technicals Summary
USO's completed daily session on October 27 declined to 163.88, down 1.41% from the prior close and 1.09% from the open. The opening gap down was filled, but the session subsequently formed a lower high and lower low and closed below the previous day's low. Its finish below session VWAP reinforced the negative direction of the latest day's trading.
That weakness contrasted with aligned rising near-, intermediate- and far-term moving-average structures and a comparatively directional 15-session price uptrend. Price remained above all three trend benchmarks, so the latest decline had not overturned that alignment. The range was approximately average despite expanding lookback ranges, while volume was about 76% of average despite increasing recent participation. The pullback therefore occurred on lighter activity than usual. PSAR remained bullish; a next-session low below 162.69 would trigger a bearish reversal, rather than being a confirmed change already.
Oil News and Fundamentals
U.S. benchmark crude slipped below $100 a barrel on Oct. 27 as diplomatic efforts raised hopes of easing Middle East tensions, before later reporting showed oil gaining as supply risks remained in focus. The IEA said it was ready to act again following its oil-stock release and was discussing next steps with member governments. U.S. Energy Secretary Chris Wright said additional Russian diesel shipments could be permitted, following an agreement allowing 800,000 metric tons of exports in October and November.
Glossary: Instrument — ticker symbol; hover for the instrument or company name; Date — session date. DNC% — prior-session close to this session’s close; DOC% — daily session open-to-close percentage change. O — open; H — high; L — low; C — close, all for the table’s daily or weekly session; VWAP — volume-weighted average price; its arrow shows whether the close is above or below VWAP. Vol — period trading volume.
Bias — three directional readings, in order: DNC%, DOC%, then VWAP. ▲ positive/above; ▼ negative/below; — neutral or unavailable. Matching arrows show alignment; opposing arrows show mixed conditions. AVG/Sum — simple average of percentage changes and sum of reported volumes.
Futures Session Fib Grid Analysis – Snapshot
Session Fib Grids normalise market positioning as percentages, making direction and alignment comparable across different asset types.
Latest available snapshot for each instrument; Time(CT) shows the individual update date and time.
| Instrument | Bias | Time(CT) | YSFG | MSFG | WSFG | RSFG | SFG | TSI |
|---|---|---|---|---|---|---|---|---|
| ▲ ES | ▲ ▲ ▲ ▲ ▲ ▲ | 2026-10-28 06:40:41 | ▲ +60 | ▲ +10 | ▲ +57 | ▲ +56 | ▲ +20 | ▲ +102 |
| ▲ NQ | ▲ ▼ ▲ ▲ ▼ ▲ | 2026-10-28 06:40:54 | ▲ +75 | ▼ -50 | ▲ +62 | ▲ +83 | ▼ -2 | ▲ +67 |
| ▼ YM | ▲ ▲ ▼ ▼ ▲ ▲ | 2026-10-28 06:40:50 | ▲ +34 | ▲ +60 | ▼ -5 | ▼ -14 | ▲ +18 | ▲ +41 |
| ▲ EMD | ▲ ▲ ▲ ▲ ▲ ▲ | 2026-10-28 06:38:31 | ▲ +33 | ▲ +29 | ▲ +34 | ▲ +20 | ▲ +26 | ▲ +118 |
| ▲ RTY | ▲ ▼ ▲ ▲ ▲ ▲ | 2026-10-28 06:40:50 | ▲ +38 | ▼ -1 | ▲ +32 | ▲ +65 | ▲ +16 | ▲ +49 |
| ▲ FDAX | ▲ ▲ ▲ ▲ ▲ ▲ | 2026-10-28 06:40:47 | ▲ +18 | ▲ +53 | ▲ +50 | ▲ +29 | ▲ +29 | ▲ +98 |
| ▼ NKD | ▲ ▼ ▲ ▼ ▼ ▲ | 2026-10-28 06:40:32 | ▲ +165 | ▼ -66 | ▲ +36 | ▼ -9 | ▼ -16 | ▲ +25 |
| Instrument | Bias | Time(CT) | YSFG | MSFG | WSFG | RSFG | SFG | TSI |
|---|---|---|---|---|---|---|---|---|
| ▲ BTC | ▼ ▼ ▲ ▲ ▲ ▲ | 2026-10-28 06:40:41 | ▼ -34 | ▼ -22 | ▲ +23 | ▲ +84 | ▲ +34 | ▲ +45 |
| ▲ GC | ▼ ▼ ▲ ▲ ▲ ▲ | 2026-10-28 06:40:36 | ▼ -133 | ▼ -40 | ▲ +21 | ▲ +57 | ▲ +32 | ▲ +34 |
| ▲ CL | ▲ ▲ ▲ ▲ ▲ ▲ | 2026-10-28 06:40:54 | ▲ +190 | ▲ +86 | ▲ +9 | ▲ +25 | ▲ +1 | ▲ +78 |
| ▼ 6E | ▼ ▼ ▼ ▼ ▲ ▲ | 2026-10-28 06:40:48 | ▼ -62 | ▼ -108 | ▼ -72 | ▼ -54 | ▲ +29 | ▲ +15 |
| ▼ ZB | ▼ ▲ ▲ ▼ ▼ ▲ | 2026-10-21 09:39:59 | ▼ -39 | ▲ +77 | ▲ +6 | ▼ -3 | ▼ -2 | ▲ +29 |
Glossary: YSFG — yearly; MSFG — monthly; WSFG — weekly; RSFG — regular trading hours (RTH); SFG — the current session, including pre-market or other sessions. TSI indicates trend strength and power.
Bias shows trend alignment across these six readings. The arrows follow the column order: YSFG, MSFG, WSFG, RSFG, SFG and TSI. Matching arrows show alignment; opposing arrows show mixed conditions.
Futures Higher Time Frame Analysis
Summary of the current state of US Indices Futures based on higher time-frame (HTF) technical analysis as of: 2026-10-28 07:16 -05:00 CT.
US Indices Futures
- ES YSFG/MSFG/WSFG above F0%, daily short-term benchmarks overhead, weekly pivots UTrend, daily pivots DTrend, support 7648.50–7695.00, resistance 7897.50–7906.25.
- NQ YSFG/WSFG upward, MSFG below F0%, daily 5/10 benchmarks rising, 20/55 declining, pivots DTrend, support 28987.00, daily reversal 30102.50, weekly resistance 31616.50.
- YM YSFG/MSFG above F0%, WSFG below F0%, short-term benchmarks overhead, pivots DTrend, support 50859, daily pivot references 51970/53168, weekly reversal 53199.
- EMD YSFG/MSFG/WSFG above F0%, daily 5/10 benchmarks supportive, 100/200 declining overhead, pivots DTrend, support 3600.3, daily reversal 3704.5, resistance 3737.8–3791.9.
- RTY YSFG/WSFG above F0%, MSFG below F0%, daily 5/10/20 benchmarks rising, 55/100/200 overhead, daily pivots UTrend, weekly DTrend, support 2723.3, resistance 2831.7–2888.9.
- FDAX YSFG/MSFG/WSFG above F0%, all benchmarks rising beneath price, daily pivots UTrend, weekly short-term DTrend, support 24925–25119, resistance 25759–25890, weekly reversal 26255.
Overall State
- Short-Term: Neutral
- Intermediate-Term: Neutral
- Long-Term: Bullish
Conclusion
HTF alignment remains mixed beneath broadly bullish weekly long-term structures. ES and FDAX retain upward grid alignment; FDAX also holds above all rising daily benchmarks. YM remains below WSFG F0% and short-term benchmarks. NQ and RTY daily rebounds contrast with MSFG weakness and intermediate downtrends. EMD retains upward weekly grid alignment and recent weekly long signals, but remains below declining daily 100- and 200-period benchmarks. RTY’s recent long-term signal contrasts with its weekly corrective pivot sequence. Across instruments, short-term recoveries are not uniformly aligned with weekly pivots; the listed swing highs, reversal thresholds, and support levels define the principal structural boundaries.
Note: Intra-day counter-trend pullbacks or retracements may occur, HTF is context for informational usage and market structure. Glossary: Session Fib Grids periods of YSFG:’Yearly’, MSFG:’Monthly’, WSFG:’Weekly’
For full details visit: AlphaWebTrader Technicals
SPY Daily View
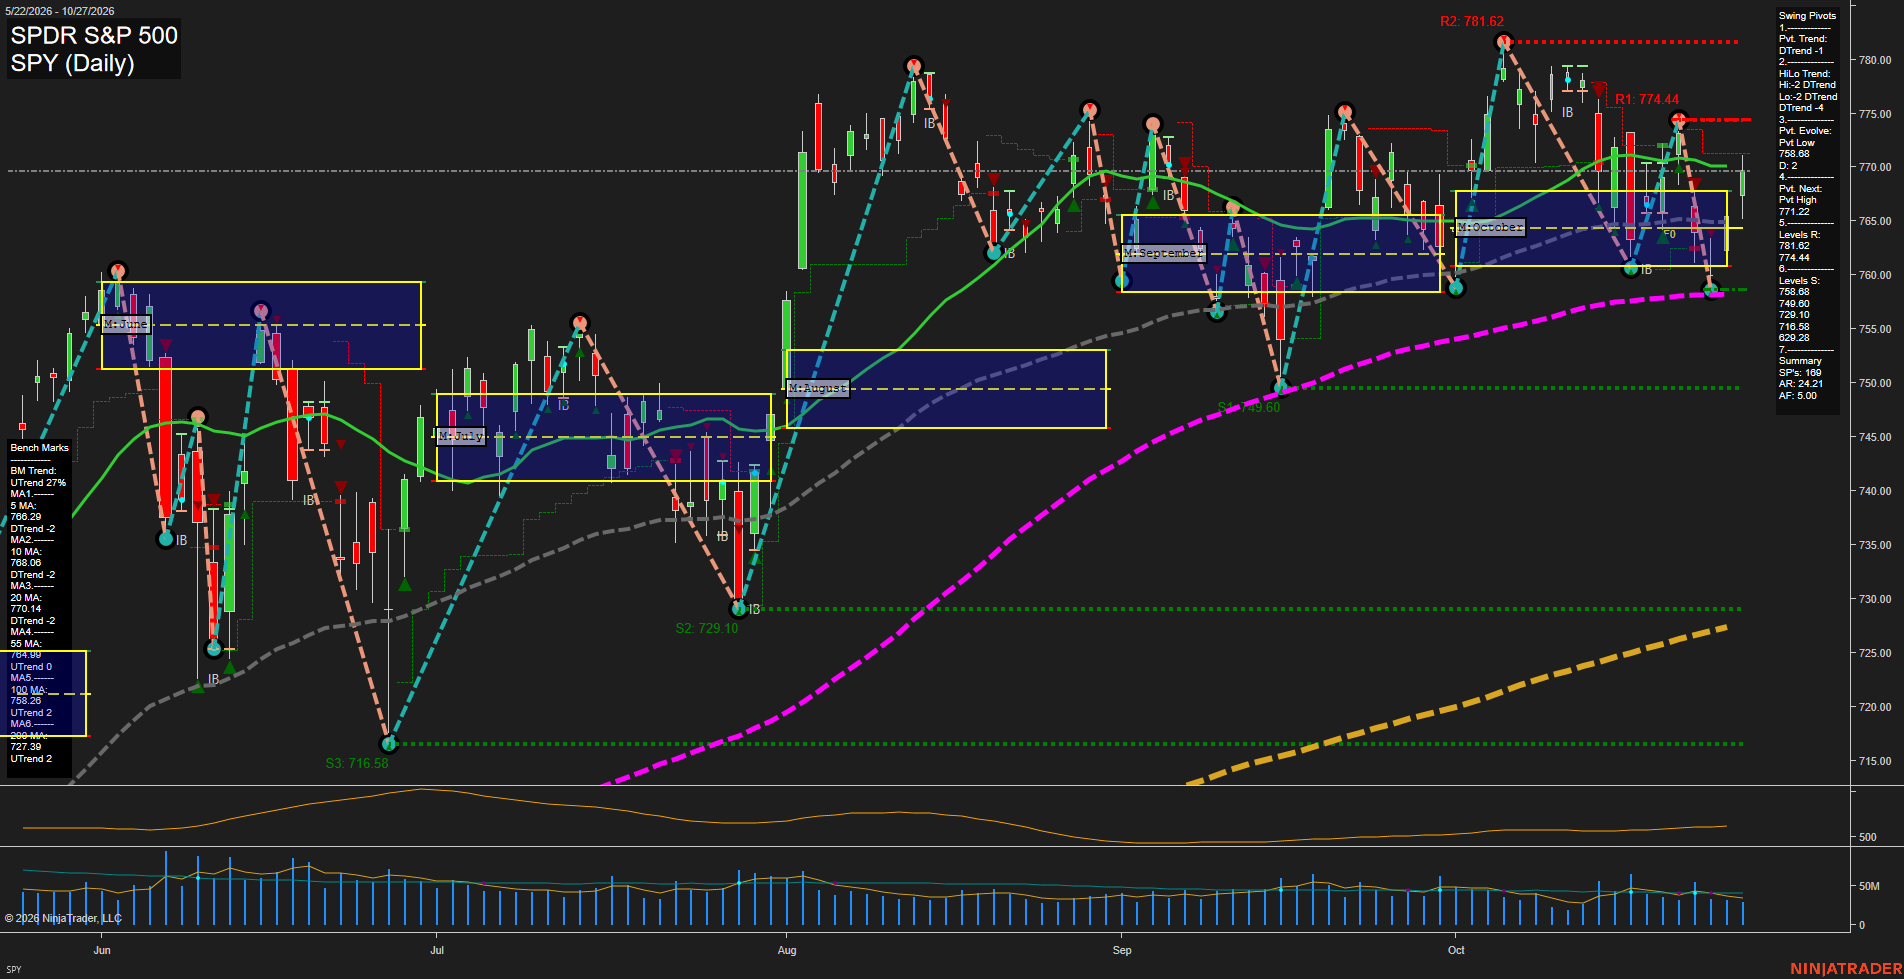
Overall Rating
- Short-Term: Neutral
- Intermediate-Term: Neutral
- Long-Term: Bullish.
Key Insights Summary
SPY, as an equity-index futures proxy, is consolidating following a sharp October swing sequence. Price recovered from the 758.68 pivot low and is holding above the rising 55-day, 100-day, and 200-day benchmarks, preserving the broader bullish structure. Short-term pivot and HiLo trends remain down, however, with price clustered around the declining 10-day and 20-day averages. The 771.22 to 774.44 area defines the nearby overhead pivot band, while 758.68 is the principal swing support; the wide 24.21 ATR reflects an elevated daily rotation environment rather than a low-volatility trend advance.
View charts on: AlphaWebTrader HTF Charts
ES Daily View
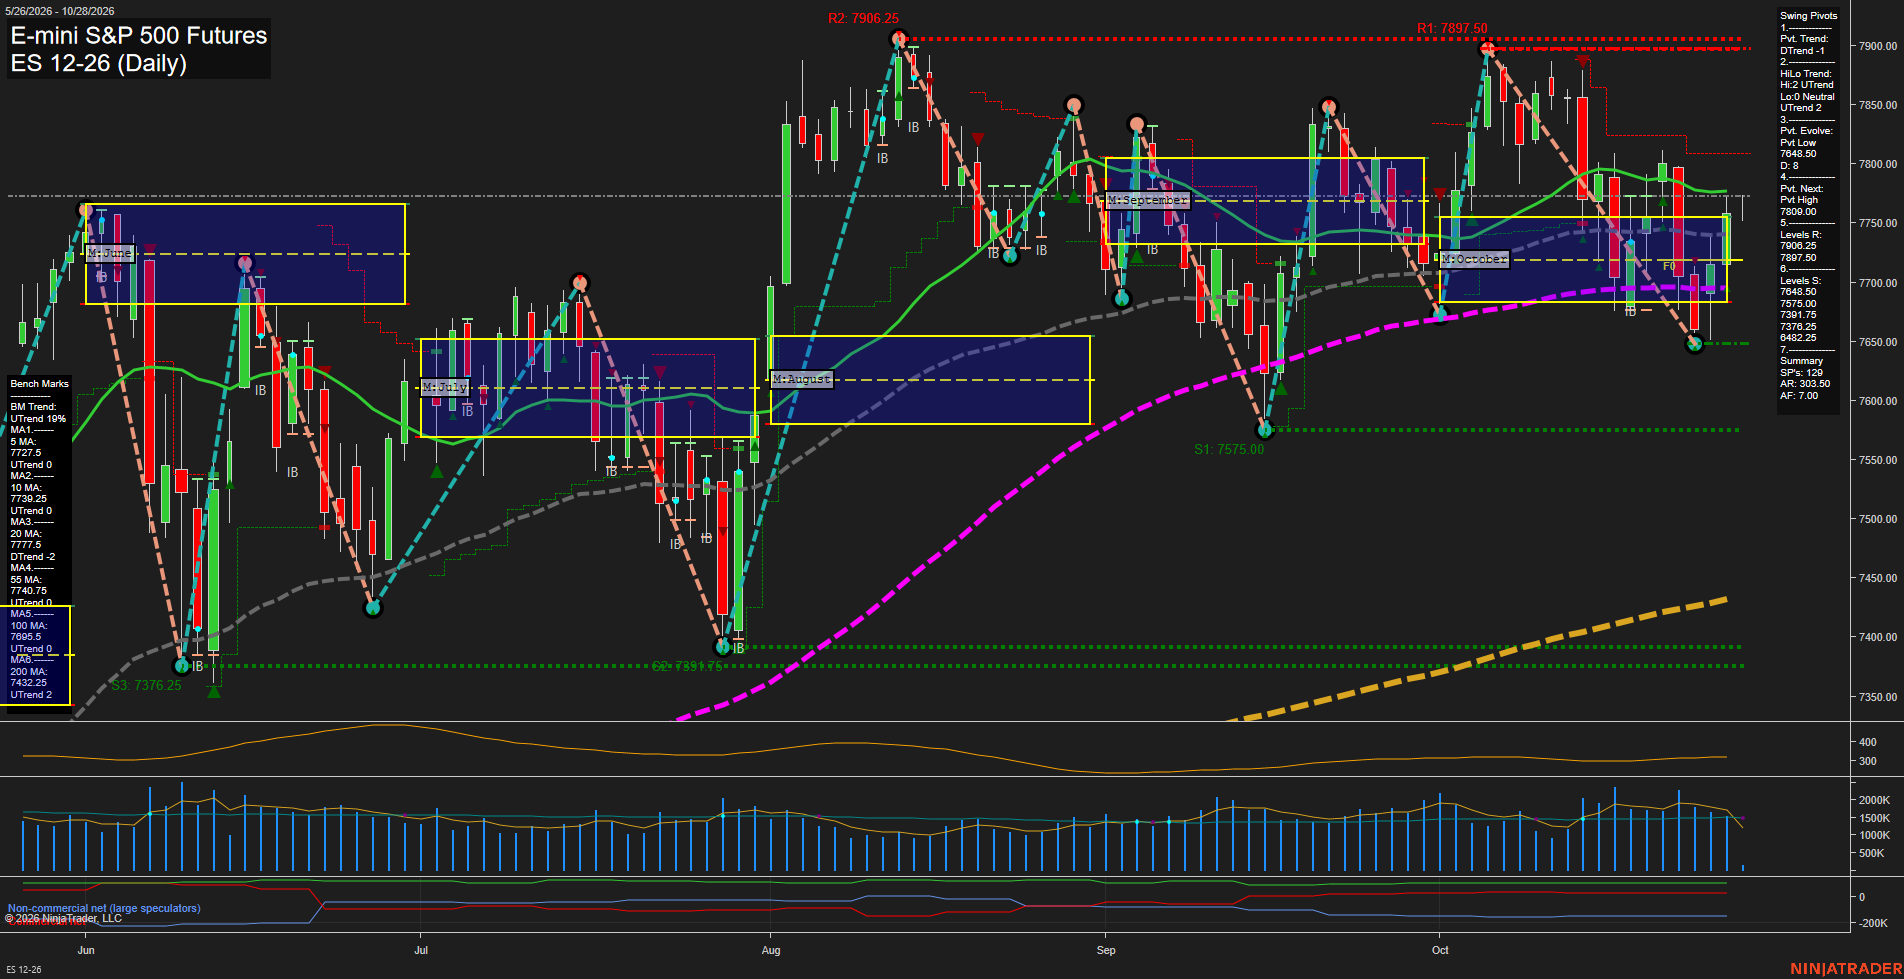
Overall Rating
- Short-Term: Neutral
- Intermediate-Term: Bullish
- Long-Term: Bullish.
Key Insights Summary
The daily structure is consolidative after the October rejection beneath the 7897.50-7906.25 resistance band. Short-term pivots remain in a DTrend and price is below the 5, 10, 20, and 55 day benchmark area, reflecting a slow pullback rather than impulsive downside momentum. The intermediate HiLo trend, monthly grid, and longer benchmark alignment remain constructive, with 7648.50 defining the key recent higher-low pivot and 7695.00 providing nearby long-term moving-average support. Volatility remains elevated on the ATR measure, while recent smaller bars indicate compression following the sharp October swings.
View charts on: AlphaWebTrader HTF Charts
QQQ Daily View
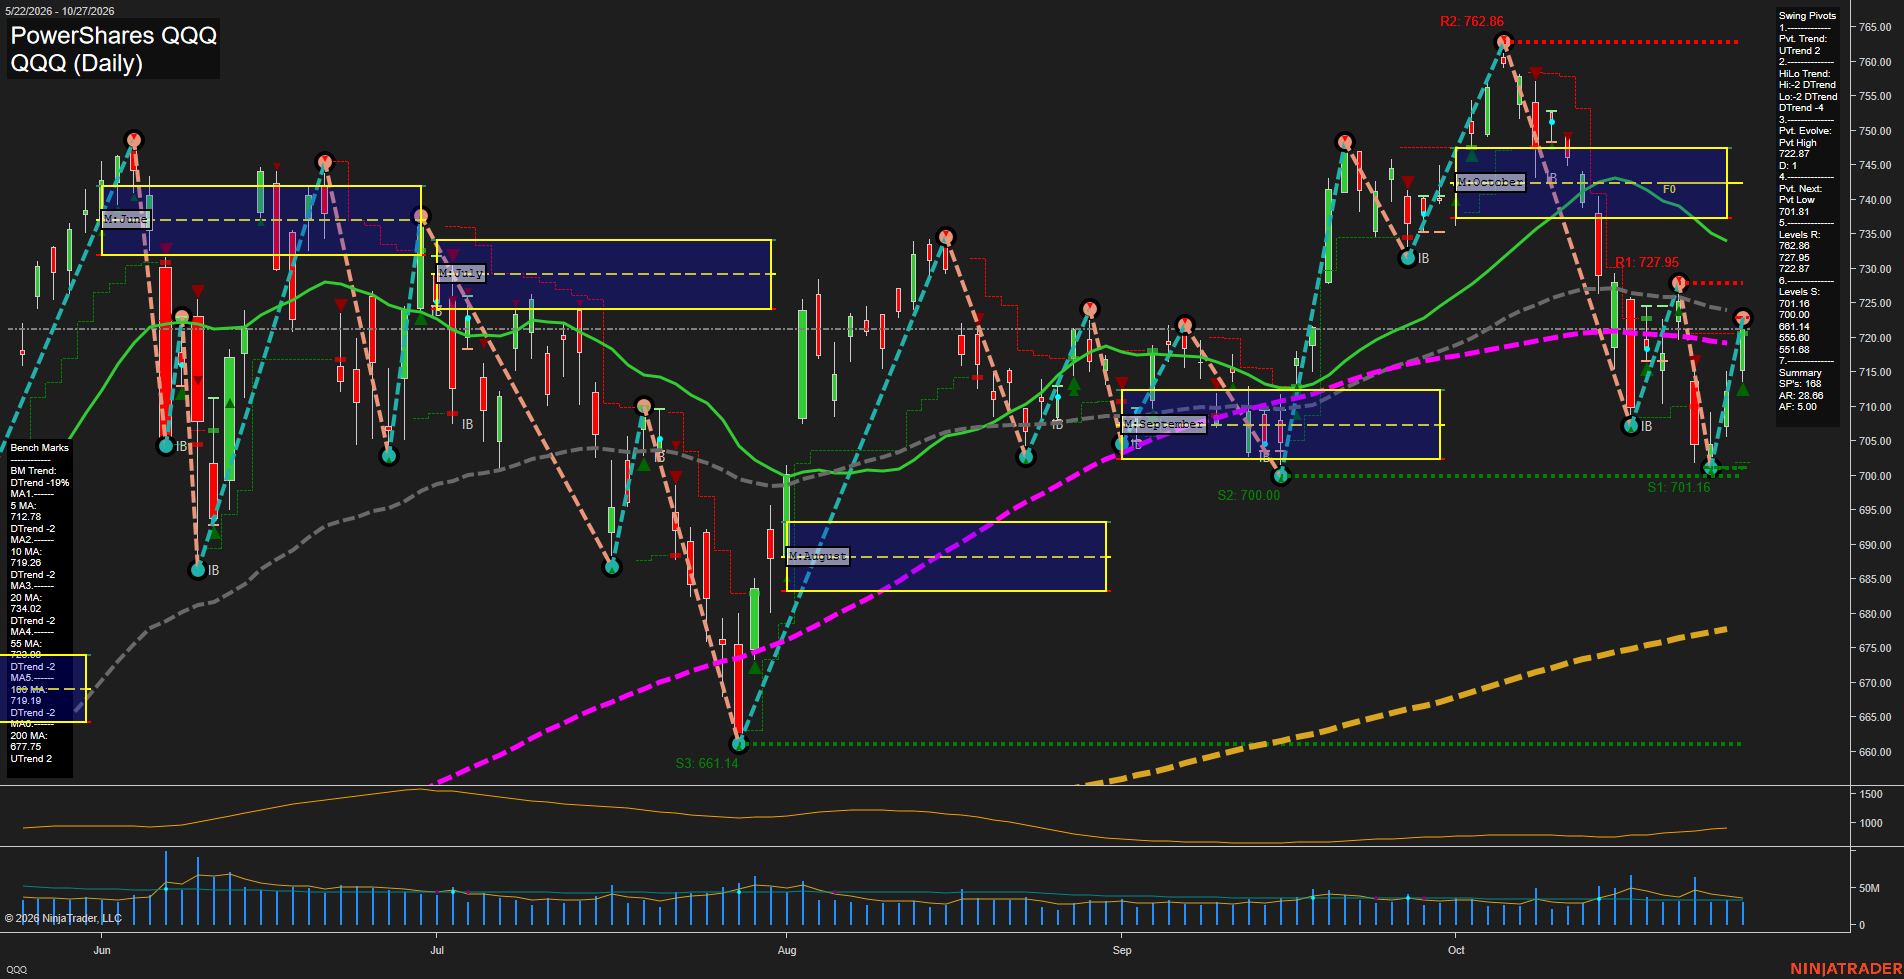
Overall Rating
- Short-Term: Neutral
- Intermediate-Term: Bearish
- Long-Term: Neutral.
Key Insights Summary
QQQ is showing a sharp rebound from the 700.00-701.16 support cluster, producing a short-term pivot uptrend and recovering above the declining 5-day average. From a futures swing perspective, the rebound remains countertrend within a weaker intermediate structure: price is below the October MSFG NTZ and beneath declining 20-day and 55-day benchmarks. The 722.87 pivot-high area and 727.95 resistance define the immediate overhead supply zone, while 701.16-700.00 remains the key downside reference. The longer-term 200-day average remains rising well below price, preserving the broader cyclical uptrend despite the current volatile consolidation and lower intermediate pivot structure.
View charts on: AlphaWebTrader HTF Charts
NQ Daily View
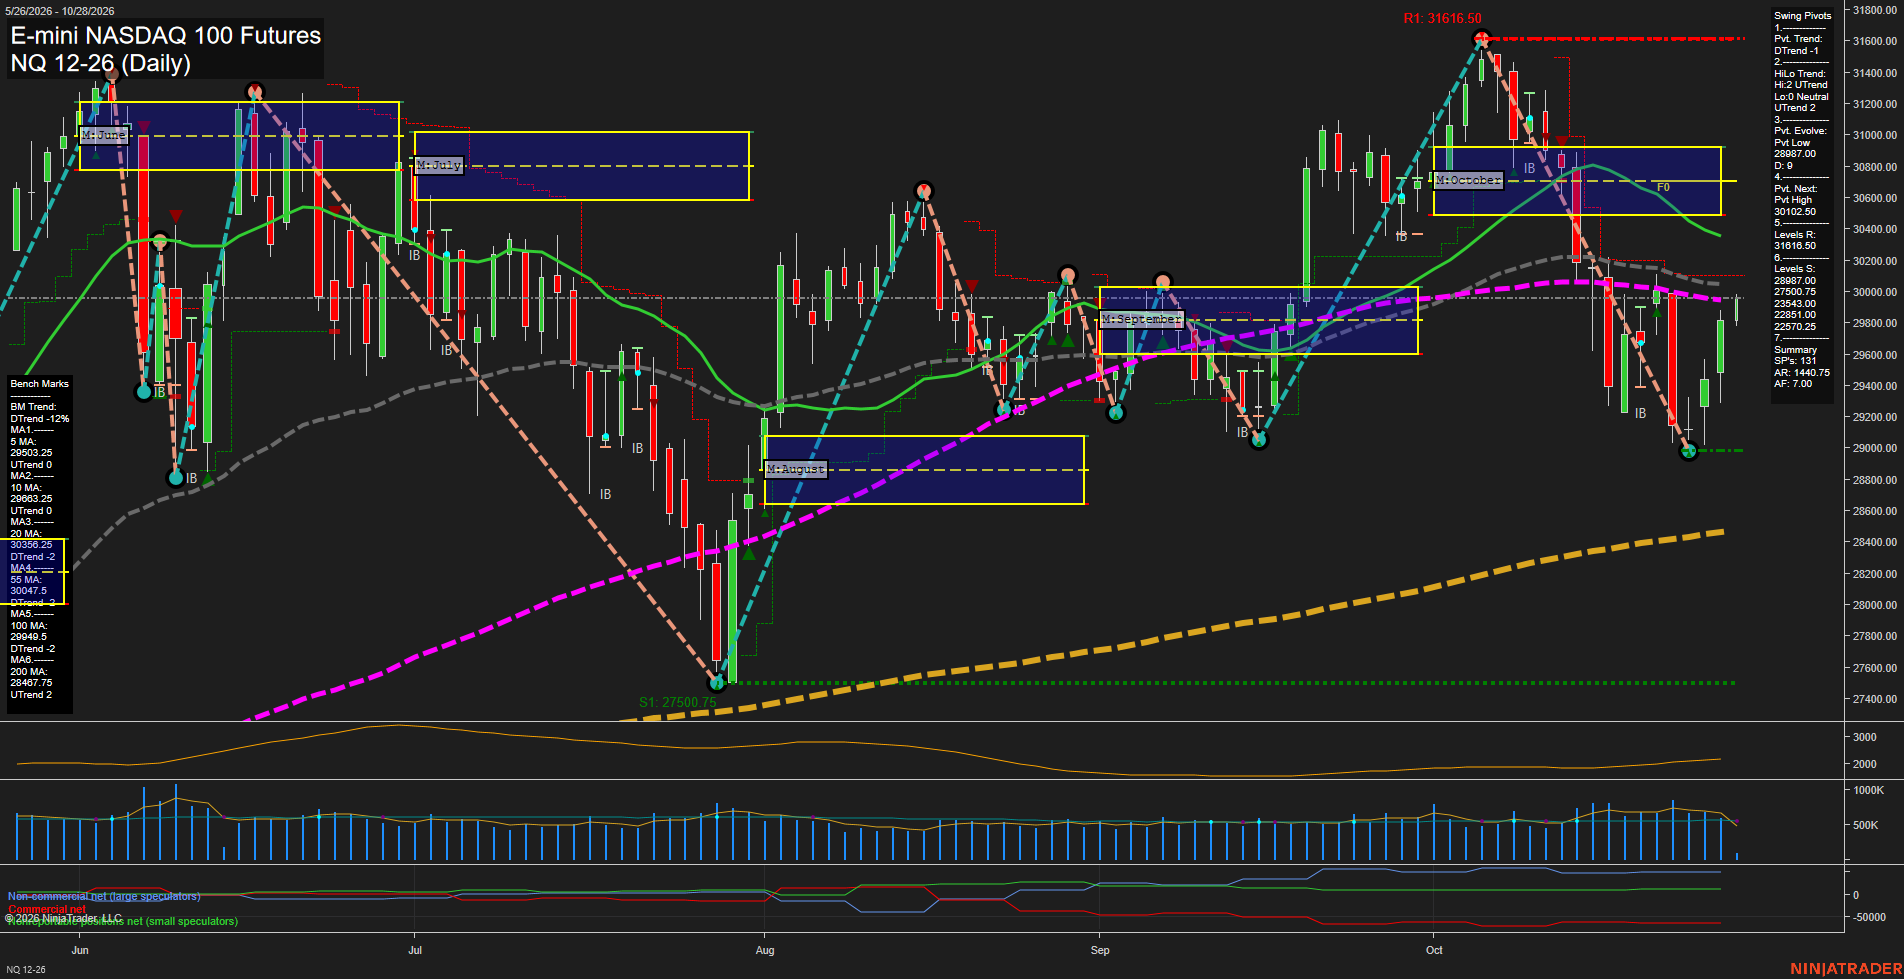
Overall Rating
- Short-Term: Bullish
- Intermediate-Term: Bearish
- Long-Term: Bullish.
Key Insights Summary
The daily structure reflects a sharp rebound from the 28987.00 pivot low, with price back above the rising 5-day and 10-day benchmarks and the weekly fib grid retaining an upward bias. The short-term pivot trend remains down until a new pivot high is confirmed above 30102.50, while the 20-day and 55-day averages remain declining and the October monthly grid remains below its F0% level. This leaves the intermediate structure as a countertrend recovery within a monthly downswing. The long-term backdrop remains constructive above the rising 200-day average and within the positive yearly grid, while elevated ATR and recent wide swings indicate an active, volatile daily range.
View charts on: AlphaWebTrader HTF Charts
USO Daily View
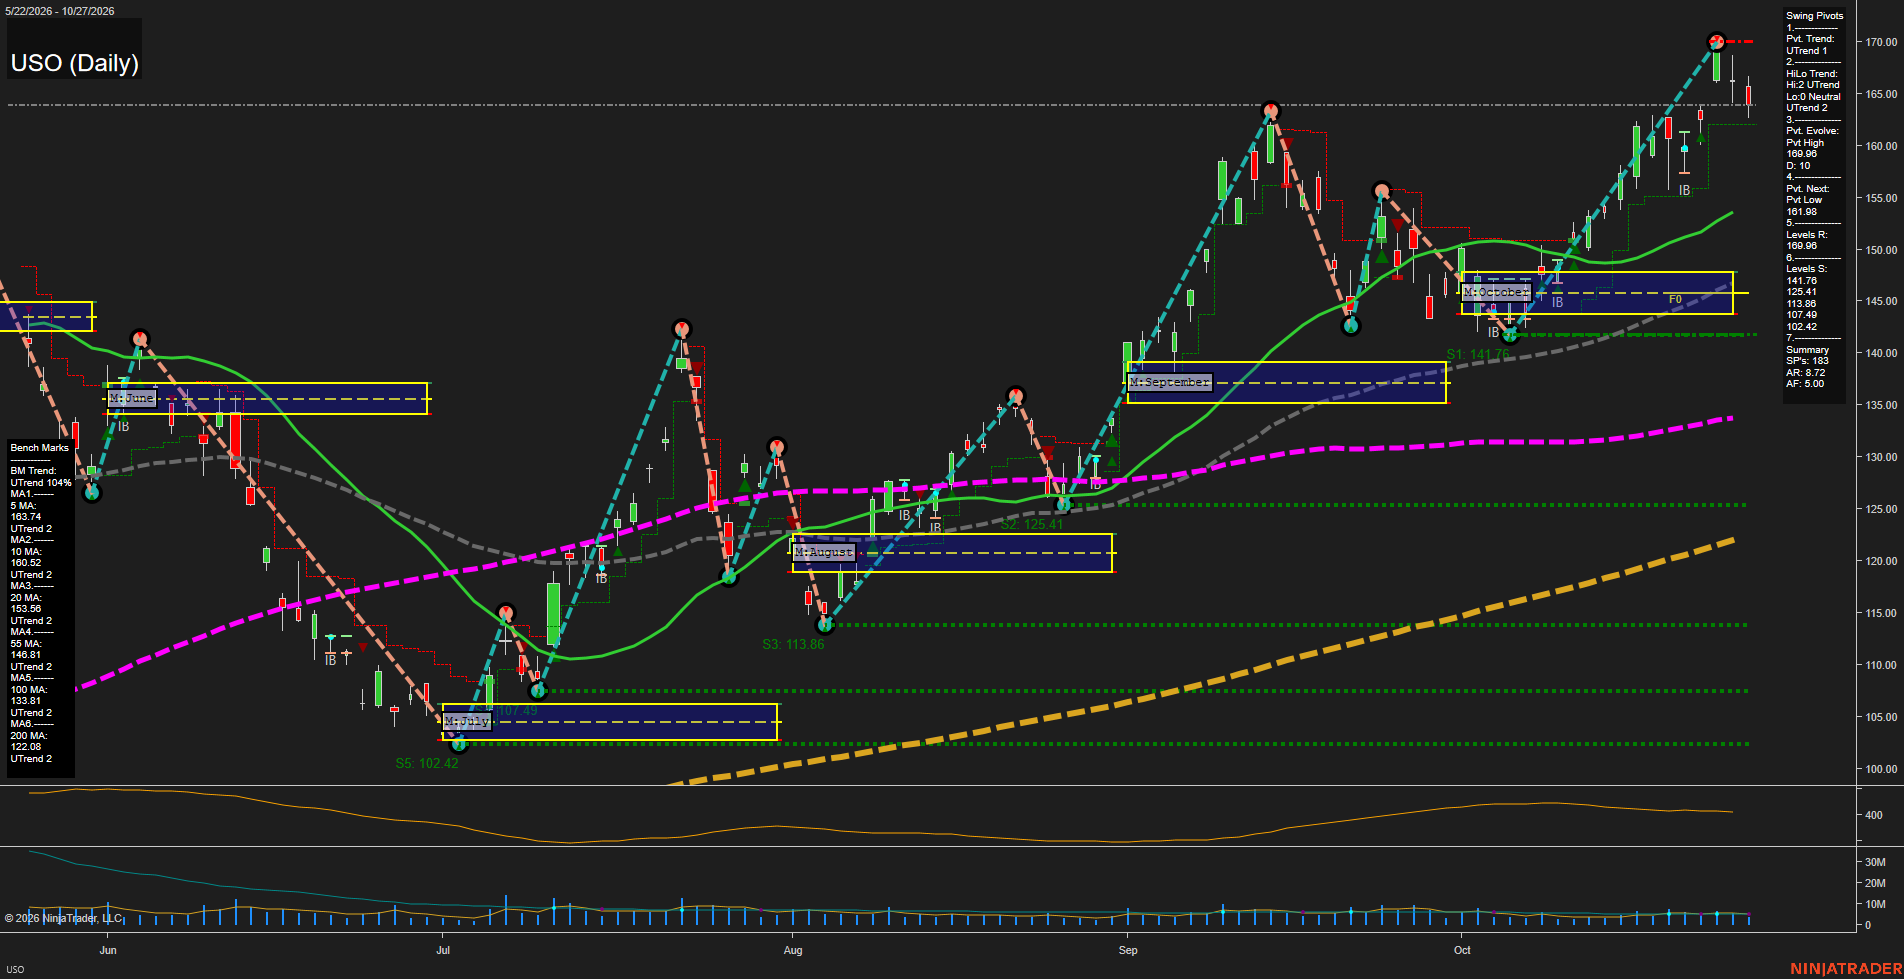
Overall Rating
- Short-Term: Bullish
- Intermediate-Term: Bullish
- Long-Term: Bullish.
Key Insights Summary
USO remains in a broad multi-timeframe advance, with price holding above every benchmark moving average and the moving-average stack positively aligned from 5 through 200 days. The recent push to the 169.98 pivot high established the primary upside reference, while the current pullback is contained above the 5-day and 10-day averages near 163.74 and 160.52. The short-term pivot structure remains an UTrend, with 161.98 defining the opposite-pivot reversal reference. October’s monthly fib grid is well below current price, reflecting a strong extension above its NTZ; 145.61 is the major nearby structural support zone. Medium-sized daily bars and a 5.00 ATR indicate active but orderly volatility following a strong directional rally rather than a broad breakdown.
View charts on: AlphaWebTrader HTF Charts
CL Daily View
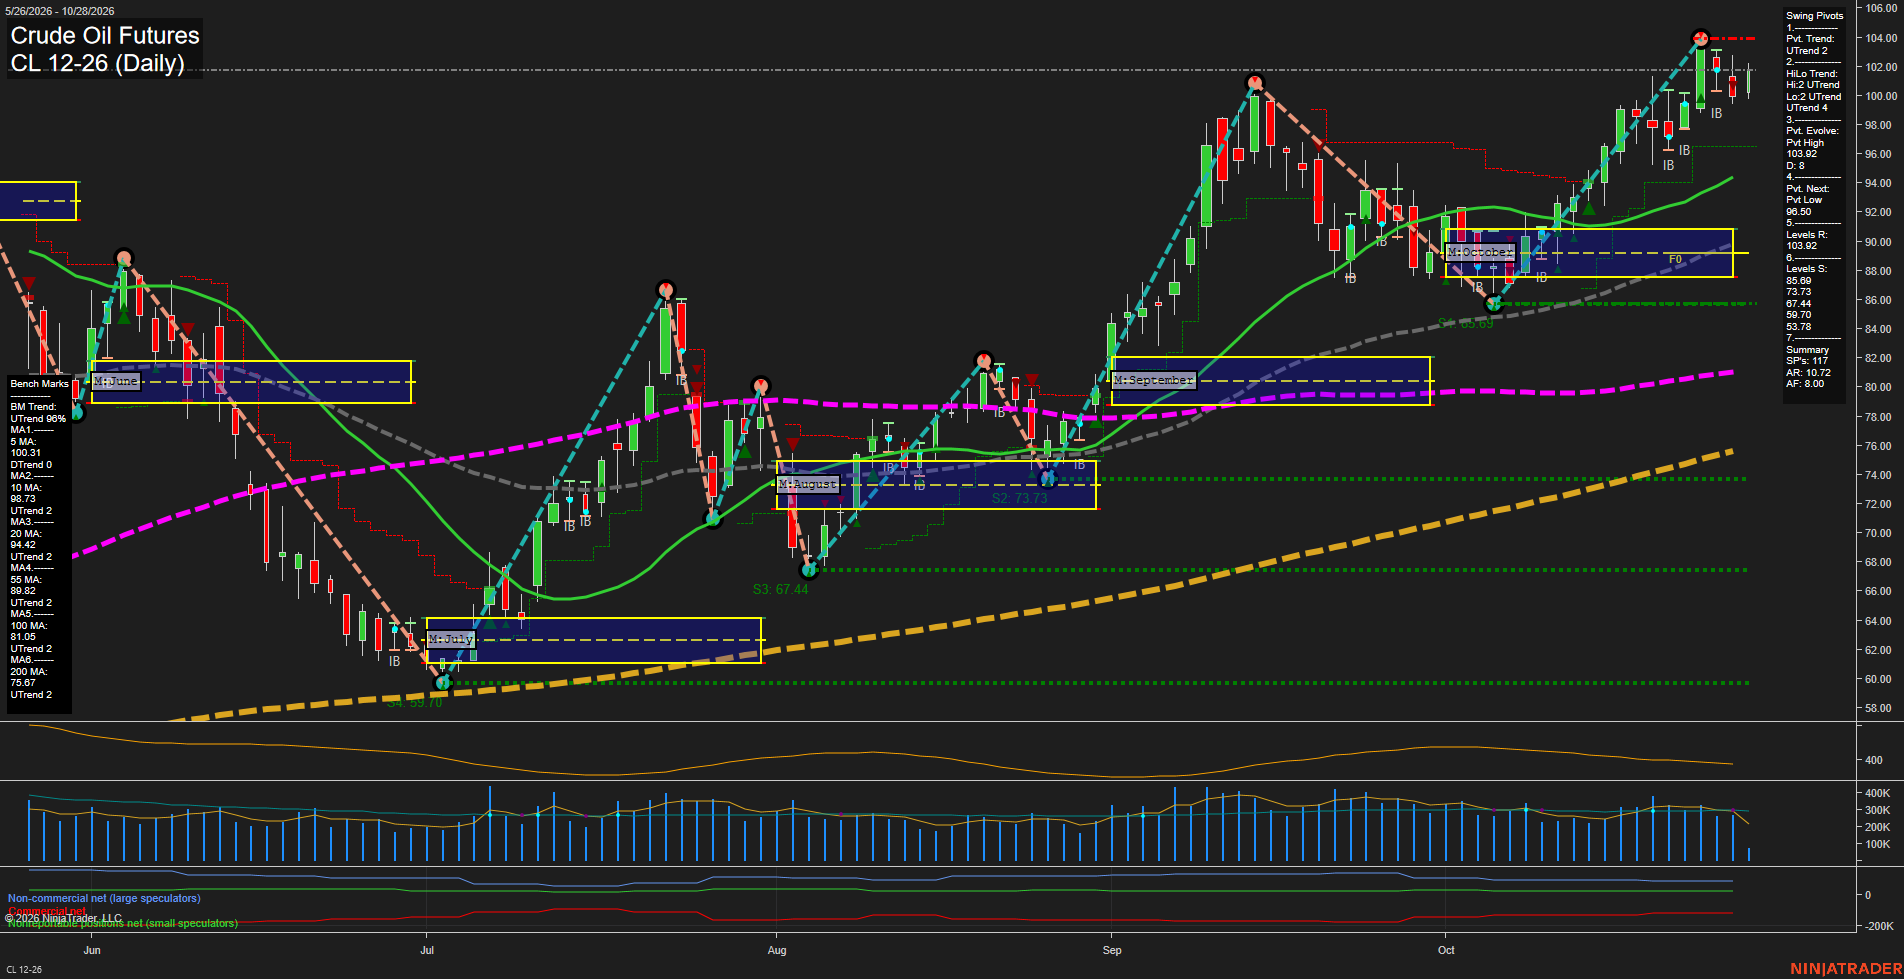
Overall Rating
- Short-Term: Bullish
- Intermediate-Term: Bullish
- Long-Term: Bullish.
Key Insights Summary
CL remains in a broad multi-timeframe advance, with price above every benchmark average and all benchmark trends pointed higher. The daily swing structure retains an UTrend and the intermediate HiLo structure confirms higher highs and higher lows. Price is consolidating beneath the 103.92 pivot-high resistance after a strong October recovery from the 86.00 area; the 96.50 next-pivot level defines the near-term pullback threshold. The recent short signals reflect countertrend pressure near the upper swing extreme, while the prevailing technical structure remains upward as long as price holds above the rising short- and intermediate-term averages.
View charts on: AlphaWebTrader HTF Charts
GLD Daily View
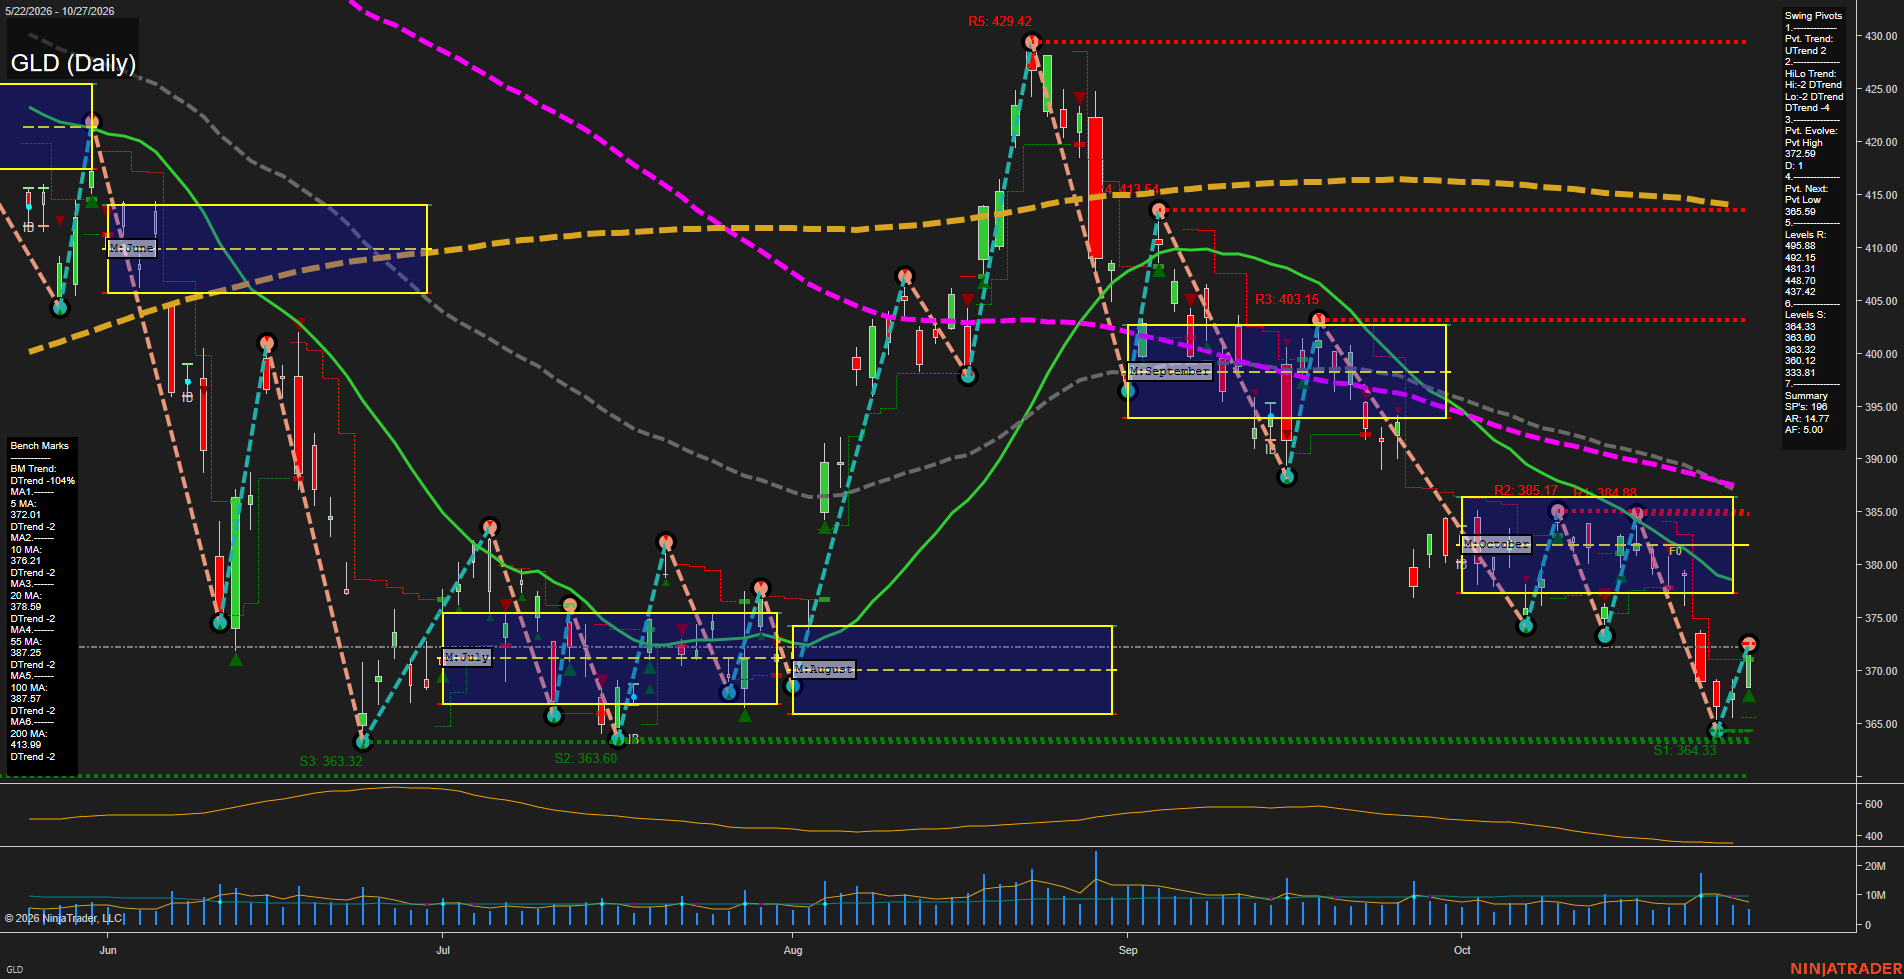
Overall Rating
- Short-Term: Bearish
- Intermediate-Term: Bearish
- Long-Term: Bearish.
Key Insights Summary
GLD remains in a broad futures-style swing downtrend, with price beneath every benchmark average and both pivot structures classified DTrend. The recent rebound from the 364.33 support cluster has been sharp, but it is currently testing the evolving 372.59 pivot-high area while remaining below the declining 5-day through 200-day averages. The October monthly grid is overhead, creating a lower-high and retracement character rather than a confirmed trend reversal. The dominant near-term range is defined by 372.59 to 376.21 overhead and 365.59 to 364.33 below; a sustained move through the upper range would improve recovery structure, while renewed weakness toward the support cluster would preserve the larger bearish swing cycle.
View charts on: AlphaWebTrader HTF Charts
GC Daily View
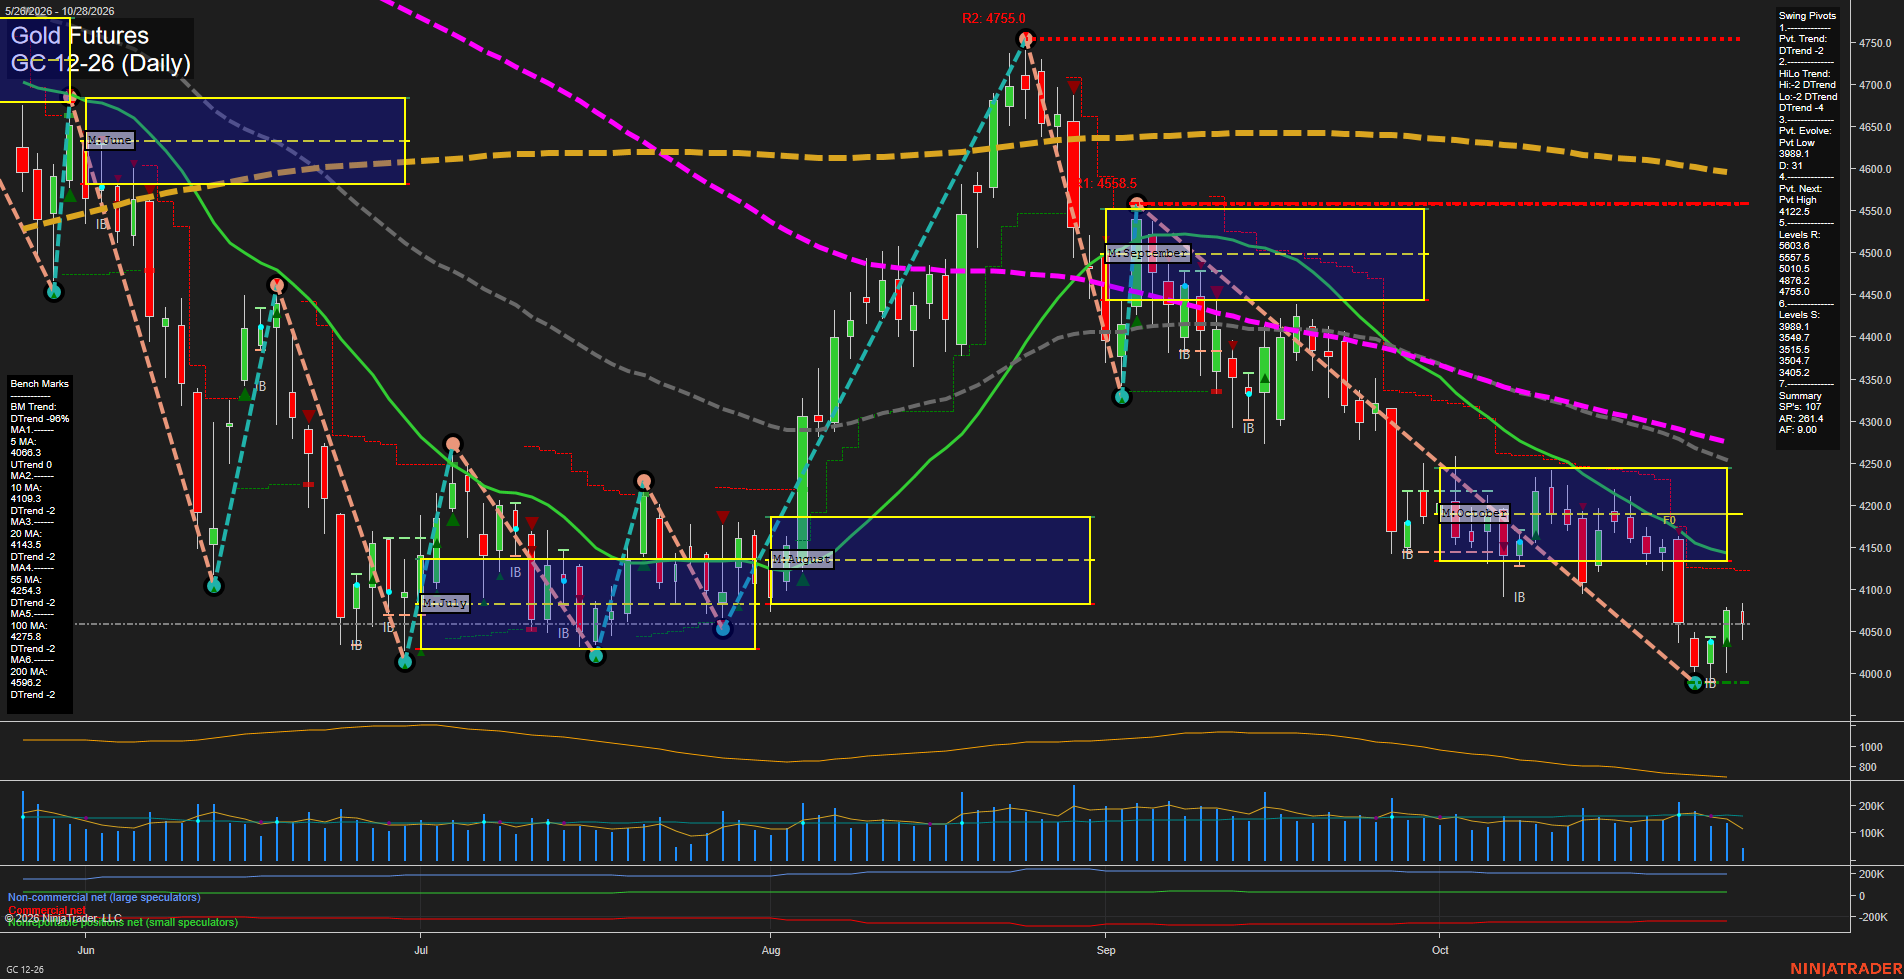
Overall Rating
- Short-Term: Neutral
- Intermediate-Term: Bearish
- Long-Term: Bearish.
Key Insights Summary
Gold is attempting a measured rebound from the 3993 pivot low, but the recovery remains below the 5, 10, 20, 55, 100, and 200-day benchmark cluster. The weekly fib structure is constructive above its F0% area, while the monthly and yearly grids remain decisively below F0%, framing the current bounce as counter-trend within broader intermediate- and long-term downtrends. The 4122.5 next-pivot threshold and the 4143.5 20-day average define the nearby overhead technical barrier, while 3989.1 remains the closest swing support. Medium-sized bars, slowing momentum, and elevated ATR conditions indicate a volatile consolidation following the October selloff rather than a confirmed broad trend reversal.
View charts on: AlphaWebTrader HTF Charts
ZB Daily View
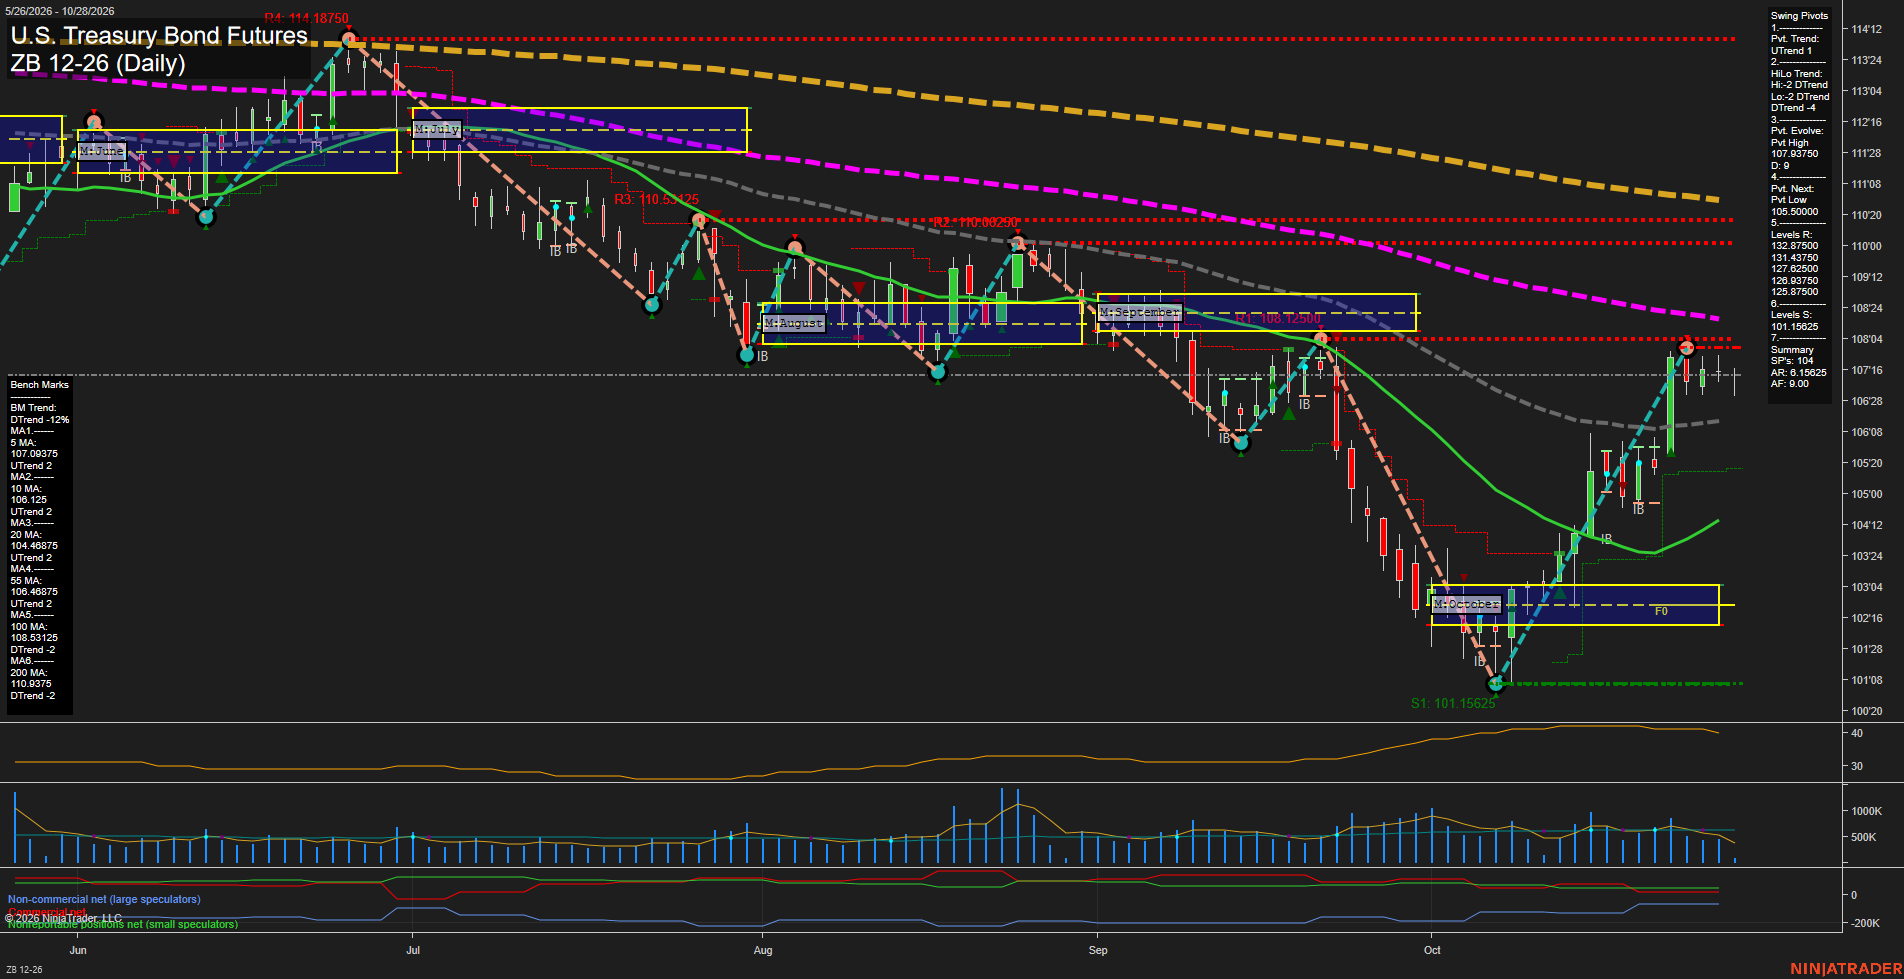
Overall Rating
- Short-Term: Bullish
- Intermediate-Term: Bullish
- Long-Term: Bearish.
Key Insights Summary
The October rebound has developed into a short-term pivot uptrend, with price holding above the weekly and monthly F0% areas and above the rising 5-, 10-, 20-, and 55-day benchmarks. The recovery has slowed beneath the 107.93750 developing pivot-high area, producing smaller daily ranges and consolidation after a sharp advance from the October low. Intermediate structure remains constructive through the rising moving-average cluster and positive monthly grid position, although the broader HiLo pivot trend remains down. Long-term structure is still bearish because price remains below declining 100- and 200-day benchmarks and well beneath major overhead pivot resistance. Recent short-term trend and grid signals reflect the rebound, while the long-term trend signal remains counter to the rally.
View charts on: AlphaWebTrader HTF Charts
Sentiment Summary: Coverage leaned positive—38% positive versus 20% negative, with 43% neutral—as AI and chip enthusiasm accompanied October 27’s second consecutive equity advance; the Nasdaq gained over 1%, while equal-weight S&P 500 performance lagged. Anthropic’s IPO filing and AI infrastructure partnerships supported sentiment, followed by SK Hynix’s record quarterly revenue on October 28. The main counterweights were AI financing and spending concerns, including Meta’s dilution and negative free cash flow, alongside rising Treasury yields ahead of today’s Fed decision at 2 p.m. ET and Alphabet and Microsoft earnings after the close.
Conclusion: Megacap-heavy leadership leaves index sentiment concentrated around policy and earnings catalysts.