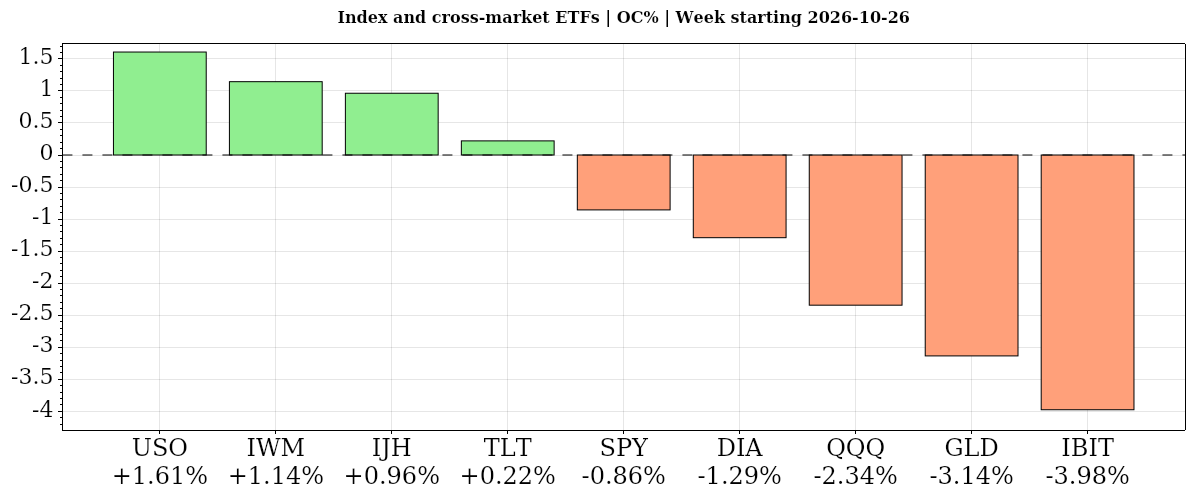
Markets finished the week divided as early equity gains gave way to technology-led selling. SPY fell 0.56% and QQQ lost 1.97%, while midcaps and small caps gained 1.33% and 1.30%, respectively. Scrutiny of AI earnings and investment costs, persistent inflation and the prospect of further Federal Reserve tightening shaped the week. Long-dated Treasuries gained 0.61%, while gold fell 2.95% and oil ended 0.41% lower despite a late-week rebound.
Fundamentals: Stocks ended the week under pressure from technology selling as AI spending and financing drew scrutiny. Alphabet missed earnings expectations; ExxonMobil and Chevron reported billions in profits. The Fed held rates at 3.75%–4.00%, while GDP grew 3.4% and durable goods orders rose 1.8%. Early hopes for Middle East diplomacy gave way to renewed Iran tensions and rising oil prices. Gold fell sharply Friday, while long-dated Treasuries closed above Thursday’s levels.
Technicals: S&P 500 and Nasdaq 100 ETFs posted bearish weekly returns of -0.56% and -1.97%. Alphabet fell 12.61%, while bullish Tesla gained 7.41%. Bullish mid-cap and small-cap ETFs rose 1.33% and 1.30%, outperforming large caps. Oil and gold ETFs were bearish, falling 0.41% and 2.95%, while the bullish far-term Treasury bond ETF gained 0.61%. The bitcoin ETF was bearish, losing 5.66% over the completed week.
Weekly Market Recap: weekly ETF and stock performance, daily session commentary, economic releases, earnings and market news, with a whole-week summary.
As of: October 31, 2026 11:30 CT
Earnings Radar Week Recap
Monitoring for earnings releases by the Magnificent 7, AI-tech-related firms, and major financial institutions.
| Date/Day | Impact | Company / Symbol | Time | EPS | Revenue | ||||||||
|---|---|---|---|---|---|---|---|---|---|---|---|---|---|
| 2026-10-28 – Wednesday | High | Alphabet (GOOGL) | After close |
|
| ||||||||
| 2026-10-28 – Wednesday | High | Microsoft (MSFT) | After close |
|
| ||||||||
| 2026-10-28 – Wednesday | Medium | Vertiv (VRT) | Before open |
|
| ||||||||
| 2026-10-29 – Thursday | High | Amazon (AMZN) | After close |
|
| ||||||||
| 2026-10-29 – Thursday | Medium | Intel (INTC) | After close |
|
|
For full details visit: Yahoo Earnings Calendar
EcoNews Radar U.S. Events Week Recap
| Date | Impact | Event, Prev, Forecast, Actual | Info |
|---|---|---|---|
| 2026-10-27 Tuesday 10:00 | Medium | CB Consumer Confidence Prev: 81.9 Forecast: 81.2 Actual: 91.7 | Surveys households’ views of current conditions and future prospects; traders monitor it for signals about consumption, economic momentum and corporate revenue prospects. |
| 2026-10-28 Wednesday 10:30 | Low | EIA Crude Oil Stocks Change Prev: -3.06M Forecast: -0.30M Actual: -1.89M | Tracks weekly changes in commercial crude inventories; traders monitor the supply-demand balance for implications for oil prices, energy shares and inflation pressures. |
| 2026-10-28 Wednesday 14:00 | High | Fed Interest Rate Decision Prev: 4.00% Forecast: 4.00% Actual: 4.00% | Sets the central bank’s policy rate; traders monitor its implications for borrowing costs, Treasury yields and equity valuations. |
| 2026-10-28 Wednesday 14:30 | High | FOMC Press Conference Prev: — Forecast: — Actual: — | Explains policymakers’ assessment and policy rationale; traders monitor guidance on inflation, employment and the potential rate path for implications for yields and equity valuations. |
| 2026-10-29 Thursday 08:30 | High | Advance GDP q/q Prev: 1.5% Forecast: 3.2% Actual: 3.4% | Provides the first estimate of quarterly economic output growth; traders monitor it to assess economic momentum, earnings prospects and monetary-policy expectations. |
| 2026-10-29 Thursday 08:30 | High | Core Personal Consumption Expenditures – Price Index (MoM) Prev: 0.2 Forecast: 0.3 Actual: 0.3 | Measures monthly consumer-price changes excluding food and energy; traders monitor underlying inflation momentum for implications for monetary policy, bond yields and equity valuations. |
| 2026-10-29 Thursday 08:30 | High | Gross Domestic Product Price Index Prev: 6.1 Forecast: 3.5 Actual: 2.2 | Measures price changes across domestically produced final goods and services; traders monitor this broad inflation gauge to distinguish nominal growth from real activity and assess policy pressures. |
| 2026-10-29 Thursday 08:30 | Medium | Initial Jobless Claims Prev: 194K Forecast: 199K Actual: 194K | Counts new applications for unemployment benefits; traders monitor this timely labor-market indicator for signs of changing layoffs, economic momentum and monetary-policy expectations. |
| 2026-10-29 Thursday 08:30 | Medium | Personal Income (MoM) Prev: 0.2 Forecast: 0.3 Actual: 0.2 | Tracks monthly changes in household income from wages and other sources; traders monitor purchasing power and the potential support for consumption and corporate revenues. |
| 2026-10-29 Thursday 08:30 | Medium | Personal Spending Prev: 0.9 Forecast: 0.6 Actual: 0.5 | Tracks household outlays on goods and services; traders monitor consumer demand for implications for economic growth, corporate revenues and inflation pressures. |
| 2026-10-29 Thursday 08:30 | High | Core Personal Consumption Expenditures – Price Index (YoY) Prev: 3 Forecast: 3.1 Actual: 3.1 | Measures annual consumer-price changes excluding food and energy; traders monitor persistent underlying inflation relative to the central bank’s objective and its implications for interest rates. |
| 2026-10-29 Thursday 08:30 | Medium | Core Personal Consumption Expenditures (QoQ) Prev: 3.3 Forecast: 2.4 Actual: 2.5 | Tracks quarterly changes in consumer prices excluding food and energy; traders monitor underlying inflation over the quarter to assess policy pressures and the interest-rate outlook. |
| 2026-10-29 Thursday 08:30 | High | Gross Domestic Product Annualized Prev: 2.2 Forecast: 3.2 Actual: 3.4 | Expresses quarterly real output growth at an annualized pace; traders monitor the economy’s momentum for implications for corporate earnings, interest rates and equity valuations. |
| 2026-10-29 Thursday 08:30 | Medium | Personal Consumption Expenditures – Price Index (MoM) Prev: 0.3 Forecast: 0.5 Actual: 0.5 | Measures monthly changes in prices paid for consumer goods and services, including food and energy; traders monitor near-term inflation momentum and monetary-policy implications. |
| 2026-10-29 Thursday 08:30 | Medium | Personal Consumption Expenditures – Price Index (YoY) Prev: 3.4 Forecast: 3.6 Actual: 3.6 | Measures annual changes in overall consumer prices; traders monitor progress toward the central bank’s inflation objective and implications for purchasing power, interest rates and equity valuations. |
| 2026-10-29 Thursday 08:30 | Medium | Personal Consumption Expenditures Prices (QoQ) Prev: 5 Forecast: 3.4 Actual: 2.1 | Tracks quarterly changes in prices of consumer goods and services; traders monitor broad consumption inflation to assess price pressures and the monetary-policy outlook. |
| 2026-10-29 Thursday 11:30 | Medium | 4-Week Bill Auction · $115B Prev: 3.945% Forecast: — Actual: 3.91% | Reveals the yield and demand for very short-term Treasury financing; traders monitor money-market conditions and near-term funding costs that inform the broader rate backdrop. |
| 2026-10-29 Thursday 11:30 | Medium | 8-Week Bill Auction · $110B Prev: — Forecast: — Actual: — | Reveals pricing and investor demand for short-term Treasury debt; traders monitor liquidity conditions and front-end yields for context on funding markets and interest-rate expectations. |
| 2026-10-29 Thursday 13:00 | High | 7-Year Note Auction · $44B Prev: 5.085% Forecast: — Actual: 4.894% | Reveals investor demand and the clearing yield for intermediate-term Treasury debt; traders monitor auction strength for implications for benchmark yields and equity discount rates. |
| 2026-10-30 Friday 08:30 | Medium | Employment Cost Index Prev: 0.9 Forecast: 0.8 Actual: 0.8 | Measures changes in employers’ wage and benefit costs while controlling for workforce composition; traders monitor persistent labor-cost pressures for implications for inflation, profit margins and monetary policy. |
| 2026-10-30 Friday 09:30 | Medium | Fed's Barkin speech Prev: — Forecast: — Actual: — | Offers a policymaker’s assessment of economic conditions and monetary policy; traders monitor remarks for signals about the rate outlook and the balance of inflation and employment risks. |
| 2026-10-30 Friday 09:45 | Medium | Chicago PMI Prev: 58.8 Forecast: 56.1 Actual: 55.3 | Surveys Chicago-area business activity, including orders and employment; traders monitor it as a regional signal of economic momentum and business demand. |
| 2026-10-30 Friday 12:00 | Medium | Fed's Daly speech Prev: — Forecast: — Actual: — | Provides a policymaker’s views on the economy and policy; traders monitor any guidance on inflation, labor conditions and interest rates that could inform broader policy expectations. |
| 2026-10-30 Friday 12:30 | Medium | Fed's Musalem speech Prev: — Forecast: — Actual: — | Communicates a policymaker’s economic assessment and policy views; traders monitor comments for insight into the potential rate path and the risks shaping monetary-policy decisions. |
| 2026-10-30 Friday 13:30 | Medium | Fed's Logan speech Prev: — Forecast: — Actual: — | Offers commentary on economic conditions and monetary policy; traders monitor any discussion of rates, liquidity or financial conditions for implications for the policy outlook. |
Summary: The calendar centers on U.S. monetary policy and the growth-inflation balance, alongside household, labor-market and Treasury financing indicators.
Conclusion: Thursday contains the densest cluster of releases, with multiple macroeconomic reports published simultaneously.
Market Technical Analysis
Analysis of completed-week VIX volatility, major ETFs and mega-cap tech stocks, futures snapshots, higher-time-frame analysis and weekly charts.
VIX — Market Fear Gauge Weekly
| Level | Open | High | MaxVix | Low | MinVix | WNC% | WOC% | VR | MaxVR | MinVR |
|---|---|---|---|---|---|---|---|---|---|---|
| 19.47 | 19.66 | 23.93 | 22.31 | 16.21 | 13.80 | +2.42% | -0.97% | 4.33 | 17.64 | -19.11 |
VIX rose 2.42% versus the previous weekly close. Open-to-close change: -0.97%. VIX is 66.6% up the recent 12-week range (13.80–22.31), in the 60–70% band.
VR: Weekly VR: Stocks fell while expected volatility rose. VR is in the upper part of its preceding 12-week VR range (-19.11 to 17.64), in the 60–70% band. VR rose 15.73 points from the previous week, a large shift relative to that range.
Range lookback: preceding 12 completed weeks.
Major ETFs and Mega Cap Tech Stocks Weekly
ETF, Mag7, and Cross-Market ETF Weekly Insights
Overall Tone
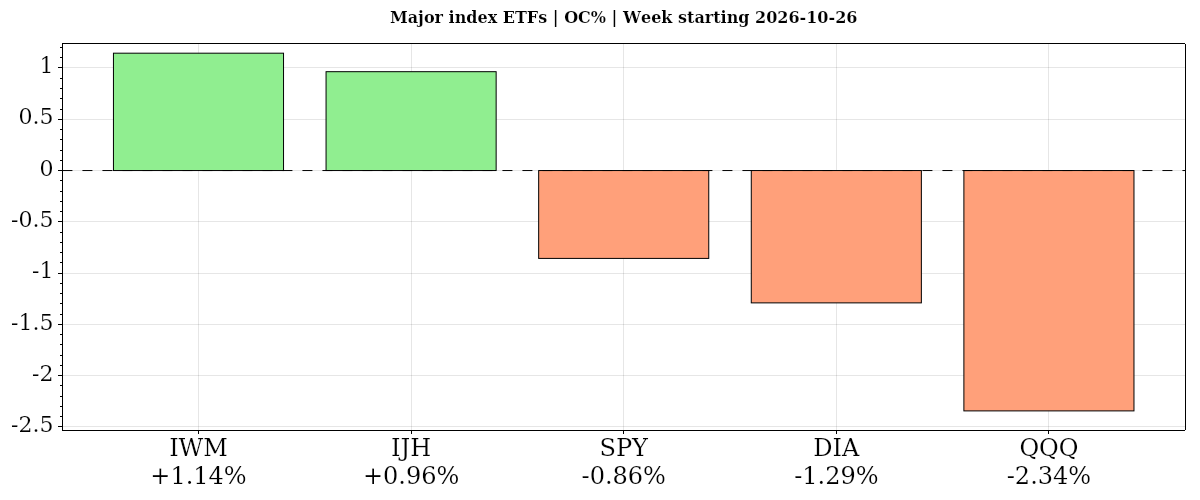
For the completed week beginning 2026-10-26, declines from the week open predominated, indicating cautious risk tone despite pockets of strength.
| Instrument | Bias | Date | WNC% | WOC% | O | H | L | C | VWAP | Vol | Mon | Tue | Wed | Thu | Fri |
|---|---|---|---|---|---|---|---|---|---|---|---|---|---|---|---|
| ▲ IJH | ▲ ▲ ▲ | 2026-10-26 | ▲ +1.33% | ▲ +0.96% | 72.63 | 74.31 | 72.60 | 73.33 | ▲ 73.30 | 31,373,543 | +0.75% | +0.43% | +0.18% | +1.16% | -1.17% |
| ▲ IWM | ▲ ▲ ▼ | 2026-10-26 | ▲ +1.30% | ▲ +1.14% | 276.17 | 285.26 | 276.00 | 279.33 | ▼ 280.22 | 98,334,167 | +0.45% | +1.15% | +0.40% | +0.97% | -1.65% |
| ▼ SPY | ▼ ▼ ▼ | 2026-10-26 | ▼ -0.56% | ▼ -0.86% | 762.25 | 773.36 | 750.36 | 755.72 | ▼ 763.85 | 207,870,067 | +0.71% | +0.56% | +0.34% | -0.38% | -1.77% |
| ▼ DIA | ▼ ▼ ▼ | 2026-10-26 | ▼ -0.81% | ▼ -1.29% | 523.89 | 525.77 | 515.01 | 517.13 | ▼ 521.81 | 15,348,296 | +0.31% | +0.06% | +0.27% | -0.37% | -1.07% |
| ▼ QQQ | ▼ ▼ ▼ | 2026-10-26 | ▼ -1.97% | ▼ -2.34% | 707.06 | 726.14 | 683.45 | 690.49 | ▼ 706.85 | 217,828,240 | +1.11% | +1.27% | +0.60% | -1.42% | -3.47% |
| AVG/Sum | — | — | -0.14% | -0.48% | — | — | — | — | — | 570,754,313 | +0.66% | +0.69% | +0.36% | -0.01% | -1.83% |
IJH · W:2026-10-26 NC% ▲ +1.33% OC% ▲ +0.96%
IJH – Mid Cap Technicals Summary
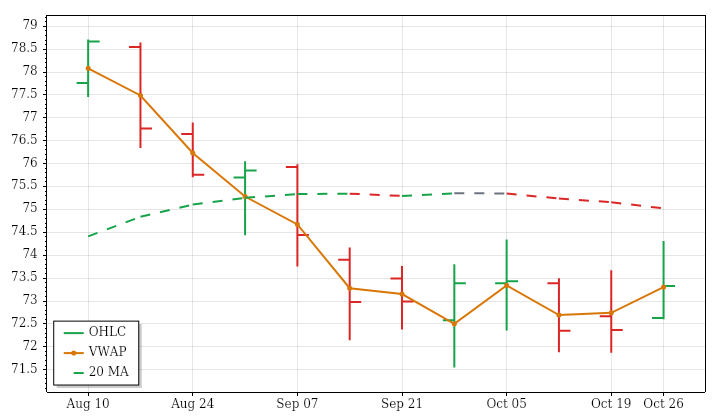
IJH’s completed week beginning October 26, 2026 closed at 73.33, advancing 1.33% from the prior weekly close and 0.96% from the open. The opening gap up remained unfilled, and a higher high and higher low improved the weekly structure. Nevertheless, the close stayed inside the previous week’s range and only marginally above VWAP, distinguishing the advance from a decisive close beyond that prior range.
Price finished almost exactly at the falling near-term benchmark and just above the rising intermediate benchmark, leaving shorter-horizon alignment delicate. The far-term structure remained downward, as did the broader 12-week price trend. Range was below average, consistent with contraction, while below-average volume diverged from the lookback increase in activity. PSAR was in a long state but ATR-median remained negative. A next-week low below 71.55 would conditionally trigger a PSAR short reversal.
IWM · W:2026-10-26 NC% ▲ +1.30% OC% ▲ +1.14%
IWM – Small Cap Technicals Summary
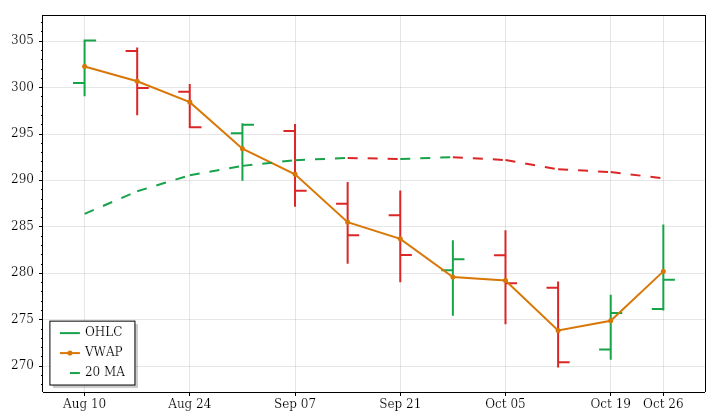
IWM’s completed week beginning October 26, 2026 closed at 279.33, up 1.30% from the prior weekly close and 1.14% from the open. Its opening gap up remained unfilled. A higher high and higher low culminated in a close above the previous week’s high, but the finish remained below weekly VWAP. That contrast shows an improved weekly price structure without uniformly positive positioning across the supplied measures.
The advance ran against the near-term downtrend, while price remained below a rising intermediate benchmark. The far-term structure continued upward. Weekly range was above average, consistent with the 12-week expansion trend, but volume was below average despite increasing lookback activity. PSAR entered a long state while ATR-median remained negative, preserving indicator conflict rather than confirming broad alignment. A next-week low below 269.875 would conditionally trigger a PSAR short reversal.
SPY · W:2026-10-26 NC% ▼ -0.56% OC% ▼ -0.86%
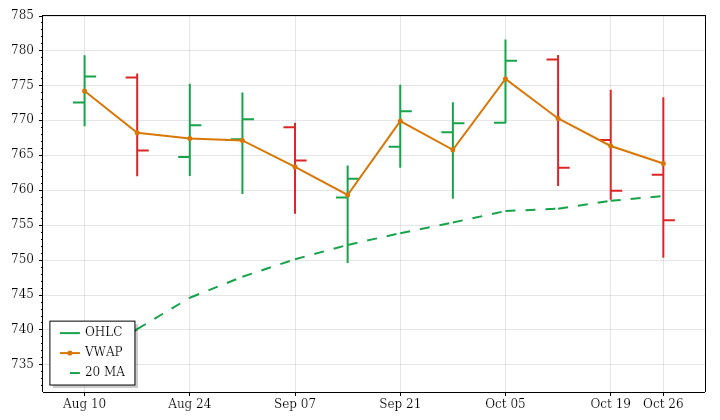
SPY – S&P 500 Technicals Summary
SPY’s completed week beginning October 26, 2026 closed at 755.72, down 0.56% from the prior weekly close and 0.86% from the open. The opening gap up was filled. A lower high and lower low culminated in a close below the previous week’s low and beneath VWAP, so the modest net loss accompanied a weaker weekly structure rather than an unchanged trading pattern.
Near-term positioning was mixed, with price below a still-rising average, while intermediate- and far-term structures remained upward. The broader 12-week price trend was slightly negative and marked by substantial back-and-forth movement. The latest range was roughly half again its average, interrupting contraction and marking a third consecutive large-range week; volume was only slightly above average. PSAR was short while ATR-median remained positive. A next-week high above 781.62 would conditionally trigger a PSAR long reversal.
S&P 500 News and Fundamentals
The S&P 500 fell approximately 0.57% in the week ended Oct. 30, recording its third consecutive weekly loss amid a technology selloff. FactSet’s blended third-quarter earnings growth rate for the index stood at 29.5% as of Oct. 23. The Federal Reserve held its benchmark interest-rate range at 3.75–4% on Oct. 28, with inflation data and major technology earnings also in focus for the index.
DIA · W:2026-10-26 NC% ▼ -0.81% OC% ▼ -1.29%
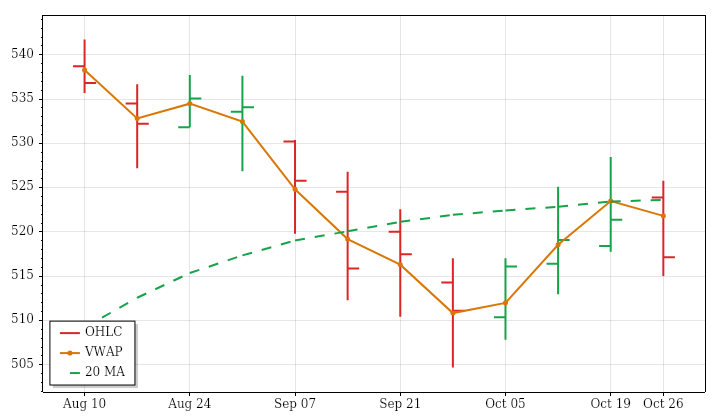
DIA – Dow Jones Technicals Summary
DIA’s completed week beginning October 26, 2026 closed at 517.13, down 0.81% from the prior weekly close and 1.29% from the open. The opening gap up was filled, and the week formed a lower high and lower low. Finishing below the previous week’s low, near the weekly low and beneath VWAP gave the decline a weaker ending than the modest headline return alone suggests.
The latest action aligned with the near-term downtrend but conflicted with rising intermediate- and far-term structures. The 12-week price decline had very low directional efficiency, indicating considerable back-and-forth movement rather than a consistently one-way fall. Weekly range was roughly typical and volume slightly below average, unlike the lookback tendency toward expanding ranges. Indicators also disagreed: ATR-median remained negative while PSAR was positive. A next-week low below 505.8875 would conditionally trigger a PSAR short reversal.
QQQ · W:2026-10-26 NC% ▼ -1.97% OC% ▼ -2.34%
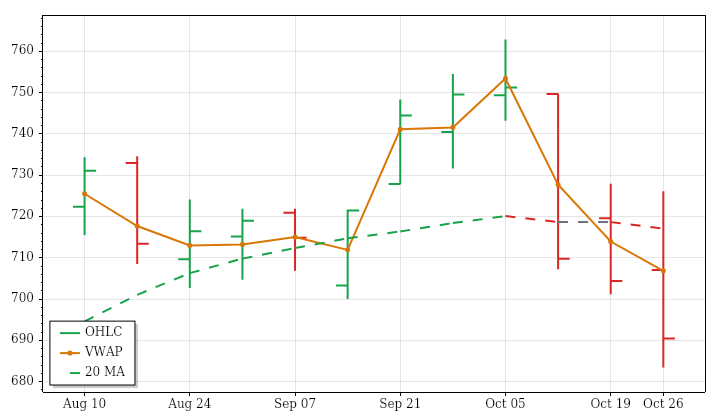
QQQ – Nasdaq 100 Technicals Summary
QQQ’s completed week beginning October 26, 2026 closed at 690.49, down 1.97% from the prior weekly close and 2.34% from the open. Its opening gap up was filled, followed by a lower high and lower low and a close beneath the previous week’s low. Finishing below VWAP and in the first lower volatility-band zone reinforced the latest period’s weakness.
Price stood below a rising near-term benchmark and just below the rising intermediate benchmark, while the far-term structure remained upward. The broader 12-week price trend was barely positive and inefficient, contrasting with the more clearly negative latest week. Range was about 73% above average and volume also elevated, consistent with lookback expansion and increasing activity. PSAR remained negative while ATR-median stayed positive. A next-week high above 752.1425 would conditionally trigger a PSAR long reversal.
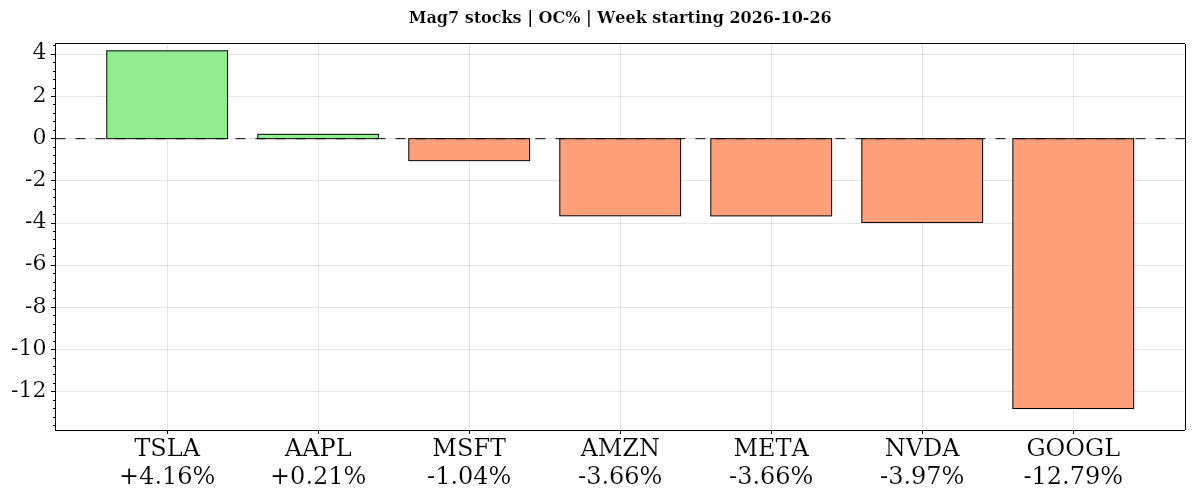
| Instrument | Bias | Date | WNC% | WOC% | O | H | L | C | VWAP | Vol | Mon | Tue | Wed | Thu | Fri |
|---|---|---|---|---|---|---|---|---|---|---|---|---|---|---|---|
| ▲ TSLA | ▲ ▲ ▲ | 2026-10-26 | ▲ +7.41% | ▲ +4.16% | 383.82 | 410.85 | 383.73 | 399.81 | ▲ 399.66 | 199,656,839 | +5.21% | +4.04% | -0.80% | -0.23% | -0.87% |
| ▼ MSFT | ▼ ▼ ▼ | 2026-10-26 | ▼ -0.50% | ▼ -1.04% | 527.40 | 541.29 | 514.35 | 521.91 | ▼ 527.68 | 141,531,799 | +1.54% | -0.24% | -0.06% | -0.16% | -1.55% |
| ▼ AAPL | ▼ ▲ ▼ | 2026-10-26 | ▼ -0.89% | ▲ +0.21% | 343.92 | 351.43 | 334.35 | 344.63 | ▼ 345.92 | 229,277,102 | -1.10% | +0.93% | -0.94% | +1.48% | -1.23% |
| ▼ NVDA | ▼ ▼ ▼ | 2026-10-26 | ▼ -3.00% | ▼ -3.97% | 213.10 | 219.99 | 200.92 | 204.64 | ▼ 212.32 | 515,336,743 | +2.39% | +0.90% | -1.17% | -0.80% | -4.22% |
| ▼ AMZN | ▼ ▼ ▼ | 2026-10-26 | ▼ -3.08% | ▼ -3.66% | 249.47 | 255.36 | 229.36 | 240.35 | ▼ 245.13 | 291,134,762 | +0.44% | +1.61% | +0.59% | -4.25% | -1.41% |
| ▼ META | ▼ ▼ ▼ | 2026-10-26 | ▼ -4.30% | ▼ -3.66% | 638.36 | 647.69 | 609.00 | 614.99 | ▼ 623.06 | 173,921,814 | -1.88% | -1.64% | -1.24% | +1.96% | -1.53% |
| ▼ GOOGL | ▼ ▼ ▼ | 2026-10-26 | ▼ -12.61% | ▼ -12.79% | 320.89 | 326.40 | 276.92 | 279.84 | ▼ 297.10 | 321,134,485 | -1.06% | +1.19% | +1.34% | -12.64% | -1.40% |
| AVG/Sum | — | — | -2.42% | -2.96% | — | — | — | — | — | 1,871,993,544 | +0.79% | +0.97% | -0.33% | -2.09% | -1.74% |
Mag7 Stocks
Negative confluence: average WOC% -2.96% from the week open and WNC% -2.42% versus the prior weekly close. TSLA led both comparisons and GOOGL lagged sharply; AAPL’s near-flat gain from the open contrasted with its prior-close decline, while the other four fell on both measures. AAPL and MSFT retained rising moving-average structures across horizons.
TSLA · W:2026-10-26 NC% ▲ +7.41% OC% ▲ +4.16%
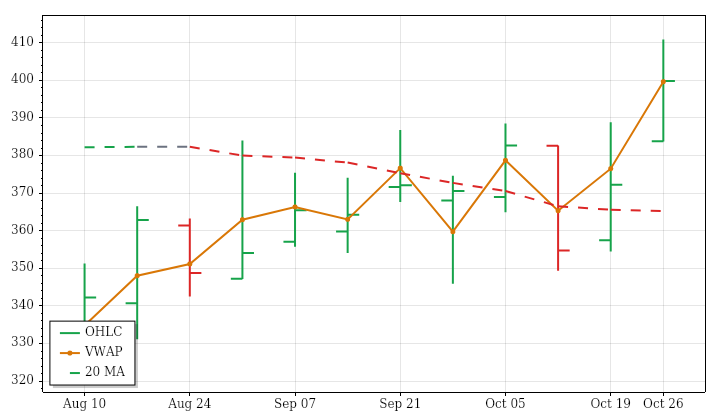
TSLA – Tesla Technicals Summary
TSLA’s completed week beginning October 26, 2026 closed at 399.81, rising 7.41% from the prior weekly close and 4.16% from the open. The difference reflects an opening gap up that remained unfilled. A higher high and higher low led to a close above the previous week’s high, although the finish was only marginally above VWAP rather than materially separated from it.
The advance aligned with near- and far-term uptrends and the upward 12-week price trend. Intermediate positioning remained mixed because price was above an average that was still falling. Weekly range was essentially average and volume moderately above average, alongside lookback expansion and increasing activity. Both PSAR and ATR-median retained positive trends, giving the latest move broader indicator agreement than the intermediate average alone. A next-week low below 354.47 would conditionally trigger a PSAR short reversal.
Tesla News and Fundamentals
Tesla generated $1.5 billion in third-quarter free cash flow. Its Robotaxi service expanded its Houston coverage by more than 200 square miles on Monday, Oct. 26, although riders reported longer-than-usual routes. A Seoul court dismissed a lawsuit by Tesla owners seeking refunds for Full Self-Driving technology. In Europe, Tesla registered a record 66,035 vehicles in September, with Model Y and Model 3 taking the top two registration spots for the first time since 2022.
MSFT · W:2026-10-26 NC% ▼ -0.50% OC% ▼ -1.04%
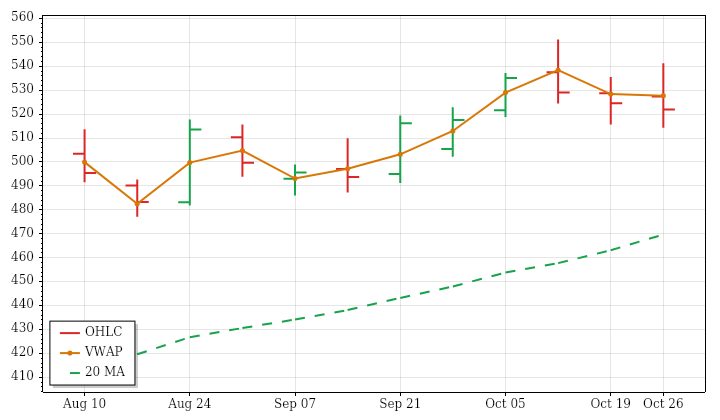
MSFT – Microsoft Technicals Summary
MSFT’s completed week beginning October 26, 2026 closed at 521.91, down 0.50% from the prior weekly close and 1.04% from the open. The opening gap up was filled, and an outside week traded beyond both ends of the preceding week’s range. Despite that wider excursion, the close returned inside the prior range and finished below VWAP, leaving the completed period softer without a closing break beyond that earlier range.
Near-, intermediate- and far-term moving-average structures remained rising, with price only slightly above its near-term benchmark. The latest decline therefore conflicted with otherwise aligned upward trends. Both range and volume exceeded their averages, interrupting 12-week contraction and declining activity. PSAR was in a short state, whereas ATR-median retained its positive trend. A next-week high above 551.15 would conditionally trigger a PSAR long reversal.
Microsoft News and Fundamentals
Microsoft’s fiscal 2027 first-quarter revenue rose 18.8% to $92.2 billion, operating income increased 21%, and Azure revenue grew 48%. Management guided for Azure growth of 49–50% in the second quarter despite capacity constraints. Capital expenditures reached $45.2 billion, while operating cash flow increased 29%. Remaining performance obligations totaled $677 billion, up 73% annually. Microsoft announced pricing for $25 billion in new debt as it pursues its AI buildout and offered buyouts to 60,000 employees during the week.
AAPL · W:2026-10-26 NC% ▼ -0.89% OC% ▲ +0.21%
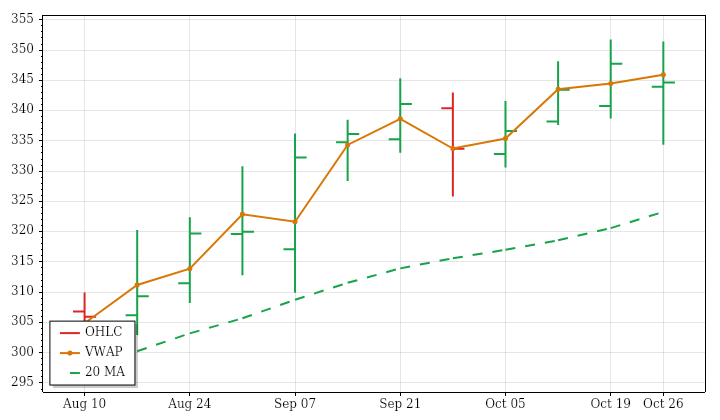
AAPL – Apple Technicals Summary
AAPL’s completed week beginning October 26, 2026 closed at 344.63, down 0.89% from the prior weekly close despite gaining 0.21% from the open. The opening gap down was filled, but the recovery did not restore a positive weekly return. A lower high and lower low showed deterioration, although the close remained inside the previous week’s range and near the open. Finishing below weekly VWAP added a softer element to the otherwise small net move.
That weakness conflicted with rising near-, intermediate- and far-term moving-average structures and the broader 12-week price uptrend. The latest week’s above-average range and volume also interrupted lookback trends of contracting ranges and declining activity. PSAR was in a short state while the ATR-median trend remained positive, underscoring the disagreement. A next-week high above 351.73 would conditionally trigger a PSAR long reversal.
Apple News and Fundamentals
Apple recently announced its first foldable iPhone, a smart-home display and its first touchscreen MacBook Pro. The iPhone Duo sold out on launch day, with orders backed up into January. Management warned of lower gross margins and slower iPhone sales growth as memory costs rise. Ahead of earnings on Monday, Nov. 2, Visible Alpha consensus put fiscal fourth-quarter revenue at $113.6 billion and fiscal 2026 iPhone units at 261 million, up from a previous estimate of 258 million.
NVDA · W:2026-10-26 NC% ▼ -3.00% OC% ▼ -3.97%
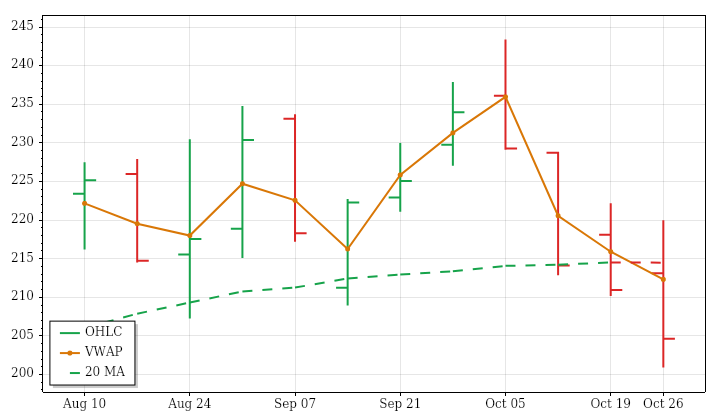
NVDA – Nvidia Technicals Summary
NVDA’s completed week beginning October 26, 2026 closed at 204.64, losing 3.00% from the prior weekly close and 3.97% from the open. The opening gap up was filled, and a lower high and lower low ended with a close below the previous week’s low. The finish beneath VWAP and in the first lower volatility-band zone reinforced the latest week’s downward character.
Across near-, intermediate- and far-term horizons, price was below averages that were still rising. That shared conflict differs from fully aligned downtrends, although the 12-week price trend was modestly negative and highly uneven. Weekly range exceeded average despite contracting lookback ranges; volume stayed below average alongside declining activity. ATR-median crossed into a bearish state while PSAR was already negative. A next-week high above 241.2475 would conditionally trigger a PSAR long reversal.
Nvidia News and Fundamentals
Nvidia is reportedly discussing guarantees for billions of dollars in debt financing for Nscale’s planned Anthropic data center in West Virginia. The Information reported the talks Thursday, with Bloomberg subsequently corroborating them. Nvidia also announced a $3 billion investment in Meta’s share sale on Tuesday, adding to its AI-related stakes, loans and guarantees. Separately, reports alleged that a suspected Chinese intelligence asset developed access to CEO Jensen Huang while her employer bought billions of dollars of Nvidia chips.
AMZN · W:2026-10-26 NC% ▼ -3.08% OC% ▼ -3.66%
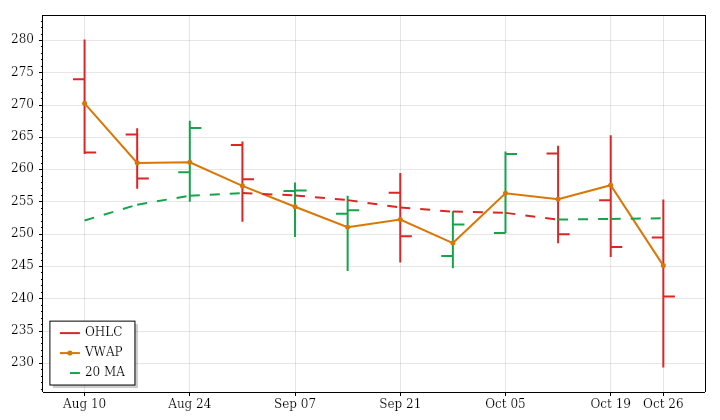
AMZN – Amazon Technicals Summary
AMZN’s completed week beginning October 26, 2026 closed at 240.35, losing 3.08% from the prior weekly close and 3.66% from the open. An opening gap up was filled before the week finished below the previous week’s low. The lower high and lower low, together with a close below weekly VWAP, placed the latest action firmly alongside the near-term downtrend rather than suggesting an established recovery.
The intermediate picture remained conflicted: price was below its benchmark even though that average was rising. The far-term structure still pointed upward, separating immediate weakness from the longer-term trend. Weekly range was nearly twice its usual size and volume was substantially above average, interrupting the 12-week decline in activity while reinforcing expanding ranges. Both PSAR and ATR-median states were negative. A next-week high above 284.3082 would conditionally reverse PSAR to long.
Amazon News and Fundamentals
Amazon’s third-quarter results missed Wall Street expectations, and the company issued a cautious fourth-quarter sales outlook covering the holiday season. AWS revenue rose 39.3% to $46 billion, while its operating income increased 55%. Amazon’s overall operating income grew 61%. Heavy AI infrastructure spending pressured free cash flow, with reported net debt reaching $66 billion. AWS backlog stood at $578 billion, and management projected AWS growth above 40% in both 2027 and 2028.
META · W:2026-10-26 NC% ▼ -4.30% OC% ▼ -3.66%
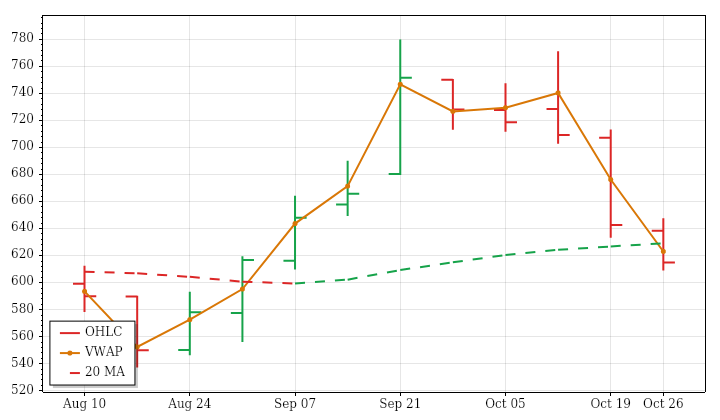
META – Meta Platforms Technicals Summary
META’s completed week beginning October 26, 2026 closed at 614.99, down 4.30% from the prior weekly close and 3.66% from the open. The opening gap down was filled, but the week subsequently finished below the previous week’s low. A lower high and lower low, a close near the weekly low and a finish beneath VWAP all reinforced the latest period’s weak tone.
The decline conflicted with the upward 12-week price trend and rising far-term structure. Near- and intermediate-term readings were mixed because price stood below averages that were still rising. Volume was markedly above average, consistent with increasing lookback activity, even though the weekly range was notably below average against an expansion trend. PSAR was negative while ATR-median remained positive. A next-week high above 771.2782 would conditionally trigger a PSAR long reversal; it was not an already completed signal.
Meta News and Fundamentals
S&P Global Ratings revised Meta’s outlook to negative on Oct. 30, citing uncertainty around elevated capital spending and free operating cash flow. Providing free Muse access reportedly costs up to $40 per user monthly, while AI-related capital expenditures could reach $145 billion this year. Meta settled a teen’s lawsuit alleging depression and eating disorders and lost a challenge to UK regulatory information demands. It also launched Style Sketch, an AI fashion app that builds virtual closets using Instagram photos or uploaded images.
GOOGL · W:2026-10-26 NC% ▼ -12.61% OC% ▼ -12.79%
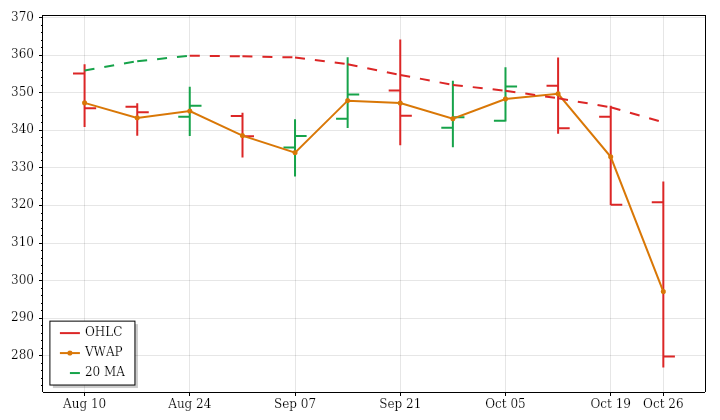
GOOGL – Alphabet Technicals Summary
GOOGL’s completed week beginning October 26, 2026 closed at 279.84, falling 12.61% from the prior weekly close and 12.79% from the open. The small opening gap up was filled before a lower high and lower low culminated in a close beneath the previous week’s low. Finishing near the weekly low, well below VWAP and in the second lower volatility-band zone emphasized the severity of the completed week’s decline.
The move aligned with the near-term downtrend. Intermediate positioning remained conflicted because price was below a still-rising average, while the far-term structure remained upward. Range and volume each exceeded two and a half times their averages: expanding ranges continued, but activity sharply departed from its declining 12-week trend. ATR-median entered a fresh negative trend alongside negative PSAR. A next-week high above 359.856 would conditionally trigger a PSAR long reversal.
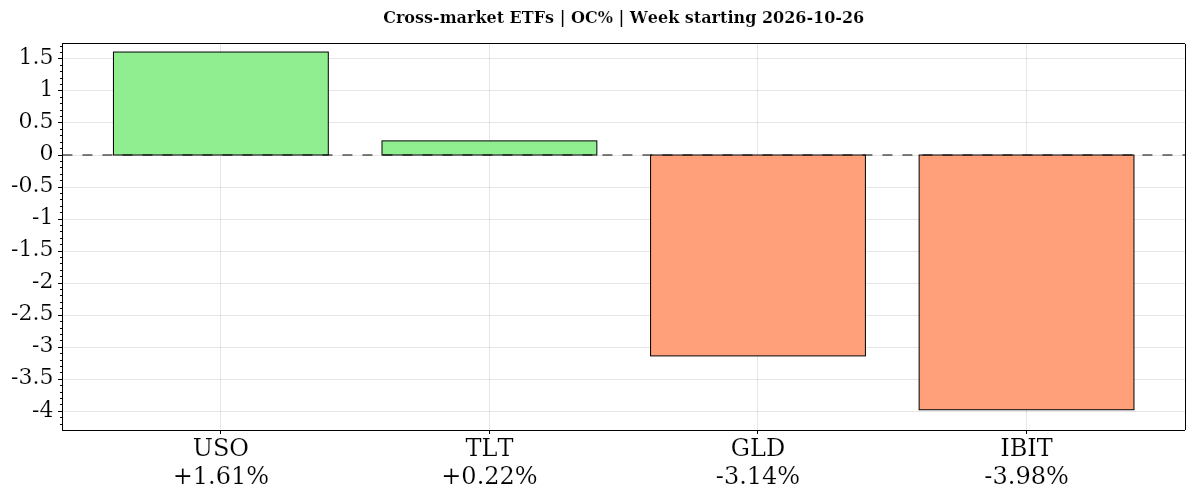
| Instrument | Bias | Date | WNC% | WOC% | O | H | L | C | VWAP | Vol | Mon | Tue | Wed | Thu | Fri |
|---|---|---|---|---|---|---|---|---|---|---|---|---|---|---|---|
| ▲ TLT | ▲ ▲ ▲ | 2026-10-26 | ▲ +0.61% | ▲ +0.22% | 81.66 | 82.03 | 80.73 | 81.84 | ▲ 81.51 | 146,059,769 | +0.42% | -0.06% | -0.78% | +0.62% | +0.43% |
| ▼ USO | ▼ ▲ ▲ | 2026-10-26 | ▼ -0.41% | ▲ +1.61% | 166.16 | 171.82 | 162.69 | 168.83 | ▲ 167.02 | 24,158,135 | -1.95% | -1.41% | +1.64% | +0.97% | +0.38% |
| ▼ GLD | ▼ ▼ ▼ | 2026-10-26 | ▼ -2.95% | ▼ -3.14% | 367.30 | 373.60 | 354.67 | 355.78 | ▼ 365.36 | 46,262,980 | +0.33% | +1.21% | +0.33% | -1.32% | -3.47% |
| ▼ IBIT | ▼ ▼ ▼ | 2026-10-26 | ▼ -5.66% | ▼ -3.98% | 45.16 | 46.37 | 43.02 | 43.36 | ▼ 44.49 | 232,597,849 | -1.61% | +1.06% | +0.96% | -0.93% | -5.14% |
| AVG/Sum | — | — | -2.10% | -1.32% | — | — | — | — | — | 449,078,733 | -0.70% | +0.20% | +0.54% | -0.17% | -1.95% |
Cross-Market ETFs
Negative confluence: average WOC% -1.32% from the week open and WNC% -2.10% versus the prior weekly close. USO led from the open but declined versus the prior close; TLT gained on both, diverging from equity weakness despite longer-term downtrends. GLD and IBIT fell on both comparisons, with bitcoin weakest.
TLT · W:2026-10-26 NC% ▲ +0.61% OC% ▲ +0.22%
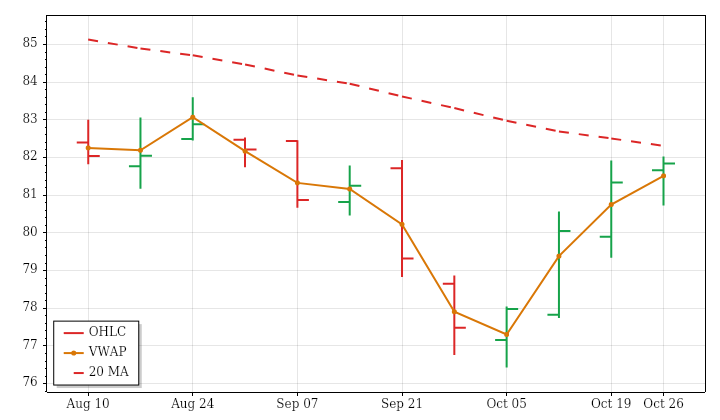
TLT – Long-Term Treasury Bonds Technicals Summary
TLT’s completed week beginning October 26, 2026 closed at 81.84, gaining 0.61% from the prior weekly close and 0.22% from the open. The opening gap up was filled, but a higher high and higher low ended near the weekly high and above VWAP. The close nevertheless remained inside the previous week’s range, making this an improving week within an overlapping structure rather than a closing breakout.
Price was above its falling near-term average, creating a mixed near-term picture, while intermediate- and far-term structures remained downward. The advance therefore opposed both the broader 12-week price decline and longer-horizon alignment. Weekly range and volume were below average despite lookback trends toward expansion and increasing activity. PSAR was positive, but ATR-median remained negative. A next-week low below 76.71 would conditionally trigger a PSAR short reversal.
USO · W:2026-10-26 NC% ▼ -0.41% OC% ▲ +1.61%
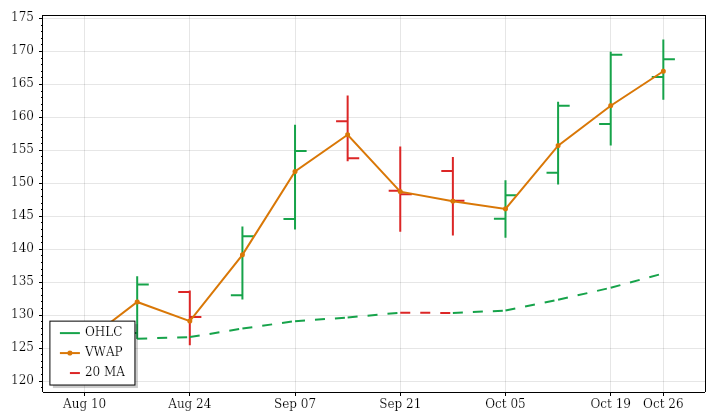
USO – Oil Technicals Summary
USO’s completed week beginning October 26, 2026 closed at 168.83, down 0.41% from the prior weekly close despite advancing 1.61% from the open. An opening gap down was filled, but the finish remained below the previous weekly close. A higher high and higher low, together with a close above VWAP, showed recovery within the week even as the prior-close return stayed negative. The close remained inside the preceding week’s range.
Near-, intermediate- and far-term structures all remained upward, consistent with the rising 12-week price trend. The latest small weekly loss therefore did not match the direction of the broader alignment. Range and volume were below average, contrasting with lookback expansion and increasing activity. PSAR and ATR-median both retained positive trends. A next-week low below 152.284 would conditionally trigger a PSAR short reversal.
Oil News and Fundamentals
Crude oil held near monthly highs on Oct. 30 after a Hormuz tanker attack renewed supply-risk concerns. Falling crude inventories supported prices, while rising gasoline stocks pointed to mixed demand conditions. Prices had previously settled lower on hopes of U.S.-Iran talks before recovering in early Asian trading. On Oct. 29, the U.S. government said oil companies agreed to borrow about 40 million barrels from the Strategic Petroleum Reserve, completing the U.S. share of a global agreement.
GLD · W:2026-10-26 NC% ▼ -2.95% OC% ▼ -3.14%
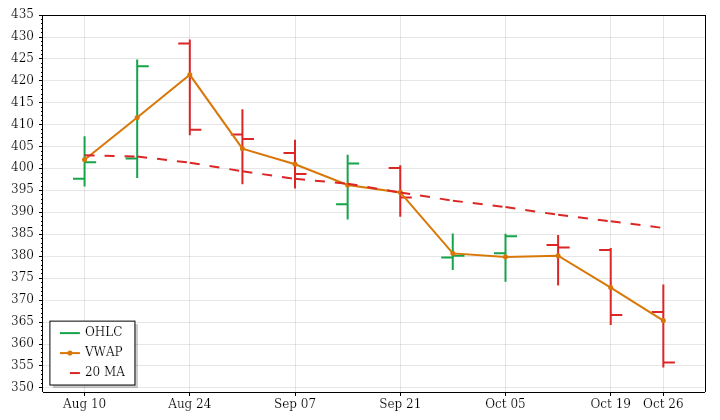
GLD – Gold Technicals Summary
GLD’s completed week beginning October 26, 2026 closed at 355.78, down 2.95% from the prior weekly close and 3.14% from the open. The small opening gap up was filled, followed by a lower high and lower low. The close fell below the previous week’s low and finished near the weekly low, below VWAP and in the first lower volatility-band zone. It also remained very close to the supplied 52-week low.
This weakness aligned with falling near- and intermediate-term averages, while the far-term structure remained rising. The latest range was above average, interrupting the sharp contraction seen across the preceding 12 weeks; volume, however, stayed slightly below average and consistent with declining activity. Both PSAR and ATR-median remained in downtrend states. A next-week high above 393.4311 would conditionally trigger a PSAR long reversal, not confirm a broader recovery.
Gold News and Fundamentals
Gold fell below $4,000 an ounce on Oct. 30 and reached its lowest price in a year despite renewed concerns about potential Middle East attacks. Reports attributed pressure to persistent inflation and elevated real yields. The Federal Reserve held rates at its October meeting; Infinox said expectations of further tightening were supporting yields and weighing on gold. Separately, London Bullion Market Association members supported exploring tokenised gold but sought legal certainty and safeguards to preserve confidence.
IBIT · W:2026-10-26 NC% ▼ -5.66% OC% ▼ -3.98%
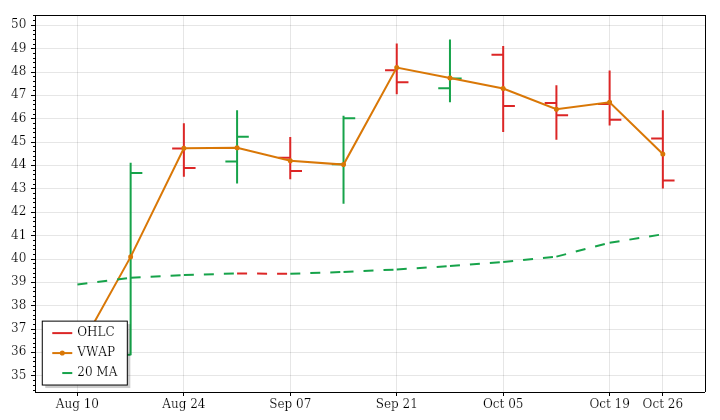
IBIT – Bitcoin Technicals Summary
IBIT’s completed week beginning October 26, 2026 closed at 43.36, down 5.66% from the prior weekly close and 3.98% from the open. The opening gap down was filled, but that recovery did not hold through the close. A lower high and lower low ended below the previous week’s low, near the weekly low and beneath VWAP, making the latest action weaker than the preceding 12-week upward price trend.
Near-term positioning was mixed because price sat below a rising average; intermediate positioning was also mixed, with price above a falling average. No far-term structure was supplied. The above-average weekly range interrupted contracting lookback ranges, while volume was essentially average despite a declining activity trend. PSAR moved into a short state, conflicting with the continuing positive ATR-median trend. A next-week high above 49.39 would conditionally trigger a PSAR long reversal.
Glossary: Instrument — ticker symbol; hover for the instrument or company name; Date — week-start date. WNC% — prior-week close to this week’s close; WOC% — weekly session open-to-close percentage change. O — open; H — high; L — low; C — close, all for the table’s daily or weekly session; VWAP — volume-weighted average price; its arrow shows whether the close is above or below VWAP. Vol — period trading volume. Mon–Fri — each day’s prior-close-to-close percentage change.
Bias — three directional readings, in order: WNC%, WOC%, then VWAP. ▲ positive/above; ▼ negative/below; — neutral or unavailable. Matching arrows show alignment; opposing arrows show mixed conditions. AVG/Sum — simple average of percentage changes and sum of reported volumes.
Futures Session Fib Grid Analysis – Snapshot
Session Fib Grids normalise market positioning as percentages, making direction and alignment comparable across different asset types.
Latest available snapshot for each instrument; Time(CT) shows the individual update date and time.
| Instrument | Bias | Time(CT) | YSFG | MSFG | WSFG | RSFG | SFG | TSI |
|---|---|---|---|---|---|---|---|---|
| ▼ ES | ▲ ▼ ▼ ▼ ▼ ▲ | 2026-10-30 15:59:59 | ▲ +45 | ▼ -46 | ▼ -40 | ▼ -81 | ▼ -81 | ▲ +23 |
| ▼ NQ | ▲ ▼ ▼ ▼ ▼ ▲ | 2026-10-30 15:59:59 | ▲ +43 | ▼ -100 | ▼ -54 | ▼ -49 | ▼ -49 | ▲ +30 |
| ▼ YM | ▲ ▲ ▼ ▼ ▼ ▼ | 2026-10-30 15:59:59 | ▲ +26 | ▲ +24 | ▼ -55 | ▼ -114 | ▼ -114 | ▼ -14 |
| ▼ EMD | ▲ ▲ ▲ ▼ ▼ ▼ | 2026-10-30 15:59:11 | ▲ +32 | ▲ +22 | ▲ +29 | ▼ -54 | ▼ -54 | ▼ -52 |
| ▼ RTY | ▲ ▼ ▲ ▼ ▼ ▲ | 2026-10-30 15:59:58 | ▲ +37 | ▼ -4 | ▲ +27 | ▼ -79 | ▼ -79 | ▲ +41 |
| ▼ FDAX | ▲ ▲ ▲ ▼ ▼ ▼ | 2026-10-30 16:06:27 | ▲ +22 | ▲ +53 | ▲ +67 | ▼ -99 | ▼ -43 | ▼ -108 |
| ▼ NKD | ▲ ▼ ▼ ▼ ▼ ▼ | 2026-10-30 15:59:08 | ▲ +141 | ▼ -80 | ▼ -7 | ▼ -99 | ▼ -27 | ▼ -27 |
| Instrument | Bias | Time(CT) | YSFG | MSFG | WSFG | RSFG | SFG | TSI |
|---|---|---|---|---|---|---|---|---|
| ▲ BTC | ▼ ▼ ▼ ▲ ▲ ▲ | 2026-10-31 10:45:06 | ▼ -48 | ▼ -41 | ▼ -53 | ▲ +2 | ▲ +20 | ▲ +80 |
| ▼ GC | ▼ ▼ ▼ ▼ ▼ ▼ | 2026-10-30 15:59:59 | ▼ -168 | ▼ -71 | ▼ -94 | ▼ -141 | ▼ -110 | ▼ -160 |
| ▼ CL | ▲ ▲ ▲ ▼ ▼ ▼ | 2026-10-30 15:59:59 | ▲ +194 | ▲ +73 | ▲ +26 | ▼ -26 | ▼ -25 | ▼ -159 |
| ▼ 6E | ▼ ▼ ▼ ▼ ▼ ▼ | 2026-10-30 15:59:55 | ▼ -60 | ▼ -75 | ▼ -49 | ▼ -69 | ▼ -12 | ▼ -60 |
| ▼ ZB | ▼ ▲ ▲ ▼ ▼ ▲ | 2026-10-21 09:39:59 | ▼ -39 | ▲ +77 | ▲ +6 | ▼ -3 | ▼ -2 | ▲ +29 |
Glossary: YSFG — yearly; MSFG — monthly; WSFG — weekly; RSFG — regular trading hours (RTH); SFG — the current session, including pre-market or other sessions. TSI indicates trend strength and power.
Bias shows trend alignment across these six readings. The arrows follow the column order: YSFG, MSFG, WSFG, RSFG, SFG and TSI. Matching arrows show alignment; opposing arrows show mixed conditions.
Data, Market and System
Market Weekly Recap Summary
Early sessions centered on positioning for megacap earnings and Wednesday’s Fed decision. Stocks advanced as investors balanced AI growth optimism against spending, cash-flow and financing concerns; stronger durable goods orders and consumer confidence supported Tuesday’s growth backdrop. After Wednesday’s modest gains, Alphabet’s earnings miss shifted attention toward whether substantial cloud growth justified investment costs. Its selloff weighed on Thursday’s benchmarks even as smaller companies advanced, and technology weakness broadened Friday. Alphabet finished down 12.61%, versus declines of 4.30% for Meta, 3.08% for Amazon and 3.00% for Nvidia. Tesla diverged sharply, gaining 7.41%.
Inflation remained a persistent constraint rather than a new CPI-release story: September’s hotter-than-expected CPI informed positioning ahead of the Fed. Wednesday’s decision held rates at 3.75%–4.00%, but two dissents favoring an increase and continued expectations of a December hike limited reassurance. Thursday’s stronger-than-expected 3.4% third-quarter GDP growth reinforced tightening concerns, while Friday brought a call from Dallas Fed President Lorie Logan for at least two additional quarter-point increases. Long-dated Treasuries nevertheless recovered from Wednesday’s decline to finish the week higher.
Energy supplied an important reversal. Oil weakened early as hopes for Middle East diplomatic progress grew, then rebounded from Wednesday as ceasefire optimism faded and renewed military risks involving Iran came into focus. Higher energy prices kept inflation concerns prominent, although the oil fund still posted a small weekly loss. Gold’s early resilience also faded as investors weighed stronger growth and further tightening, culminating in Friday’s precious-metals selloff. Bitcoin weakened as well, with the reported Binance theft adding a separate security concern; IBIT lost 5.66% over the week.
Daily Session Recap
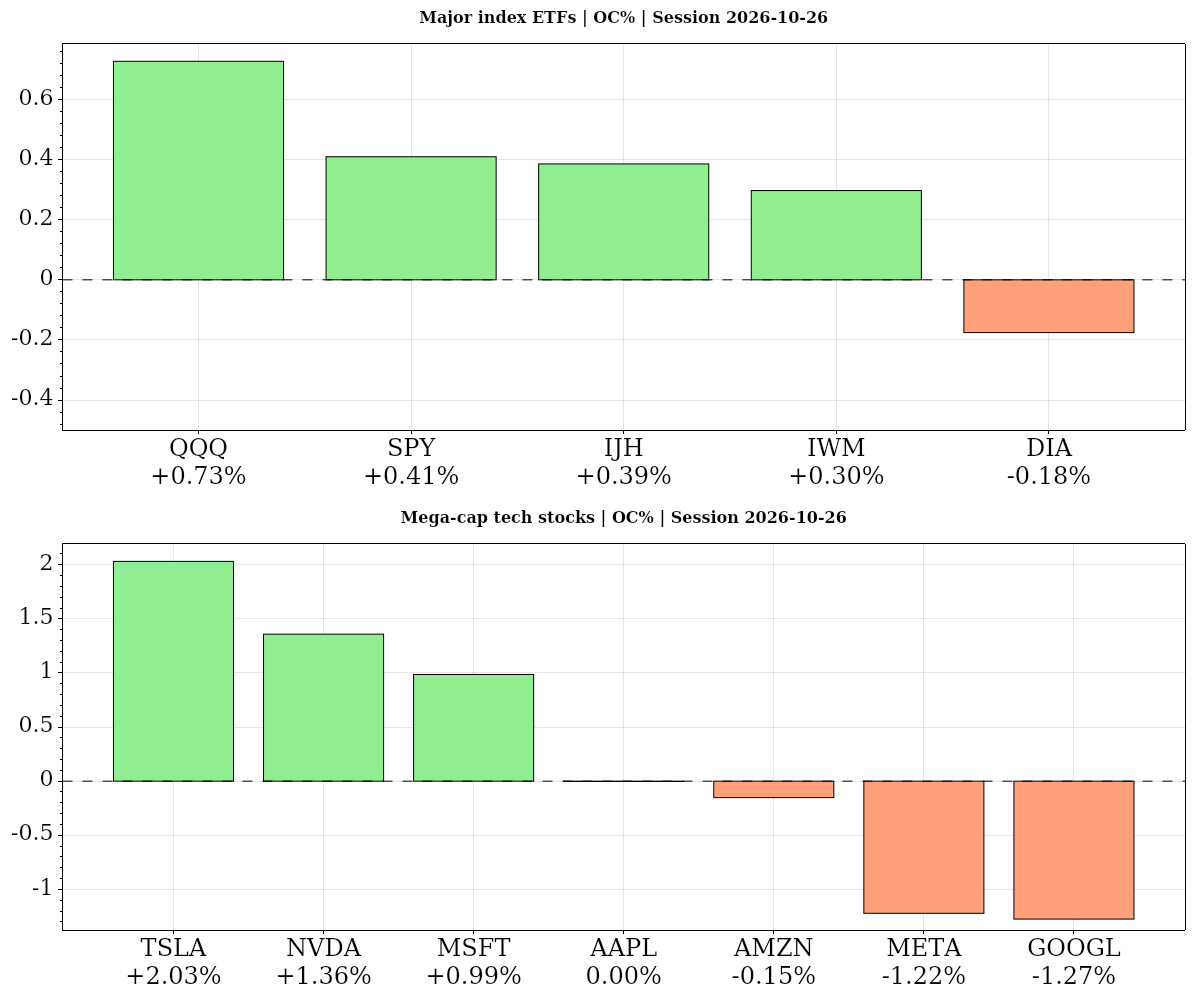
Monday 2026-10-26 — Session Summary
Stocks advanced from Monday’s open, with the S&P 500 and Nasdaq-100 ETFs rising 0.41% and 0.73%, respectively, as investors positioned for major technology earnings and Wednesday’s Federal Reserve decision. The gains left a mixed technical picture: both benchmarks retained near-term weakness within rising longer-term structures. Tesla, Nvidia and Microsoft advanced, while Alphabet and Meta declined, reflecting a cautious backdrop for technology despite continued optimism about AI growth.
AI investment and monetization remained the central equity themes ahead of megacap results. Scrutiny of spending, valuations and tighter financing conditions tempered enthusiasm about the technology’s growth potential. Semiconductor selling and the S&P 500’s technology concentration connected those concerns to broader index exposure, keeping earnings expectations important beyond individual companies. The power requirements of AI development also remained an energy-sector theme, with Bloom Energy and Solaris Energy identified as beneficiaries of demand from AI developers.
Policy and inflation supplied the other major cross-currents. Previews centered on the Fed holding rates at 3.75–4.00% on October 28, while market pricing assigned nearly a 78% probability to a December increase. Inflation above 3%, weaker job growth and rising financial pressures complicated the policy outlook. The October Treasury rally had stalled with 10-year yields below 5%; far-term Treasury bonds added just 0.02% from Monday’s open. The day’s issuance calendar included 13- and 26-week bill auctions and a two-year note sale. Overseas, European bonds recovered ahead of central-bank decisions, while EUR/USD consolidated near 1.12.
Oil retreated ahead of the Fed, ECB and Bank of Japan decisions, contrasting with persistent inflation concerns. The oil ETF finished 1.95% below its prior close despite edging up 0.04% from the open. Gold gained 0.14% from the open, but falling moving averages and more cautious sentiment in the second half of 2026 remained headwinds. Central-bank demand had helped lift gold above $5,600 an ounce earlier in the year, while the unresolved Iran war and continuing Middle East conflict remained part of the cautious precious-metals backdrop.
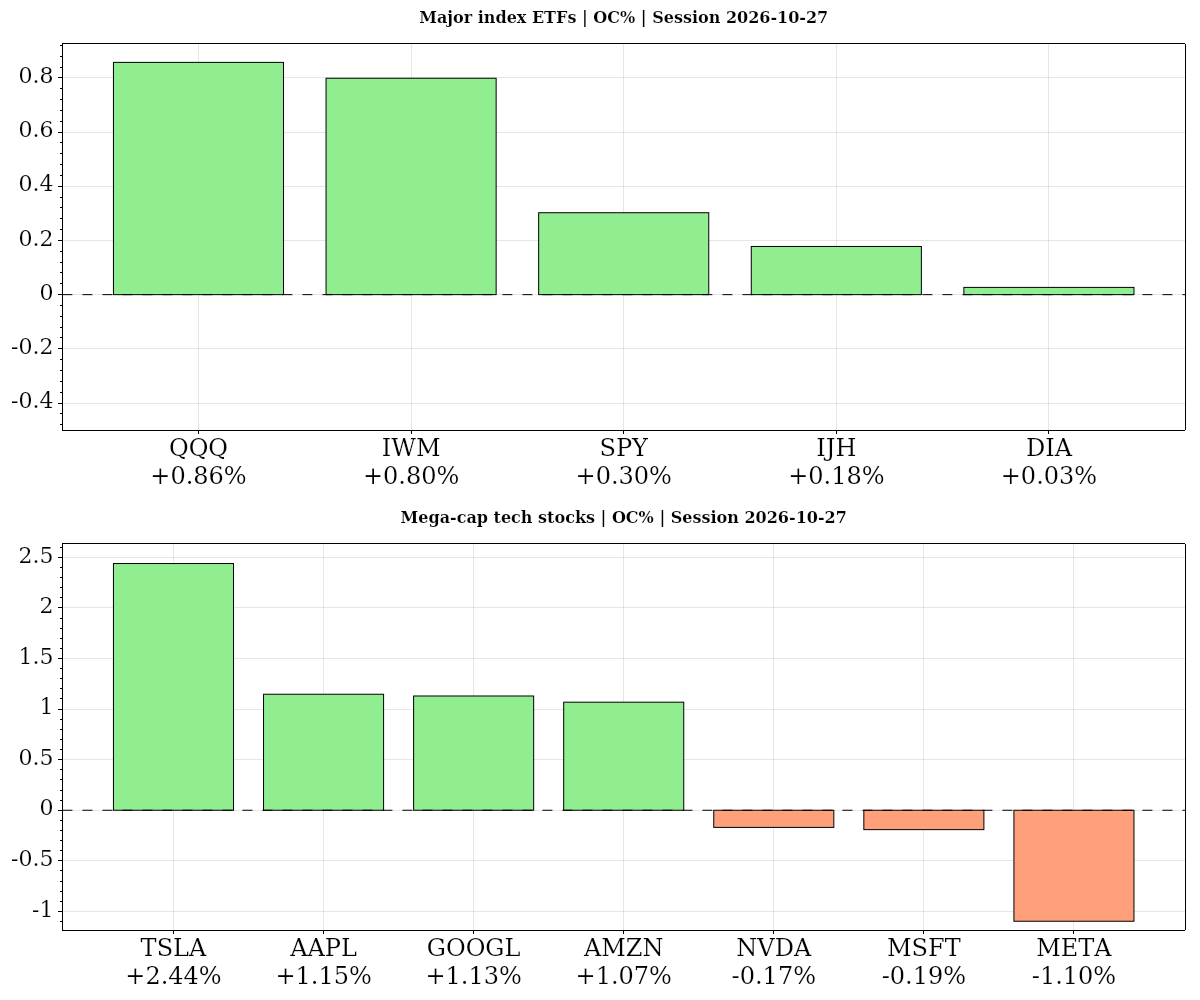
Tuesday 2026-10-27 — Session Summary
- CB Consumer Confidence — 10:00 ET · Medium
Stocks advanced Tuesday, led by technology, as stronger economic data shared attention with positioning ahead of major earnings. The S&P 500 ETF gained 0.30% from the open and the Nasdaq-100 ETF rose 0.86%, both on below-average volume. Durable goods orders increased 1.8%, while consumer confidence beat forecasts, providing a supportive growth backdrop. The tone nevertheless remained cautious ahead of Alphabet and Microsoft’s Wednesday results, with investors focused on AI cloud growth and the spending required to sustain it.
The balance between AI demand and infrastructure costs remained the central earnings issue. Scrutiny extended beyond revenue growth to cash flow and returns on investment: Amazon’s internal AI memo rejected token usage and code generation alone as measures of productivity. Financing concerns also remained relevant after Meta’s negative free cash flow pushed credit-default spreads and bond yields higher, although its Monday equity-offering announcement eased debt concerns. Tuesday’s technology gains were uneven, with Tesla climbing 2.44% from its open while Meta fell 1.10%.
Interest rates and inflation added to the event-risk backdrop. Treasury auctions included a five-year note yielding 4.845%, while long-dated Treasury bonds edged down 0.02% from the open. Attention also remained on the forthcoming Federal Reserve decision, with expectations centered on an October rate hold despite September CPI having come in hotter than anticipated. The decision’s proximity to the midterm elections added context to the policy debate. Inflation pressures were also evident in warnings from consumer goods and food companies of further price increases next year to cover rising costs linked to the Iran war.
Oil futures fell, with U.S. benchmark crude slipping below $100 a barrel as hopes for Middle East diplomatic progress accompanied the decline. The oil ETF lost 1.09% despite rising moving-average trends, while chart commentary pointed to momentum divergence and a potential triple top as signs of weakening buying momentum. API crude inventory data were due later in the afternoon. Gold moved in the opposite direction, with its ETF gaining 1.04% despite declining trend averages, against a backdrop of geopolitical risks and U.S. dollar shifts. Falling oil also weighed on the Canadian dollar as investors grew cautious ahead of the Bank of Canada’s rate decision.
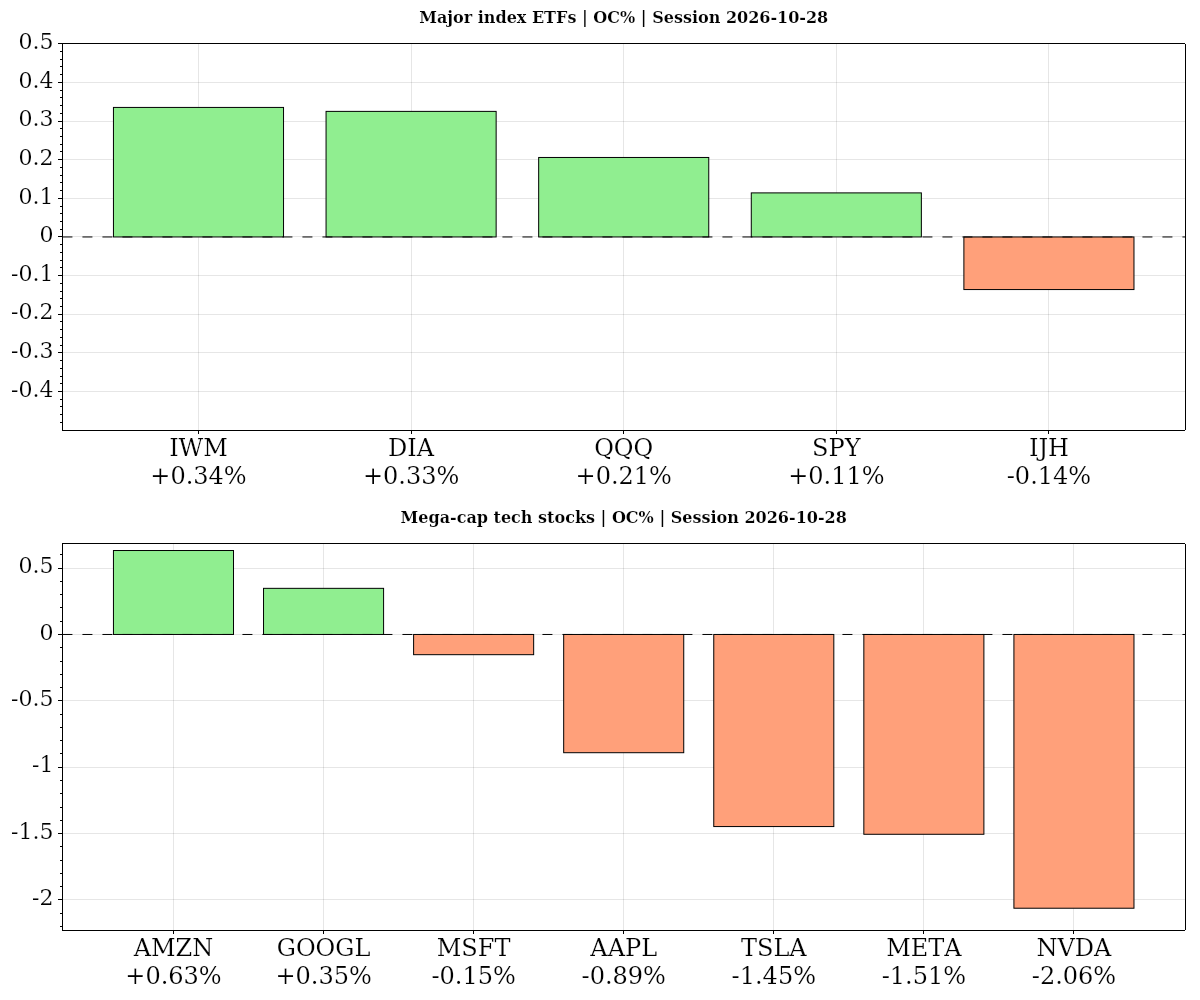
Wednesday 2026-10-28 — Session Summary
- EIA Crude Oil Stocks Change — 10:30 ET · Low
- Fed Interest Rate Decision — 14:00 ET · High
- FOMC Press Conference — 14:30 ET · High
- GOOGL — Earnings · AMC
- MSFT — Earnings · AMC
- VRT — Earnings · BMO
Stocks edged higher Wednesday as investors balanced a Federal Reserve pause against persistent inflation concerns and positioned ahead of Alphabet and Microsoft earnings after the close. The S&P 500 and Nasdaq-100 ETFs gained 0.11% and 0.21%, respectively, from their opening levels on below-average volume. Megacap performance was mixed, with Alphabet advancing while Nvidia and Meta declined. The modest gains reflected a cautious backdrop, with corporate results and cloud investment scrutiny at Amazon and Microsoft sharing attention with monetary policy.
The Fed held its target range at 3.75%–4.00% in a 10–2 vote, with Beth Hammack and Lisa Cook dissenting in favor of an increase. Investors continued to price a quarter-point December hike as worsening inflation data kept further tightening in focus. Chair Kevin Warsh offered a positive assessment of the economy and said it was not running too hot, but emphasized that inflation remained too high. He attributed the pause to an approaching information-rich period and said politics played no role in the decision. Far-term Treasury bonds lost 0.90%, underscoring the difficult backdrop for rate-sensitive assets.
Energy remained a central inflation risk as ceasefire optimism faded and concerns grew about renewed military operations against Iran. WTI and Brent rose as traders positioned around the possibility of further Middle East escalation. The oil ETF retained its opening gap, finishing 1.64% above its prior close despite gaining only 0.01% from the open. Recent inflation acceleration remained tied to war-related oil and gasoline price spikes, while higher gasoline, grocery and clothing costs weighed on consumer sentiment ahead of the following week’s midterm elections.
Gold fell to $4,035 an ounce following the Fed decision, although the gold ETF still finished 0.60% above its opening level despite declining longer-term averages. That contrast, alongside weak long-dated Treasuries and thin equity volume, left technical conditions mixed rather than broadly supportive. The session’s small stock-market advance therefore sat alongside continuing pressure from elevated prices, a divided Fed and an energy market sensitive to geopolitical developments.
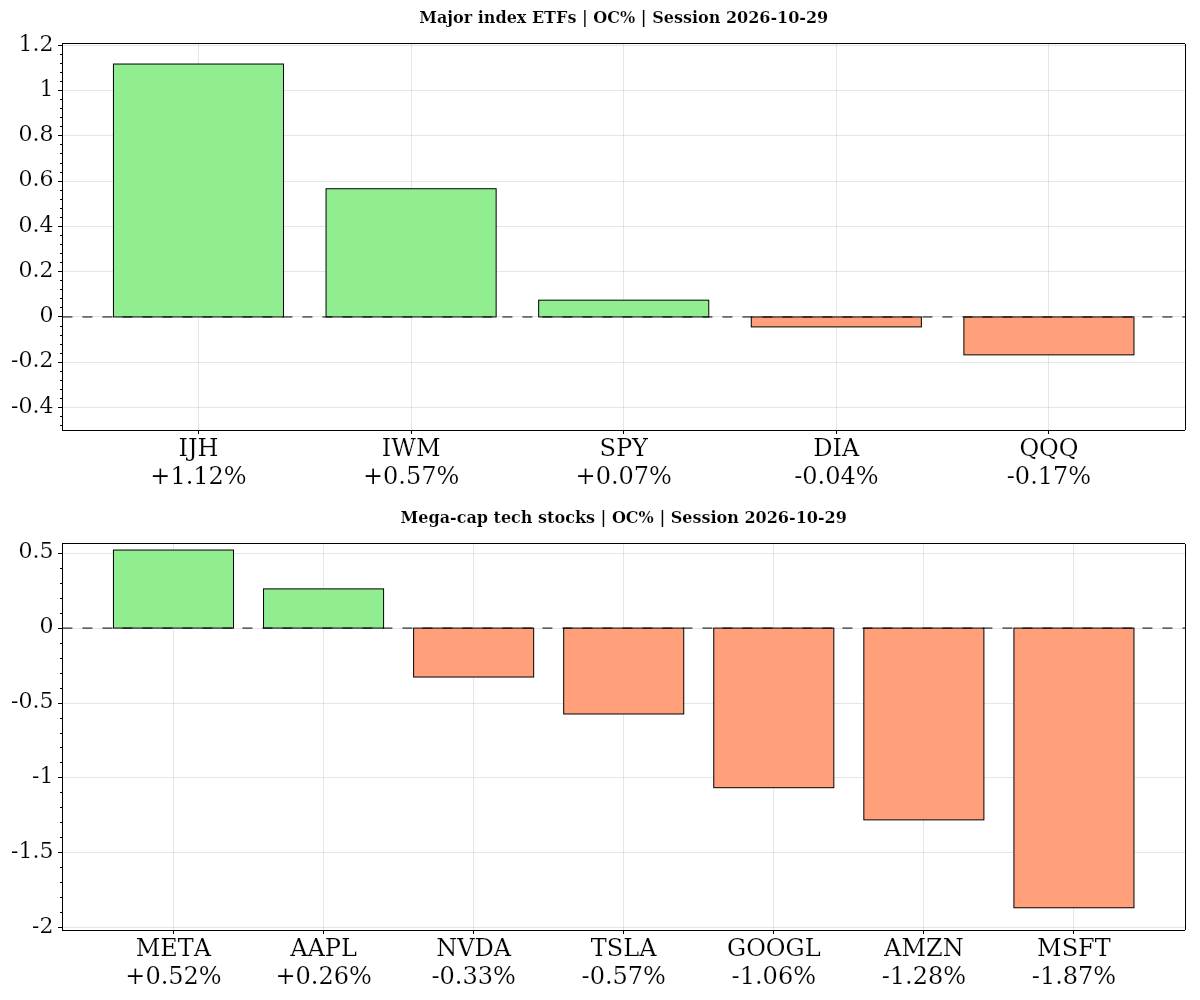
Thursday 2026-10-29 — Session Summary
- Advance GDP q/q — 08:30 ET · High
- Core Personal Consumption Expenditures – Price Index (MoM) — 08:30 ET · High
- Gross Domestic Product Price Index — 08:30 ET · High
- Initial Jobless Claims — 08:30 ET · Medium
- Personal Income (MoM) — 08:30 ET · Medium
- Personal Spending — 08:30 ET · Medium
- Core Personal Consumption Expenditures – Price Index (YoY) — 08:30 ET · High
- Core Personal Consumption Expenditures (QoQ) — 08:30 ET · Medium
- Gross Domestic Product Annualized — 08:30 ET · High
- Personal Consumption Expenditures – Price Index (MoM) — 08:30 ET · Medium
- Personal Consumption Expenditures – Price Index (YoY) — 08:30 ET · Medium
- Personal Consumption Expenditures Prices (QoQ) — 08:30 ET · Medium
- 4-Week Bill Auction · $115B — 11:30 ET · Medium
- 8-Week Bill Auction · $110B — 11:30 ET · Medium
- 7-Year Note Auction · $44B — 13:00 ET · High
- AMZN — Earnings · AMC
- INTC — Earnings · AMC
Stocks finished lower as Alphabet’s earnings miss weighed on the S&P 500 and Nasdaq, while investors positioned ahead of Amazon and Intel results due after the close. The S&P 500 ETF ended 0.38% below its previous close, despite edging 0.07% higher from its opening level, and the Nasdaq-100 ETF fell 0.17% from its open. The weakness was not uniform: midcaps and small caps advanced, highlighting a divergence between the largest technology names and the broader market.
Alphabet’s selloff put the focus on earnings expectations and the cost of AI investment, even as its cloud business delivered substantial growth. Reactions across AI-linked companies remained mixed, with gains in Oracle providing a counterpoint to Alphabet’s weakness. Microsoft’s new bond issuance underscored the expanding role of debt financing in AI investment programs. The scale of the infrastructure buildout was also evident in Constellation Energy’s 20-year power agreements with Amazon and Google, covering more than one gigawatt of capacity scheduled to come online over the next several years.
Inflation and monetary policy concerns added to the pressure on equities. Third-quarter U.S. GDP growth of 3.4%, above consensus estimates, continued to reinforce expectations of a possible December Federal Reserve rate hike. Robust consumer spending and investment supported the expansion, with particularly strong growth in information-processing equipment and AI-related assets. Thursday’s calendar also included jobless claims, income and spending releases, Treasury bill auctions and a $44 billion seven-year note auction. Gold retreated as traders weighed the implications of stronger growth and higher energy prices for further tightening, while far-term Treasury bonds edged higher.
Oil rose amid persistent Middle East tensions, with the oil fund gaining 2.36% from its open. Netanyahu’s bloc winning Israel’s election and preparations for renewed military operations against Iran kept geopolitical risk in focus, alongside shipping disruptions associated with the eight-month conflict. Higher crude prices sustained inflation concerns as investors awaited Big Oil earnings and guidance. Technical signals remained mixed: S&P 500 futures retained bullish ratings, while Nasdaq futures showed medium-term weakness, consistent with the session’s uneven equity performance.
Friday 2026-10-30 — Session Summary
- Employment Cost Index — 08:30 ET · Medium
- Fed's Barkin speech — 09:30 ET · Medium
- Chicago PMI — 09:45 ET · Medium
- Fed's Daly speech — 12:00 ET · Medium
- Fed's Musalem speech — 12:30 ET · Medium
- Fed's Logan speech — 13:30 ET · Medium
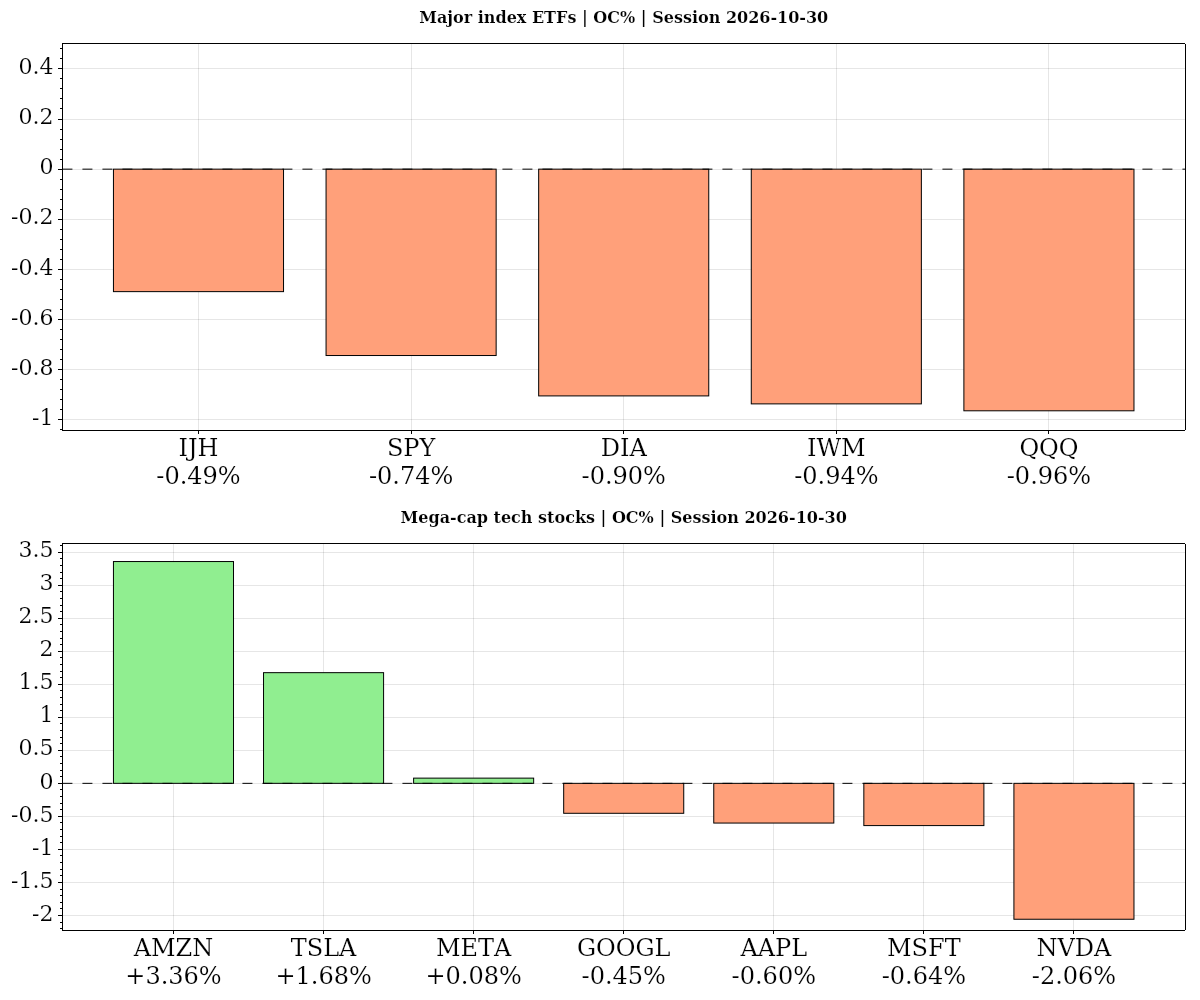
Stocks fell Friday as technology selling dominated a risk-off session, with investors scrutinizing the cost of AI infrastructure, its demands on cash flow and the financing arrangements supporting it. Amazon, Alphabet and Nvidia came under pressure, although favorable assessments of Microsoft’s capital discipline provided a contrast. From their opening levels, the S&P 500 ETF lost 0.74%, the Nasdaq-100 ETF dropped 0.96% and Nvidia shed 2.06%, underscoring the concentration of weakness in technology.
Monetary policy added another risk alongside those corporate spending concerns. The Federal Reserve had held interest rates steady, but Dallas Fed President Lorie Logan said the economic outlook required at least two further quarter-point increases to bring inflation under control. Her call for at least 50 basis points of additional tightening kept higher borrowing costs and financing stress in focus. The Employment Cost Index matched the 0.8% forecast, while Chicago PMI fell short of expectations at 55.3. Far-term Treasury bond ETFs nevertheless finished 0.43% above their previous close, despite slipping 0.02% from the open.
Energy prices strengthened as reports that President Trump had received a briefing on military options against Iran renewed geopolitical concerns. WTI tested new highs, reversing the more supportive backdrop from cooling crude prices earlier in the week. Oil ETFs closed 0.38% above their prior close even after losing 0.54% from the open. ExxonMobil and Chevron reported billions in quarterly profits against a backdrop of Middle East and Russia-Ukraine conflicts and a 34.2% year-over-year rise in gasoline prices, keeping energy-related inflation pressures prominent.
Precious metals offered little shelter from the broader selling. Gold fell 3.5%, while gold, silver and platinum tested multi-month lows. The gold ETF declined 1.57% from its open, with downtrends aligned across time horizons. Bitcoin also weakened after a Binance theft affected $6.3 billion in client assets, adding a separate crypto-security concern. Despite the near-term equity pressure, broader stock-index futures retained bullish far-term technical structures, leaving a contrast between Friday’s technology-led retreat and the longer-term trend.
Futures Higher Time Frame Analysis
Summary of the current state of US Indices Futures based on higher time-frame (HTF) technical analysis as of: 2026-10-31 11:30 -05:00 CT.
US Indices Futures
- ES YSFG above F0%, MSFG/WSFG below F0%, declining short-term benchmarks, pivot trends down, support 7558.25 then 7391.75–7376.25, reversal 7733.25, resistance 7819.50.
- NQ YSFG above F0%, MSFG/WSFG below F0%, daily 5–100 benchmarks overhead, testing rising 200-day 28498.25, support 28275–28327.75, daily reversal 29462.25.
- YM YSFG/MSFG above F0%, WSFG below F0%, daily 5–100 benchmarks overhead, pivots down, daily support 51797, weekly support 50776–50859, daily reversal 52961.
- EMD daily YSFG/MSFG/WSFG above F0%, rising daily 5–20 benchmarks, daily pivots up versus weekly down, weekly support 3600.3, reversal 3793.9, resistance 3969.6.
- RTY YSFG above F0%, MSFG below F0%, WSFG unspecified, daily 5–20 benchmarks reclaimed, daily pivots up versus weekly down, support 2723.3, resistance 2880.2–2888.9.
- FDAX YSFG/MSFG/WSFG above F0%, above all daily benchmarks, daily pivots up versus weekly corrective rotation, pivot reference 25560, support 24925, resistance 26246 then 26844–26847.
Overall State
- Short-Term: Bearish
- Intermediate-Term: Neutral
- Long-Term: Bullish
Conclusion
ES and NQ show aligned daily/weekly declines, with recent short signals and MSFG/WSFG positions below F0%. YM retains monthly support despite its weekly-grid decline. RTY’s daily rebound diverges from its bearish weekly and intermediate structures. EMD and FDAX retain stronger grid alignment, although weekly short-term pivots remain corrective; EMD’s recent weekly long signals contrast with its down pivot trend. Rising longer-term benchmarks and yearly-grid positions preserve the broader bullish context, while NQ tests its rising 200-day benchmark. EMD’s daily long-term rating remains neutral.
Note: Intra-day counter-trend pullbacks or retracements may occur, HTF is context for informational usage and market structure. Glossary: Session Fib Grids periods of YSFG:’Yearly’, MSFG:’Monthly’, WSFG:’Weekly’
For full details visit: AlphaWebTrader Technicals
SPY Weekly View
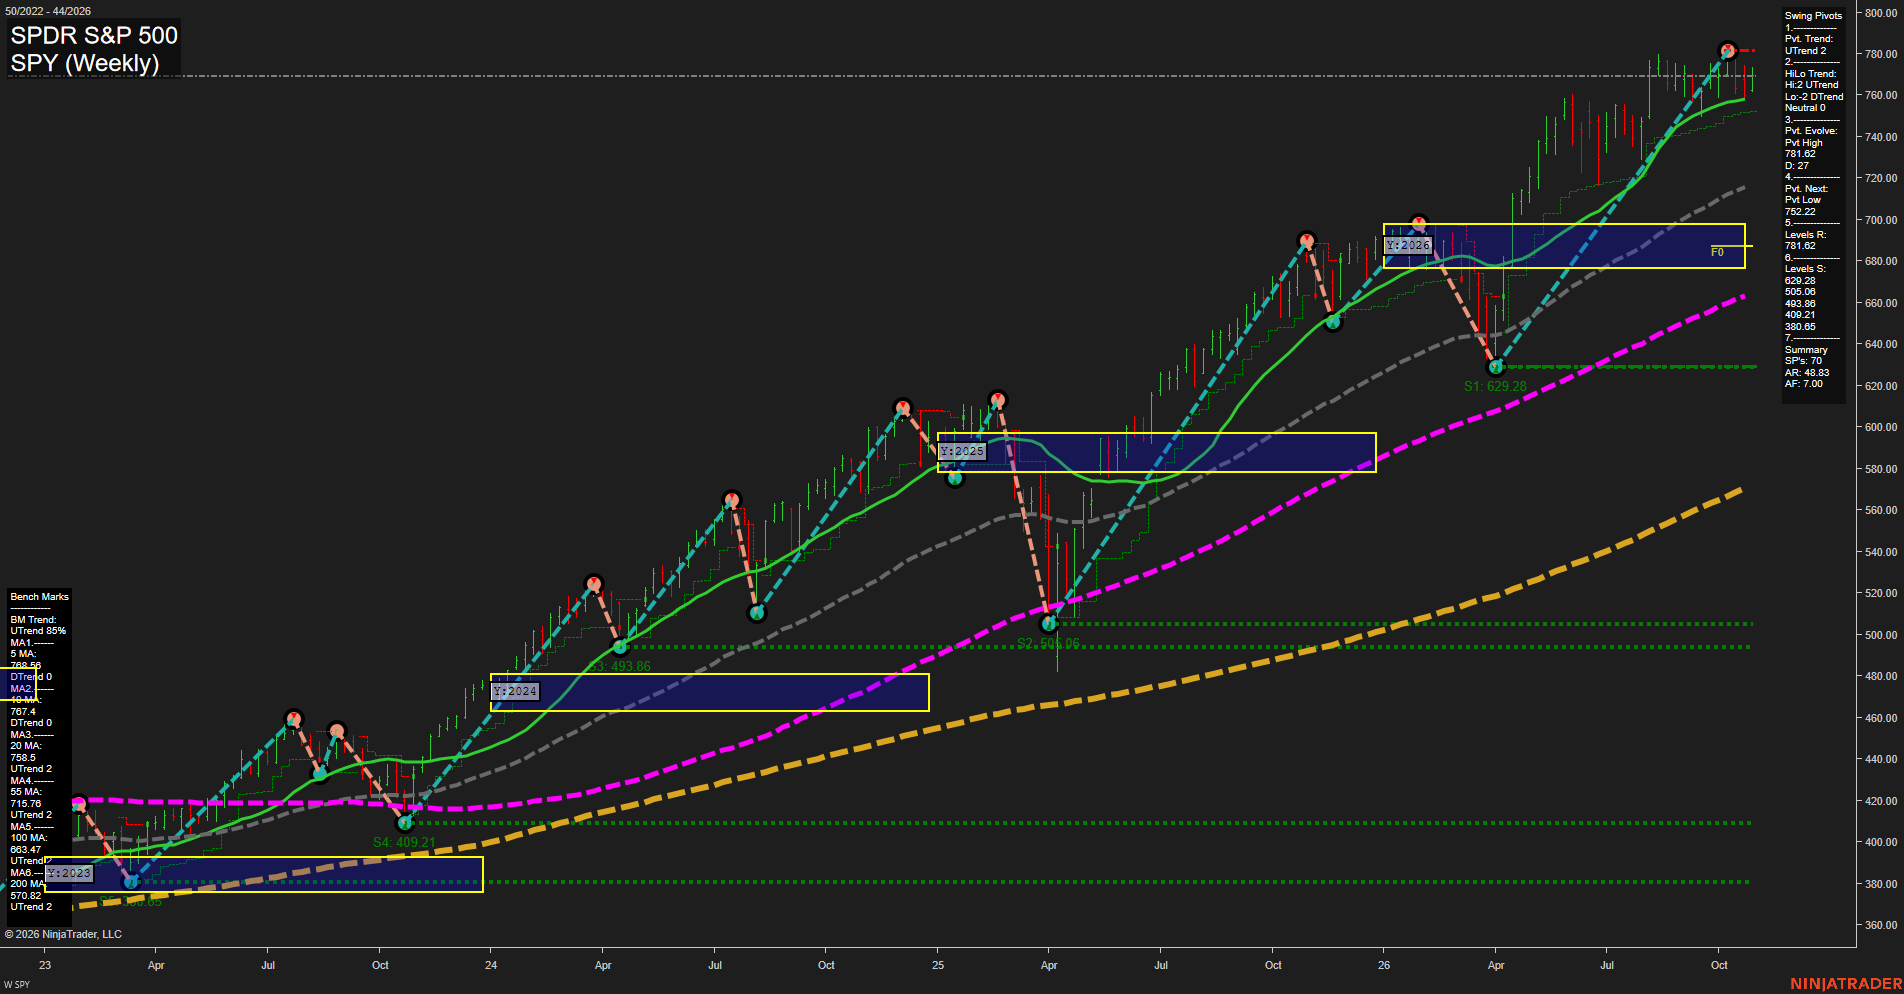
Overall Rating
- Short-Term: Neutral
- Intermediate-Term: Bullish
- Long-Term: Bullish.
Key Insights Summary
The futures swing structure remains broadly constructive: price is above the rising 20, 55, 100, and 200-period benchmarks and remains materially above the 2026 yearly NTZ/F0% area. The intermediate pivot structure is still an UTrend, while the short-term pivot has shifted to DTrend following rejection from the 781.62 pivot high. The 752.22 reversal level and rising 20-period benchmark near 758.35 define the immediate pullback/consolidation zone, while 781.62 remains the overhead swing reference. This is a mature upward leg with short-term mean reversion and softer near-term momentum, not a confirmed deterioration of the larger bullish structure.
View charts on: AlphaWebTrader HTF Charts
ES Weekly View
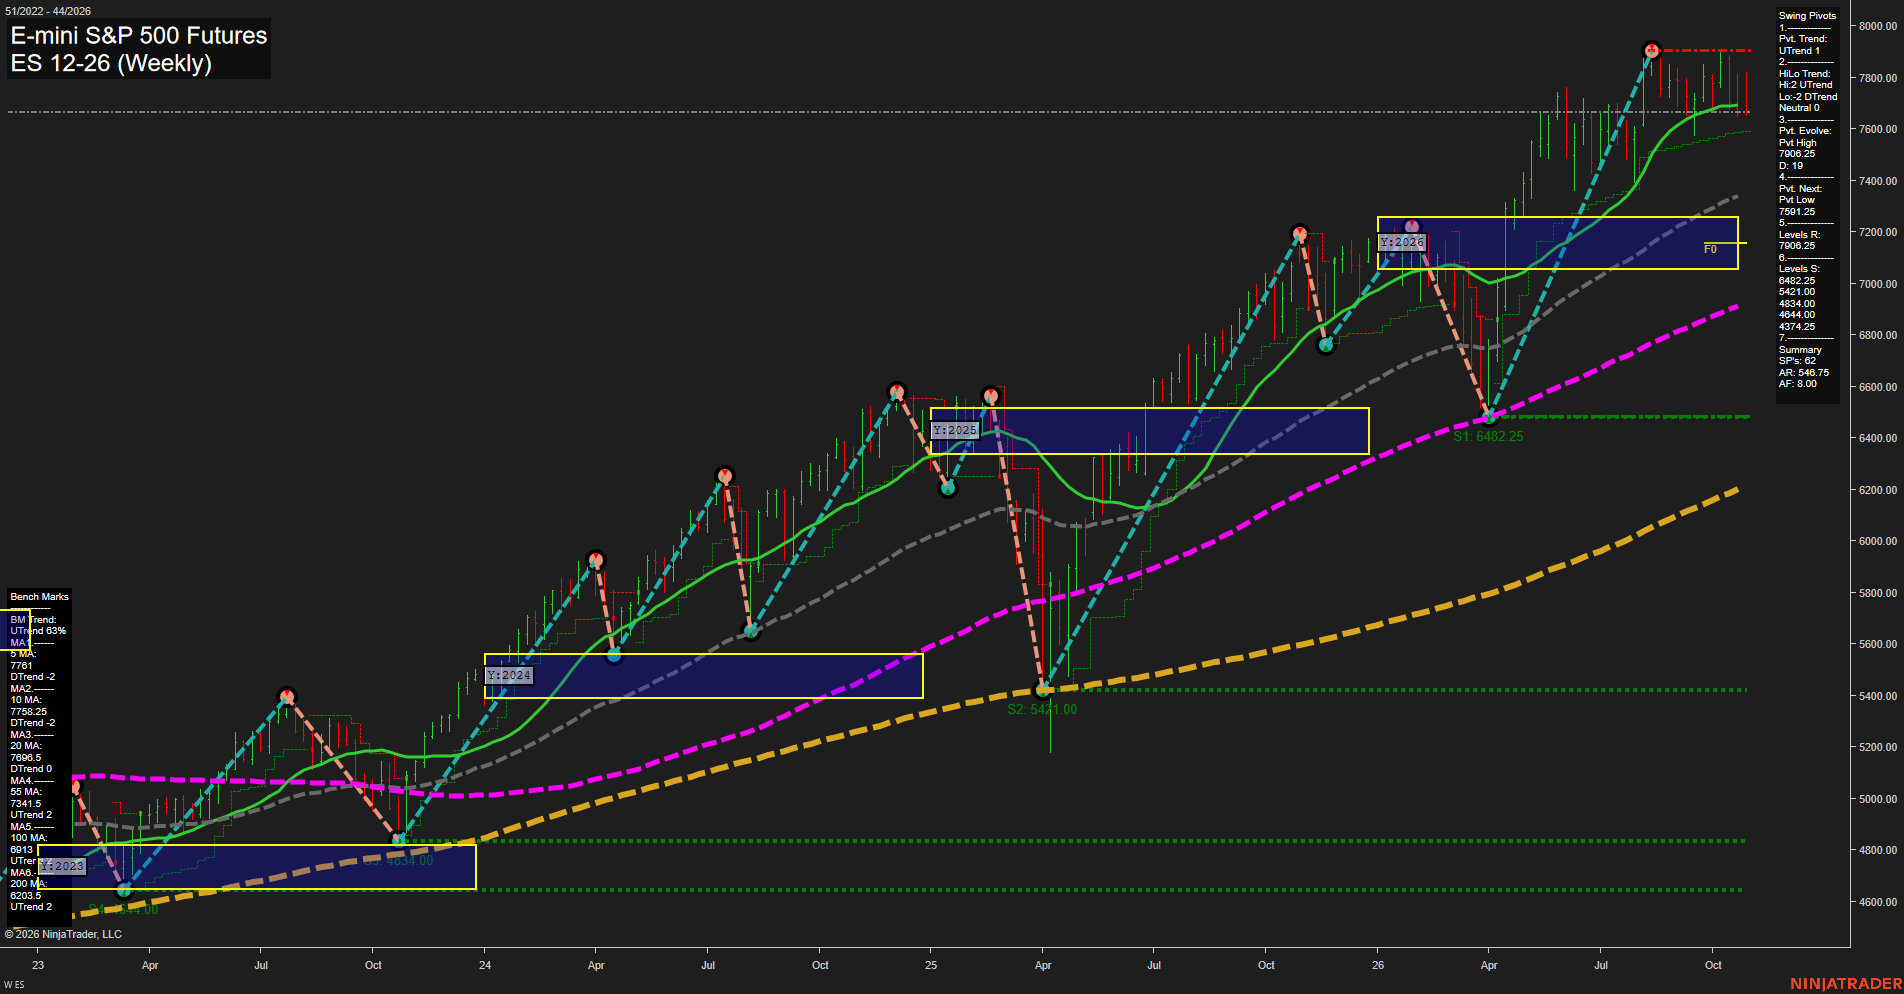
Overall Rating
- Short-Term: Bearish
- Intermediate-Term: Bearish
- Long-Term: Bullish.
Key Insights Summary
Price is consolidating beneath the 7906.25 pivot-high resistance after an extended advance, with small weekly bars and slow momentum reflecting a pullback phase rather than broad long-term trend failure. The weekly and monthly Fib grids are below their F0% areas and the 5, 10, and 20-week benchmarks are turning lower, aligning with near-term bearish pressure. The intermediate pivot structure and the 55, 100, and 200-week benchmarks remain upward, while price holds well above major support at 6482.25. The 7591.25 pivot-next level defines the nearby structural downside reference, while 7906.25 remains the key upper swing boundary.
View charts on: AlphaWebTrader HTF Charts
QQQ Weekly View
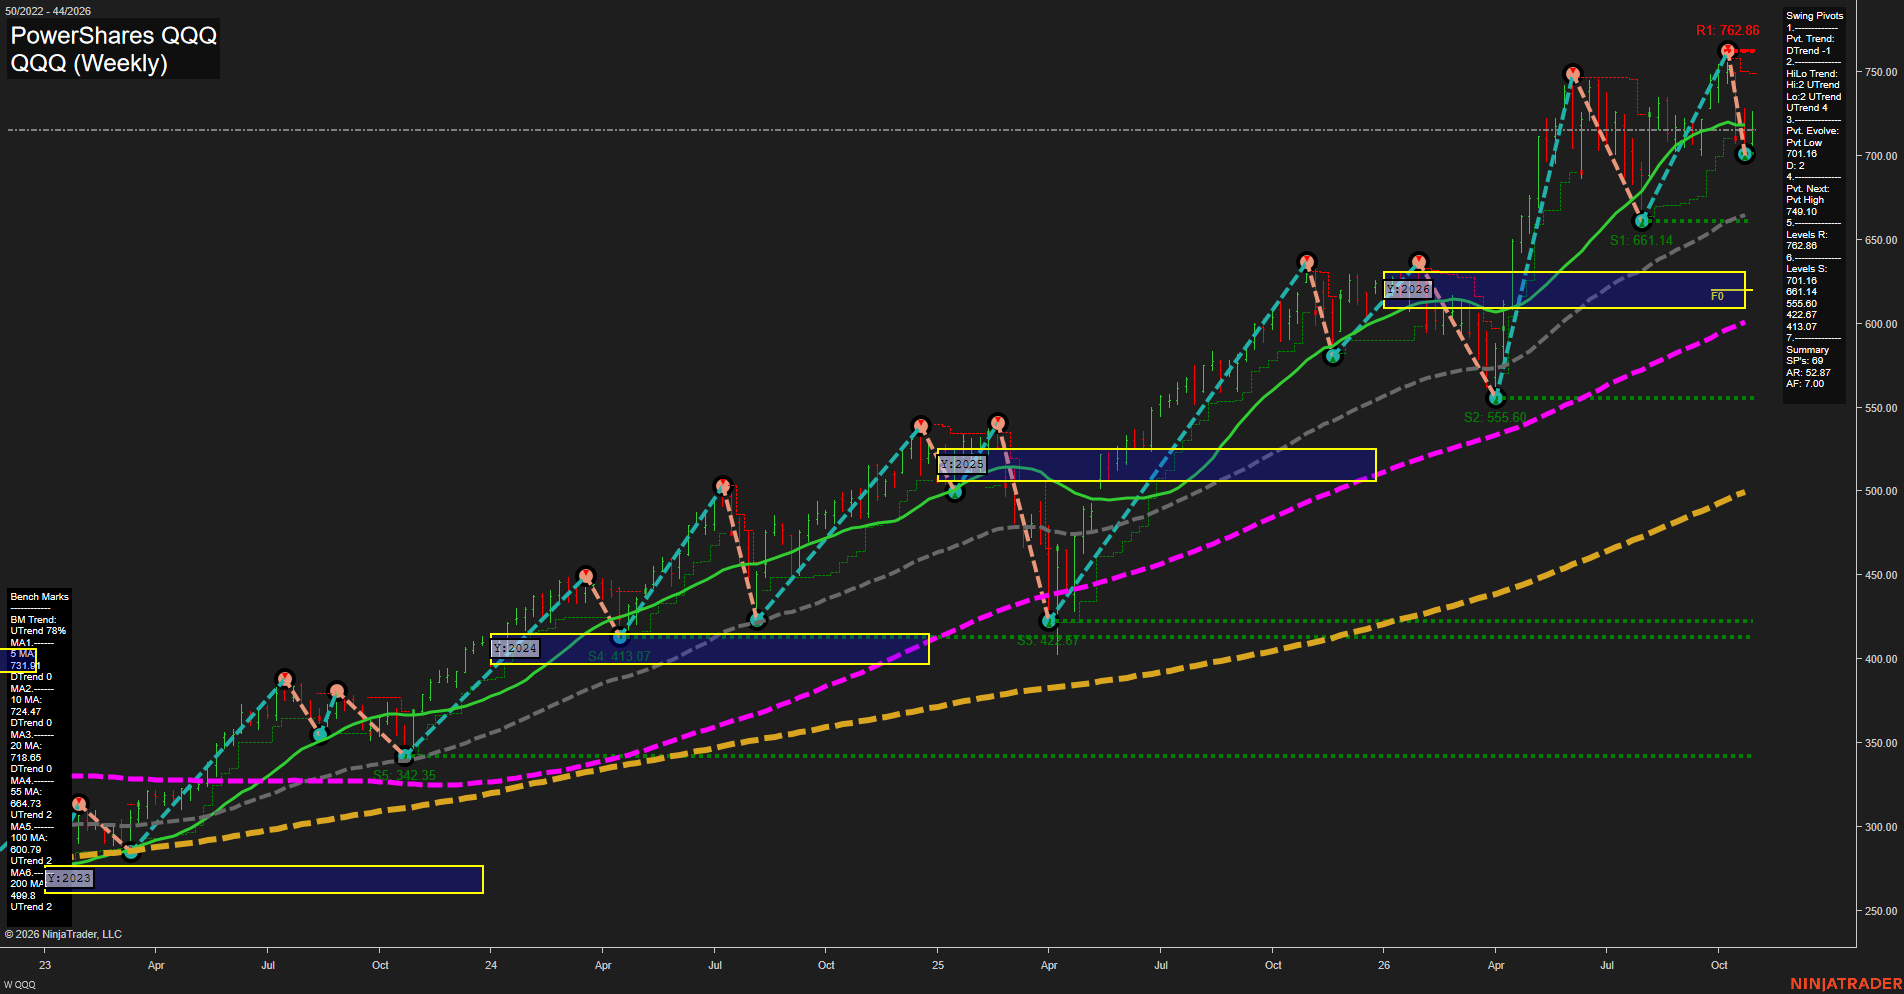
Overall Rating
- Short-Term: Bearish
- Intermediate-Term: Bullish
- Long-Term: Bullish.
Key Insights Summary
QQQ, as a directional proxy for NQ futures swing conditions, is in a sharp short-term retracement from the 762.86 pivot high. Price is below the declining 5-, 10-, and 20-week benchmarks, while the pivot structure remains in a short-term DTrend. The larger weekly structure remains constructive: the HiLo trend is up, price holds above rising 55-, 100-, and 200-week benchmarks, and the yearly grid remains positive above its NTZ. The 701.18 evolving pivot low is the immediate swing reference, with 749.10 and 762.86 defining the overhead recovery and prior-high zone; 661.14 is the first major lower support reference.
View charts on: AlphaWebTrader HTF Charts
NQ Weekly View
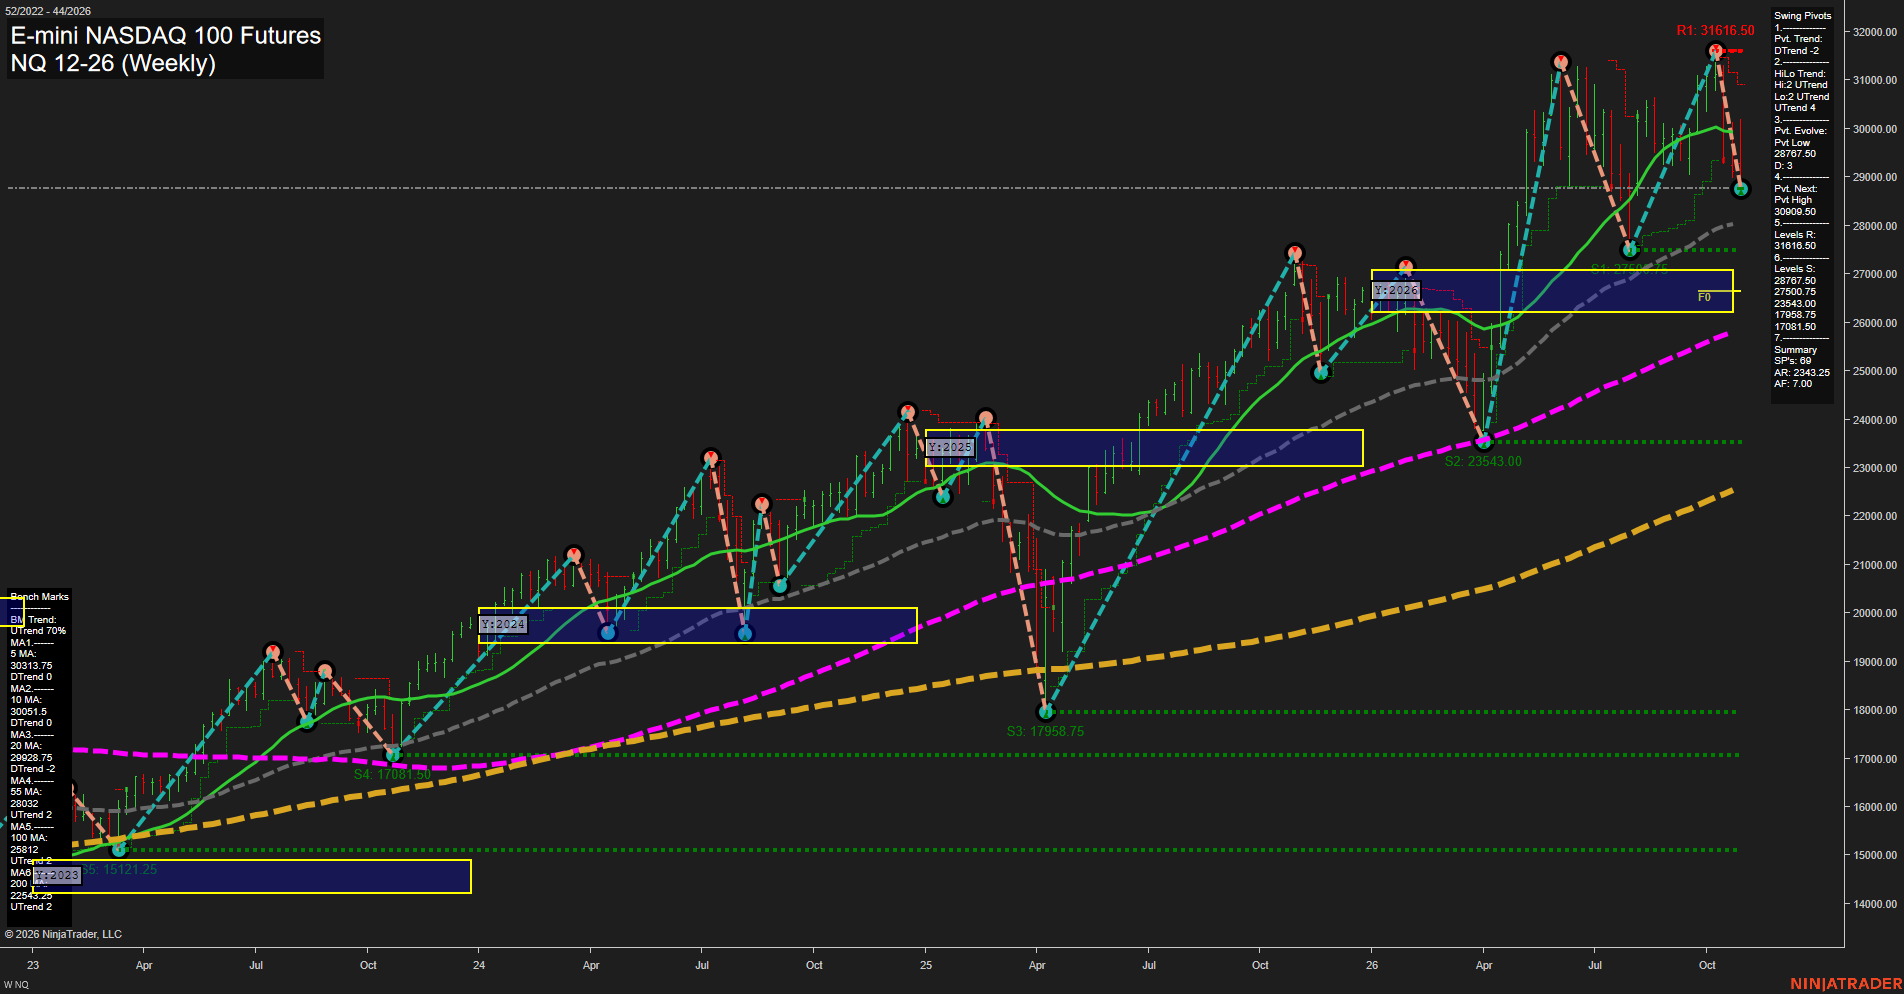
Overall Rating
- Short-Term: Bearish
- Intermediate-Term: Neutral
- Long-Term: Bullish.
Key Insights Summary
Price has produced a fast, large-bar selloff from the 31616.50 pivot high and has shifted the short-term pivot structure to DTrend. The decline is below the weekly and monthly F0%/NTZ areas and below the 5, 10, and 20-week benchmarks, confirming a short-term countertrend retracement within the broader yearly uptrend. The 28767.50 pivot low is the immediate swing reference, with 27500.75 the next major support. Intermediate structure remains mixed because the HiLo trend and 55-week benchmark remain upward, while the monthly grid is deeply negative. The long-term structure remains constructive above rising 100- and 200-week benchmarks, but the recent reversal from the 31616.50 high reflects elevated volatility and a pronounced lower-high correction phase.
View charts on: AlphaWebTrader HTF Charts
USO Weekly View
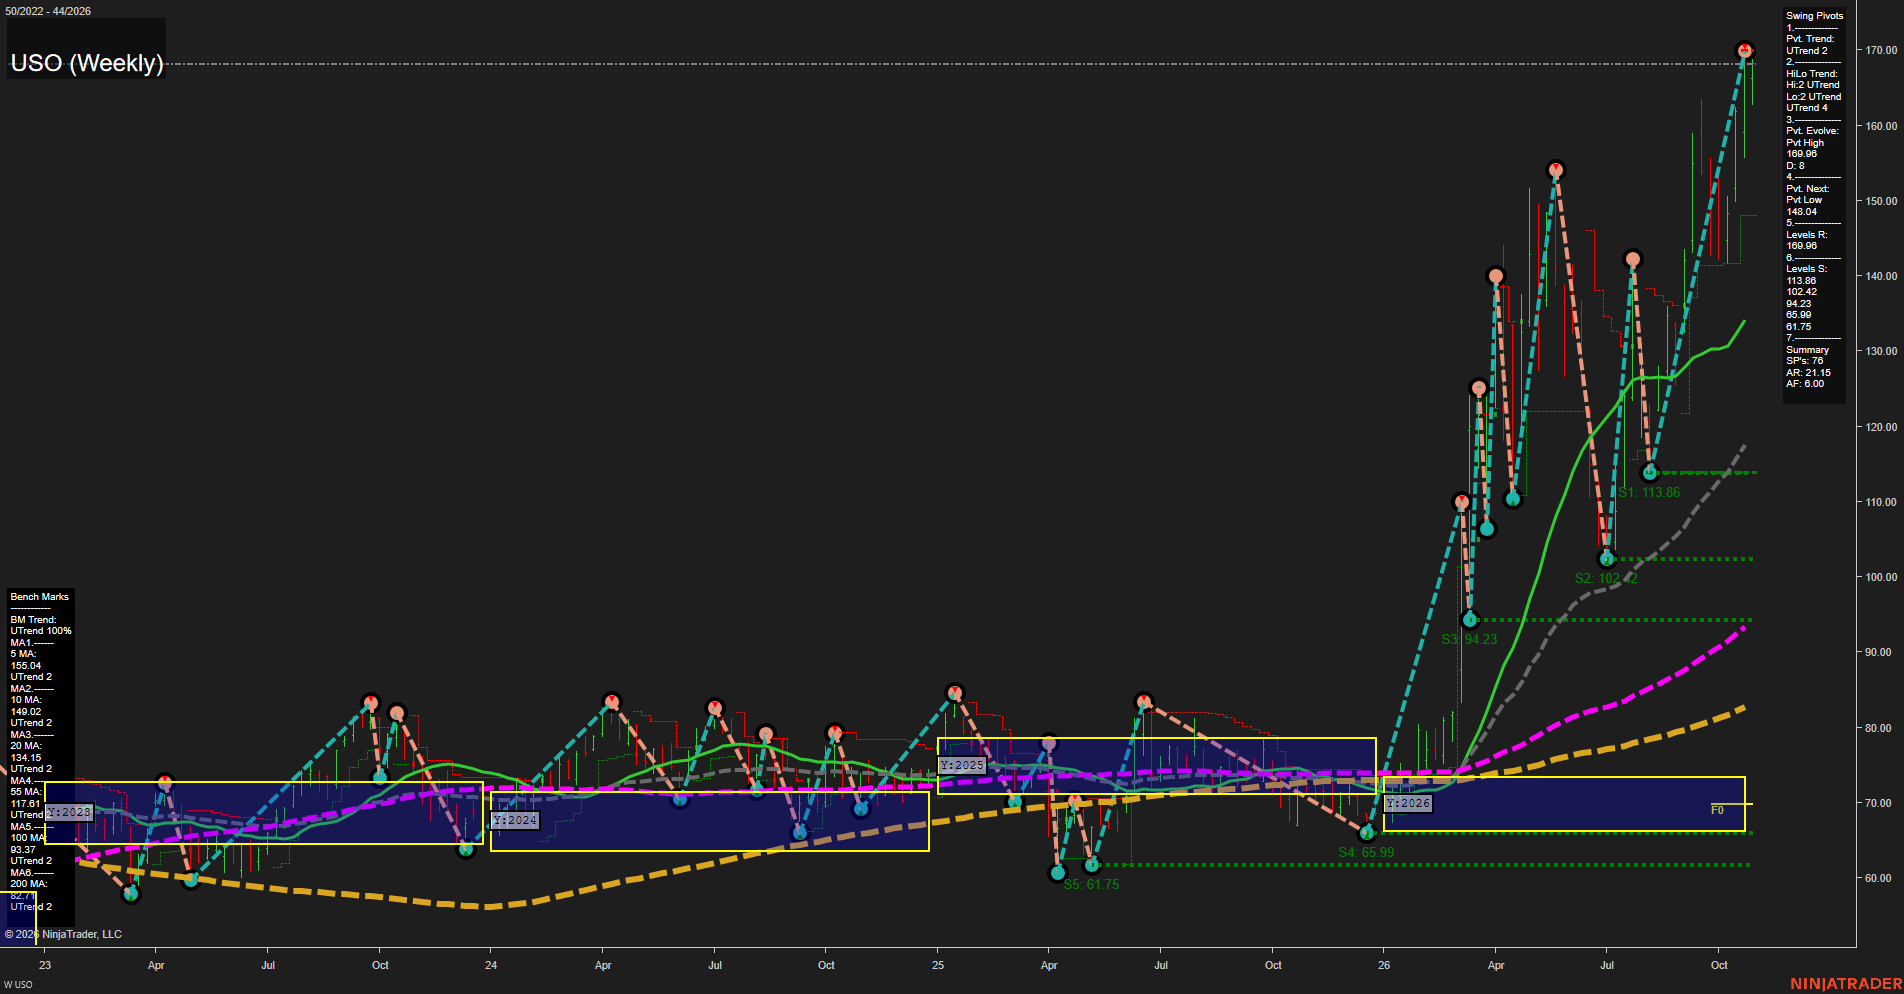
Overall Rating
- Short-Term: Bullish
- Intermediate-Term: Bullish
- Long-Term: Bullish.
Key Insights Summary
USO reflects a powerful crude-oil futures-style momentum expansion, with large weekly bars, a fast ascent, and price establishing a new pivot high at 169.98. The swing structure is decisively constructive: both pivot and HiLo trends are rising, while all benchmark averages are rising and widely separated beneath price. The advance is extended above the weekly, monthly, and yearly fib-grid balance areas, characterizing a strong directional price cycle rather than consolidation. The 148.04 pivot-next level defines the nearest major swing-reversal reference, with 139.86 the next structural support beneath it. The current pattern is a high-volatility breakout continuation, with momentum notably stronger than the underlying moving-average trend.
View charts on: AlphaWebTrader HTF Charts
CL Weekly View
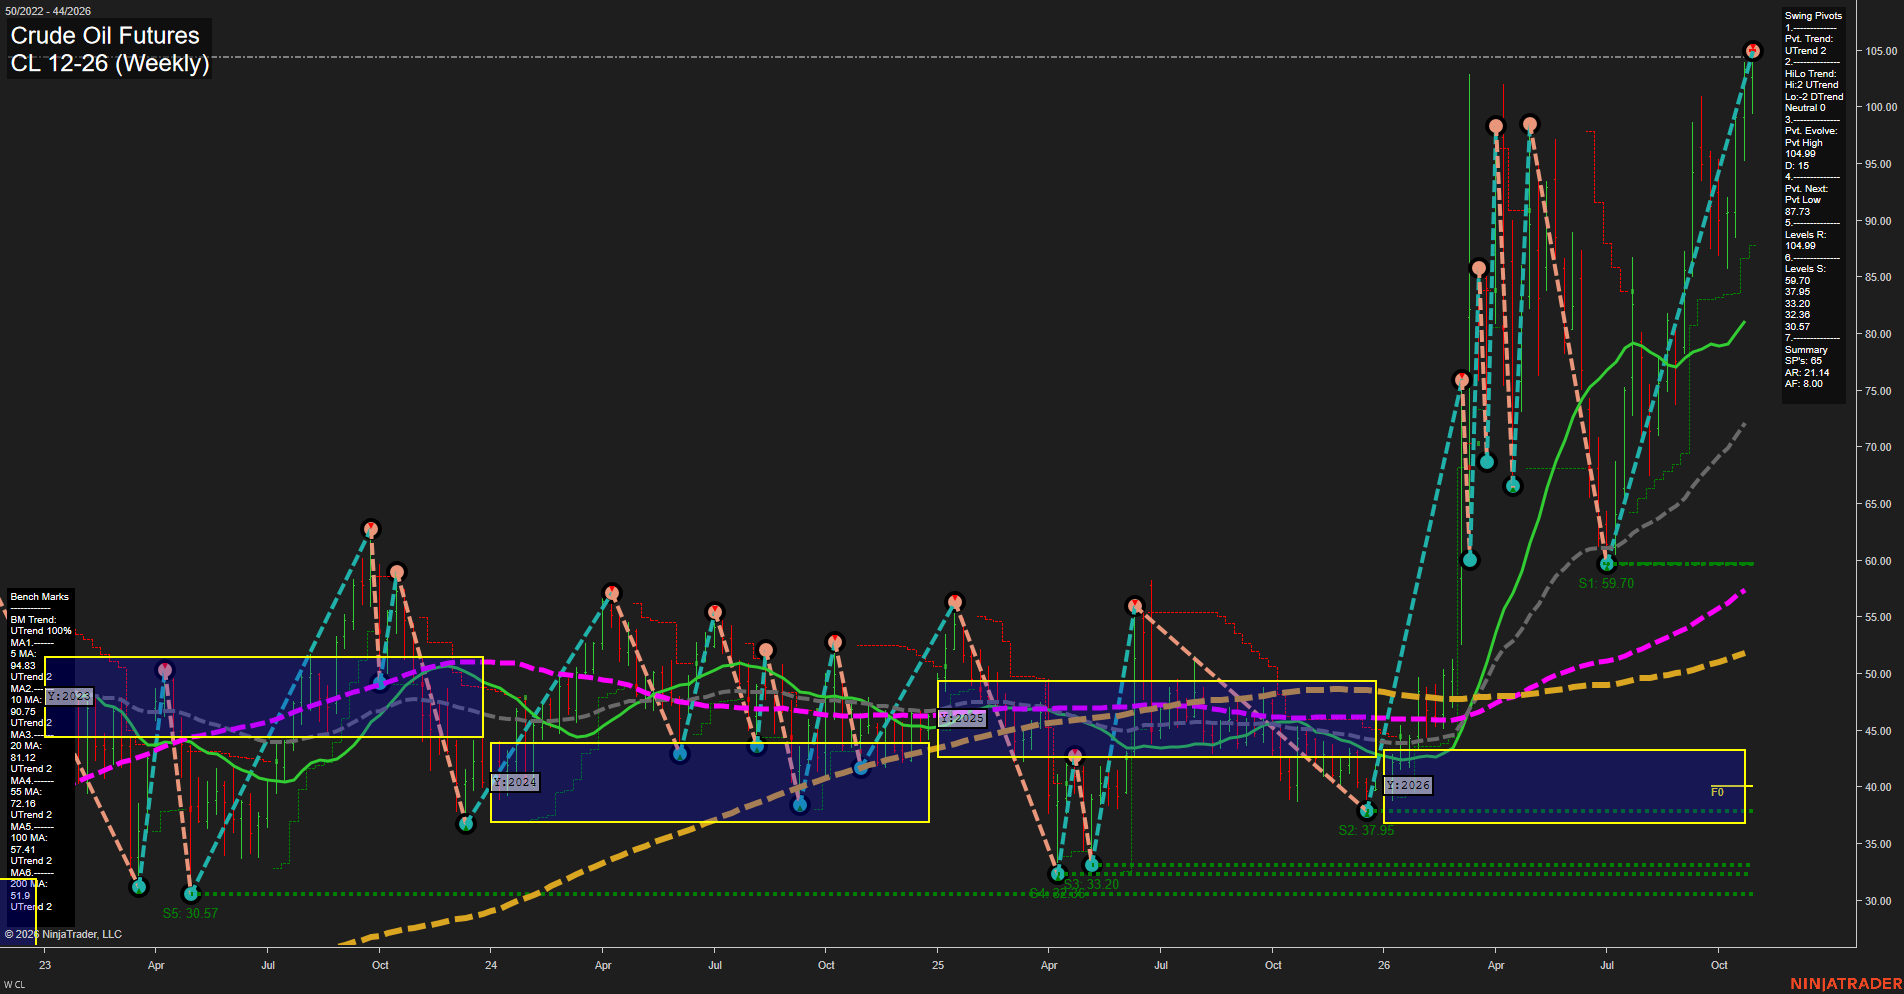
Overall Rating
- Short-Term: Bullish
- Intermediate-Term: Bullish
- Long-Term: Bullish.
Key Insights Summary
Price is in a strong upside expansion, printing near 105.00 after a sharp recovery from the July pivot low near 59.70. The short-term pivot trend has turned higher and price is above every benchmark average, with the moving-average stack positively aligned from 5 through 200 periods. The intermediate HiLo pivot structure remains classified as DTrend, reflecting the prior broad swing volatility, but the monthly and yearly Fib-grid readings and rising benchmark structure show a dominant bullish trend across the larger cycle. The 104.99 pivot-high area is the immediate breakout reference, while 87.73 defines the next pivot-reversal level. Large weekly bars and fast momentum characterize a high-energy, extended rally phase rather than a quiet consolidation.
View charts on: AlphaWebTrader HTF Charts
GLD Weekly View
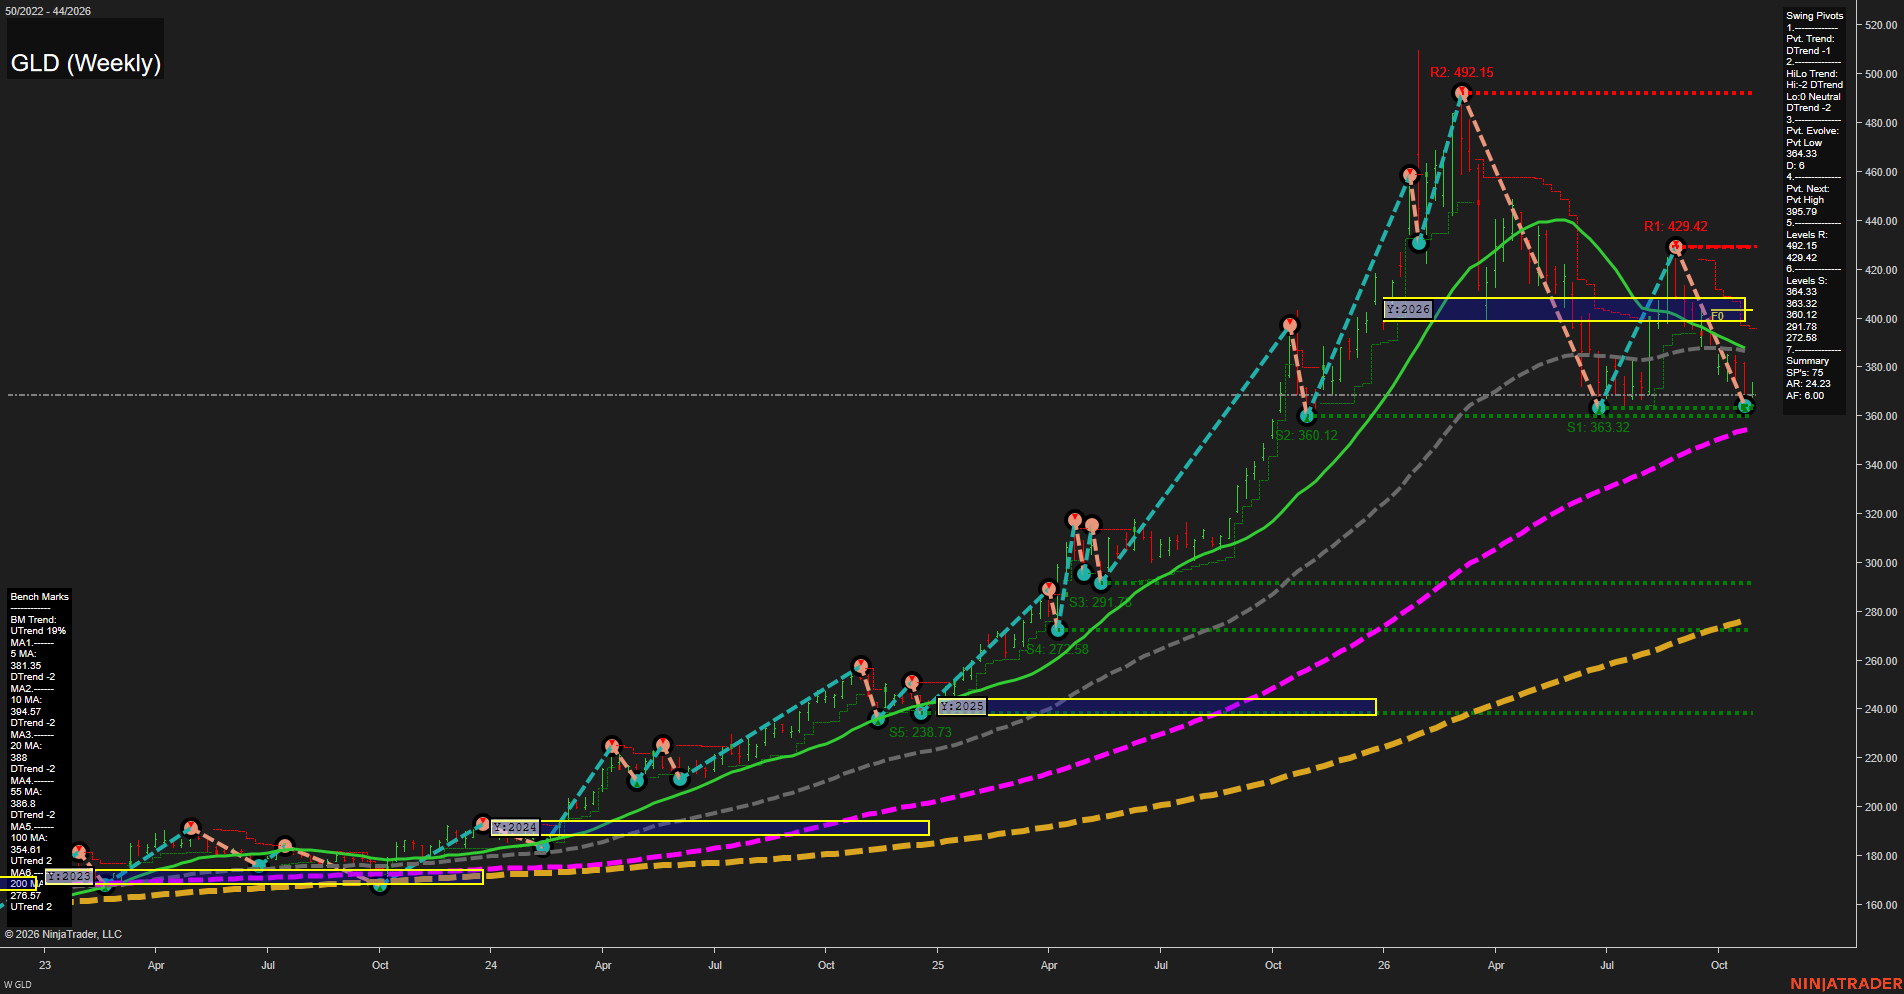
Overall Rating
- Short-Term: Bearish
- Intermediate-Term: Bearish
- Long-Term: Bullish.
Key Insights Summary
GLD reflects a sharp weekly countertrend decline from the 429.42 pivot high, with price beneath the declining 5, 10, 20, and 55-period benchmarks and both pivot trend measures in DTrend. The 364.33 to 360.12 support cluster is the immediate swing reference area, while 395.79 is the pivot-reversal threshold and 429.42 remains the major overhead swing resistance. From a futures swing-trader perspective, the short- and intermediate-term structure is characterized by lower highs, accelerating downside momentum, and elevated volatility, while the longer-term structure remains constructive because price is still above rising 100- and 200-period benchmarks.
View charts on: AlphaWebTrader HTF Charts
GC Weekly View
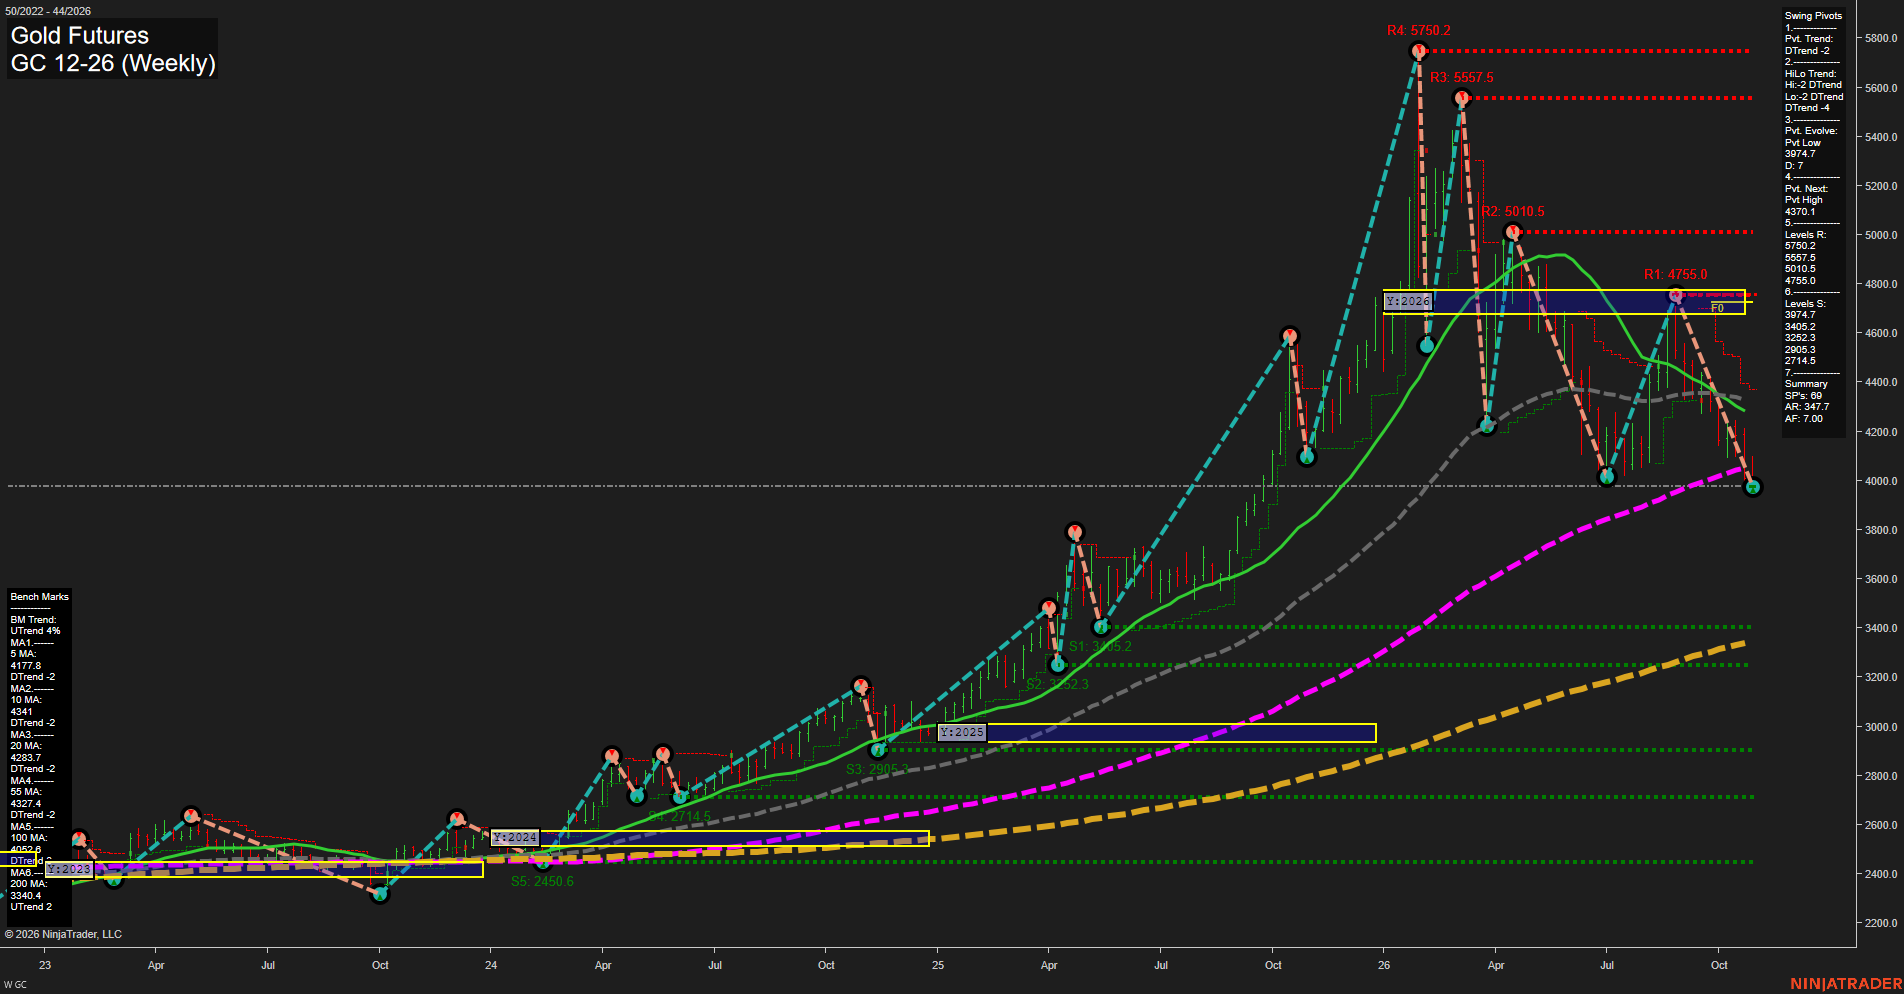
Overall Rating
- Short-Term: Bearish
- Intermediate-Term: Bearish
- Long-Term: Bearish.
Key Insights Summary
Price has completed a sharp weekly selloff from the 4755.0 pivot high and is testing the active 3997.4 pivot-low support. The short and intermediate structures remain decisively bearish: price is below the weekly, monthly, and yearly F0% areas, below every benchmark through the 100-period average, and both pivot trends are in DTrend. The decline has fast momentum and large weekly bars, reflecting elevated volatility and a strong lower-high/lower-low sequence. The 3997.4 level is the immediate structural reference, while 4370.1 defines the opposing pivot-reversal threshold. The 200-period benchmark remains rising, preserving a longer-cycle base beneath the current correction, but the yearly grid and 100-period trend show that the broader advance remains under sustained retracement pressure.
View charts on: AlphaWebTrader HTF Charts
ZB Weekly View
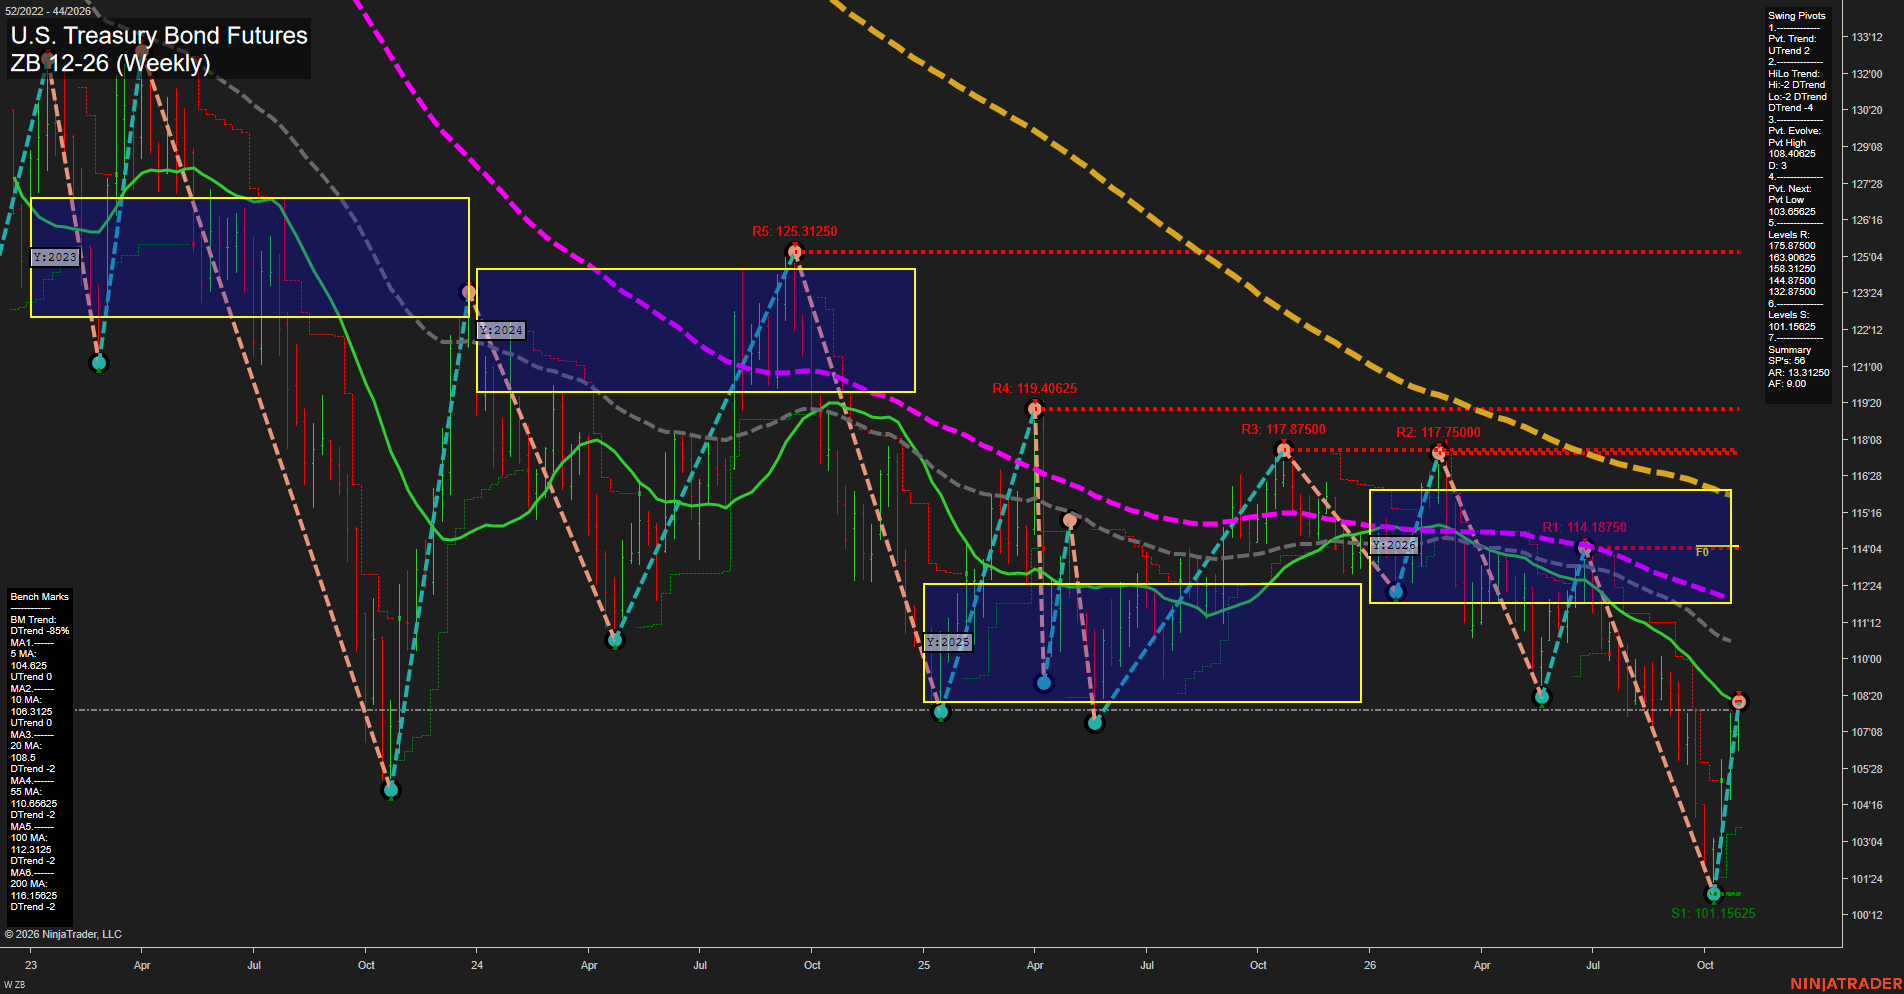
Overall Rating
- Short-Term: Bullish
- Intermediate-Term: Bearish
- Long-Term: Bearish.
Key Insights Summary
ZB has produced a sharp short-term rebound from the 101.15625 swing-low area, with price above the rising 5- and 10-week benchmarks and the weekly fib structure turning higher. The intermediate swing sequence remains bearish, however, as price is testing the falling 20-week benchmark near 108.5 while remaining below the declining 55-, 100-, and 200-week averages. The market structure reflects a fast counter-trend recovery within a broader multi-year downtrend; 108.0625 is the active pivot-high reference and 103.65625 defines the opposite-pivot reversal threshold.
View charts on: AlphaWebTrader HTF Charts
Index ETFs
Negative confluence: average WOC% -0.48% from the week open and WNC% -0.14% versus the prior weekly close. Two of five index ETFs gained from the open, led by IWM, while QQQ lagged; IJH led versus the prior close, ahead of IWM, while SPY and DIA declined on both comparisons. IWM nevertheless closed below weekly VWAP and its falling near-term average.