Ahead of ISM Services (10:00 ET), crude inventories (10:30 ET) and RIOT earnings before open, S&P 500 and Nasdaq futures retain bearish daily trends.
Fundamentals: Wednesday’s agenda features ISM Services PMI at 10:00 ET and crude oil inventories at 10:30 ET. U.S. stocks recovered early losses after Democrats won both chambers of Congress, while AI and policy-sensitive shares diverged. Gold rose as Treasury yields declined. Tomorrow, Thursday, brings unemployment claims at 08:30 ET; Friday’s jobs report remains a risk for interest-rate repricing.
Technicals: Ahead of the NYSE open, S&P 500 and Nasdaq futures retain bearish near-term daily structures, with Nasdaq testing its 200-day average. The Dow’s rebound remains within a daily downtrend, while midcaps and small caps show stronger recoveries. The DAX is bullish across time horizons and approaching prior highs. Longer-term US equity trends remain broadly constructive despite the correction.
Pre-Market Trading 360° view Market Radar of: holidays, earnings, eco-news, market-news summary, news sentiment, prior session major ETFs, MAG7, Higher Time Frame Analysis Indices Futures Summary, and E-mini S&P500, Nasdaq 100, NYMEX Crude, Gold Futures Daily Chart analysis.
As of: November 4, 2026 07:16 CT
Earnings Radar
Monitoring for earnings releases by the Magnificent 7, AI-tech-related firms, and major financial institutions.
| Date/Day | Impact | Company / Symbol | Time | EPS | Revenue | ||||
|---|---|---|---|---|---|---|---|---|---|
| 2026-11-04 – Wednesday | Medium | Riot Platforms (RIOT) | Before open |
|
| ||||
| 2026-11-05 – Thursday | Medium | Microchip Technology (MCHP) | After close |
|
|
Conclusion: MCHP’s November 5 after-market earnings release is the upcoming semiconductor-sector event relevant to tech-sensitive index futures. RIOT is scheduled before market open today, November 4; the supplied data contain no actual results or publication confirmation.
For full details visit: Yahoo Earnings Calendar
EcoNews Radar U.S. Events
| Date | Impact | Event, Prev, Forecast, Actual | Info |
|---|---|---|---|
| 2026-11-04 Wednesday 10:00 | Medium | ISM Services PMI Prev: 54.9 Forecast: 54.9 Actual: — | Surveys service-sector activity, including business conditions, orders and employment. Index futures traders monitor it for signals about economic momentum, price pressures and the interest-rate outlook. |
| 2026-11-04 Wednesday 10:30 | High | Crude Oil Inventories Prev: -1.9M Forecast: — Actual: — | Tracks weekly changes in U.S. commercial crude stockpiles. Traders monitor it for petroleum supply-demand signals that can influence energy shares and inflation expectations. |
| 2026-11-05 Thursday 08:30 | Medium | Unemployment Claims Prev: 194K Forecast: 197K Actual: — | Counts new applications for unemployment insurance, providing a timely gauge of layoffs. Traders watch for shifts in labor demand that may affect growth and monetary-policy expectations. |
| 2026-11-06 Friday 08:30 | High | Average Hourly Earnings m/m Prev: 0.1% Forecast: 0.3% Actual: — | Measures monthly changes in average hourly pay for private-sector workers. Traders monitor wage growth for implications for household spending, business margins and inflation pressures. |
| 2026-11-06 Friday 08:30 | High | Non-Farm Employment Change Prev: 29K Forecast: 63K Actual: — | Measures the monthly change in payroll jobs outside agriculture. Traders watch hiring momentum to assess economic growth and potential implications for interest rates and corporate earnings. |
| 2026-11-06 Friday 08:30 | High | Unemployment Rate Prev: 4.2% Forecast: 4.2% Actual: — | Measures the share of the labor force without work and actively seeking employment. Traders monitor labor-market slack for signals about consumer demand and monetary policy. |
| 2026-11-06 Friday 10:00 | Medium | Prelim UoM Consumer Sentiment Prev: 46.3 Forecast: 47.8 Actual: — | Provides an early survey reading of consumers’ views on personal finances and economic conditions. Traders watch it for clues about spending confidence and the outlook for consumer-facing businesses. |
| 2026-11-06 Friday 10:00 | Medium | Prelim UoM Inflation Expectations Prev: 4.7% Forecast: — Actual: — | Reports consumers’ expected inflation over the coming year. Traders monitor it for signs of changing price expectations that may influence wage demands and the monetary-policy outlook. |
Summary: The calendar centers on U.S. growth, labor-market conditions and inflation signals, alongside an energy supply update.
Conclusion: The highest concentration of high-impact releases falls on Friday’s employment report.
NYSE Session Open Gap Radar
Session gaps compare the predicted opening price with the prior session’s close to predict the upcoming session’s opening gap pattern.
| Instrument | Gap | Prior Close | Predicted Open | Gap % |
|---|---|---|---|---|
| GLD | ▲ OGU | 359.26 | 369.70 | ▲ +2.91% |
| DIA | ▲ OGU | 517.06 | 526.32 | ▲ +1.79% |
| IWM | ▲ OGU | 279.79 | 284.30 | ▲ +1.61% |
| IJH | ▲ OGU | 74.13 | 75.15 | ▲ +1.38% |
| SPY | ▲ OGU | 754.35 | 761.12 | ▲ +0.90% |
| QQQ | ▼ IGU | 685.28 | 686.42 | ▲ +0.17% |
| TLT | ▼ OGD | 81.11 | 80.49 | ▼ -0.76% |
| USO | ▼ OGD | 158.17 | 154.59 | ▼ -2.26% |
Before the session opens, the table shows the predicted opening price and gap. Once the session opens, it uses the recorded opening price.
Glossary: IGU — Inside Gap Up: above the prior close, within the prior session’s range. IGD — Inside Gap Down: below the prior close, within that range. OGU — Outside Gap Up: above the prior session’s high. OGD — Outside Gap Down: below the prior session’s low.
As of: 2026-11-04 07:16 CT. Predicted gaps are best estimates as of publication and may change before the regular-session open, particularly when the session is still some time away.
Market News Summary:
U.S. stocks reversed early losses after Democrats won both chambers of Congress, while election-related sector rotation and AI earnings produced divergent stock moves.
Primary Drivers & Risks:
- Primary Driver: Post-election rally and strong AI earnings
- Primary Risk: Regulatory uncertainty and rate-hike repricing
Tone:
Positive at the index level, with pronounced sector and stock divergence.
Data, Market and System
Geopolitical:
- Democrats won control of the House and Senate, changing the balance of power in Washington and intensifying scrutiny of AI regulation and corporate expansion plans.
- Iran-related concerns remained part of the market backdrop alongside AI and debt worries.
Gold / Metals:
- Gold prices rose as prospects for political gridlock lowered Treasury yields.
Fed / Financials:
- Treasury yields declined as markets assessed the prospect of post-election political gridlock.
- Friday’s jobs report was identified as a catalyst for repricing the number and timing of further Fed rate hikes if employment data run hot.
- The average conforming 30-year mortgage rate fell for a third consecutive week to 7.3% from 7.37%, while refinance demand remained 60% below its year-earlier level.
Macro / Other:
- Healthy consumer spending and robust business investment, particularly in AI infrastructure, supported U.S. economic resilience.
- Alphabet expanded voluntary employee buyouts to five more countries as it controlled operating costs alongside heavy AI infrastructure spending.
- Amazon’s capital-expenditure funding requirements and Alphabet’s search-growth deceleration remained counterweights to strong cloud performance.
Conclusion:
The election outcome and strong AI earnings dominated the equity backdrop. Broad stocks recovered early losses, while policy-sensitive shares diverged sharply.
Lower Treasury yields accompanied gains in gold, while Friday’s jobs report remained a rate-repricing risk. AI infrastructure scrutiny and substantial capital-spending demands added company-specific pressures.
Market News Sentiment
Sentiment Bias shows the balance of positive and negative news coverage sampled from 2026-11-03 08:21 to 2026-11-04 08:12 ET, covering stocks, energy and gold.
▼ Market news
- Bias
- ▼ -1.46%
- Articles
- 206
- Positive
- ▲ 27.67%
- Neutral
- — 43.20%
- Negative
- ▼ 29.13%
▲ GLD / Gold
- Bias
- ▲ +16.67%
- Articles
- 18
- Positive
- ▲ 50.00%
- Neutral
- — 16.67%
- Negative
- ▼ 33.33%
Sentiment Summary: Gold coverage leaned positive (50% positive versus 33% negative), as November 4 reports linked the post-midterm rebound above $4,000 to a weaker dollar and falling Treasury yields following reported Democratic congressional gains; stocks also rallied amid expectations of gridlock. This reversed November 3 pressure after stronger-than-expected U.S. labor-market and factory-orders data lifted yields and reinforced expectations of further Federal Reserve tightening. Strong central-bank buying supported the positive tone, while Friday’s upcoming U.S. jobs report remained a counterweight.
Conclusion: The reported equity rally coincided with gold strength, combining lower-yield support with continued safe-haven demand.
▼ USO / Oil
- Bias
- ▼ -37.50%
- Articles
- 16
- Positive
- ▲ 12.50%
- Neutral
- — 37.50%
- Negative
- ▼ 50.00%
Sentiment Summary: Oil coverage leaned negative (50% negative versus 13% positive), reflecting November 3 declines tied to potential U.S.-Iran diplomacy and profit-taking; reports linked cheaper crude to easing inflation concerns and support for stocks alongside a chip rebound. Oil rose early November 4 as investors assessed U.S. midterm results and Iran risks, counterbalancing the selloff alongside OPEC+ maintaining December output and 2 million barrels per day of cuts. Reported threats to Strait of Hormuz shipping complicated the supply outlook ahead of the November 4 EIA report.
Conclusion: For indices, oil-related inflation relief coexists with unresolved geopolitical supply risk.
Glossary: Sentiment Bias = (positive articles − negative articles) ÷ total articles × 100. It ranges from −100% negative to +100% positive. A reading near zero indicates little directional bias. Neutral articles reduce the score’s strength. ▲ positive; ▼ negative; — balanced. These readings describe news coverage, not market-price direction.
Market Technical Analysis
Analysis of VIX volatility, prior-session major ETFs and mega-cap tech stocks, and real-time futures snapshots and higher-time-frame analysis.
VIX — Market Fear Gauge Daily
| Level | Open | High | MaxVix | Low | MinVix | DNC% | DOC% | VR | MaxVR | MinVR |
|---|---|---|---|---|---|---|---|---|---|---|
| 20.82 | 20.95 | 21.06 | 23.93 | 20.29 | 14.98 | -1.56% | -0.62% | 5.22 | 34.10 | -0.20 |
VIX fell 0.62% from the session's opening level. VIX fell 1.56% versus the previous session close. Expected volatility eased from the period open. VIX is 65.3% up the recent 15-session range (14.98–23.93), in the 60–70% band.
VR: ATN Volatility Ratio (VR): 5.22 – Stocks rose while expected volatility eased. VR is in the lower part of its preceding 15-session VR range (-0.20 to 34.10), in the 10–20% band. VR fell 18.90 points from the previous session, a large shift relative to that range.
Range lookback: preceding 15 completed sessions.
Major ETFs and Mega Cap Tech Stocks
- Wall Street edged higher Wednesday after reversing sharp early losses following Democrats’ midterm gains.
- AI data-center stocks declined as renewable-energy stocks advanced following the election results.
- Nvidia rose as investors focused on strong AI earnings despite concerns about restrictions on data-center construction.
- AMD rallied after strong earnings, while SpaceX and Tesla fell more than 7.5% and 5.5%, respectively, in premarket trading amid regulatory and merger uncertainty.
- AWS recorded six consecutive quarters of accelerating revenue growth, while Microsoft reported 19% revenue growth and 48% Azure growth.
- Apple posted record revenue and continued generating strong free cash flow, alongside $89.7 billion in purchase obligations concentrated within a year.
- The S&P 500 finished October modestly lower and broke more sharply below its dividend-based mean trendline on the month’s final trading day.
ETF, Mag7, and Cross-Market ETF prior day Insights
Overall Tone
The November 3, 2026 daily session showed a cautiously positive risk tone from the open, with nine advances, six declines and one flat result, alongside broader gains versus the prior close.
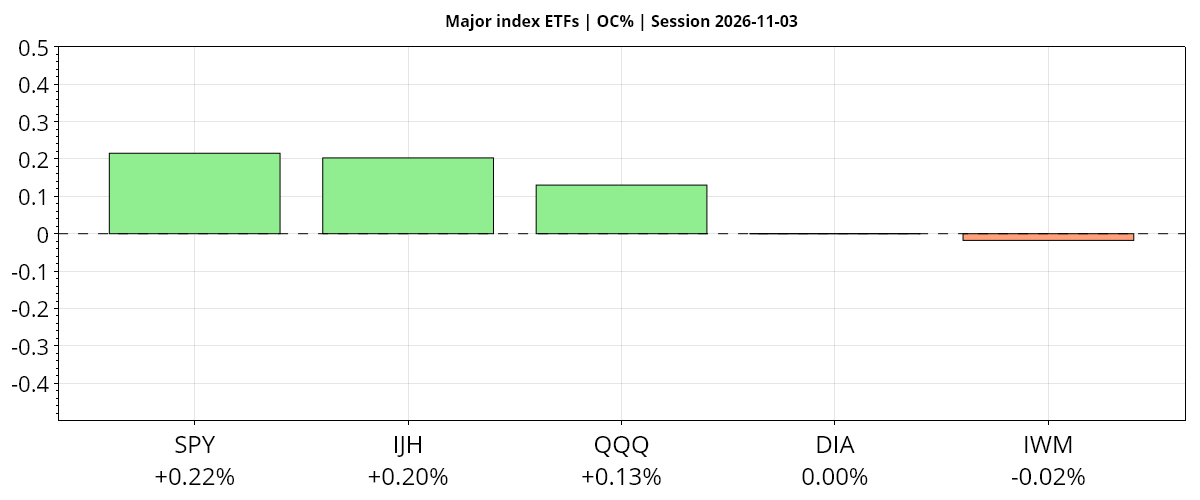
| Instrument | Bias | Date | DNC% | DOC% | O | H | L | C | VWAP | Vol |
|---|---|---|---|---|---|---|---|---|---|---|
| ▲ SPY | ▲ ▲ ▼ | 2026-11-03 | ▲ +0.30% | ▲ +0.22% | 752.73 | 757.07 | 752.39 | 754.35 | ▼ 754.66 | 32,026,688 |
| ▲ IJH | ▲ ▲ ▼ | 2026-11-03 | ▲ +0.28% | ▲ +0.20% | 73.98 | 74.94 | 73.92 | 74.13 | ▼ 74.42 | 8,933,755 |
| ▲ QQQ | ▲ ▲ ▼ | 2026-11-03 | ▲ +0.62% | ▲ +0.13% | 684.39 | 688.69 | 683.18 | 685.28 | ▼ 685.83 | 35,228,906 |
| ― DIA | ▼ ― ▲ | 2026-11-03 | ▼ -0.44% | ― 0.00% | 517.06 | 518.38 | 515.19 | 517.06 | ▲ 517.02 | 2,958,245 |
| ▼ IWM | ▲ ▼ ▼ | 2026-11-03 | ▲ +0.23% | ▼ -0.02% | 279.84 | 282.00 | 279.34 | 279.79 | ▼ 280.44 | 17,075,427 |
| AVG/Sum | — | — | +0.20% | +0.11% | — | — | — | — | — | 96,223,021 |
Index ETFs
Positive confluence: average DNC% +0.20% versus the prior close, DOC% +0.11% from the open. SPY led three open-to-close gainers, followed by IJH; DIA was flat and IWM nearly flat. QQQ led versus the prior close while DIA lagged; SPY and QQQ remained in near-term downtrends and below VWAP.
SPY · D:2026-11-03 NC% ▲ +0.30% OC% ▲ +0.22%
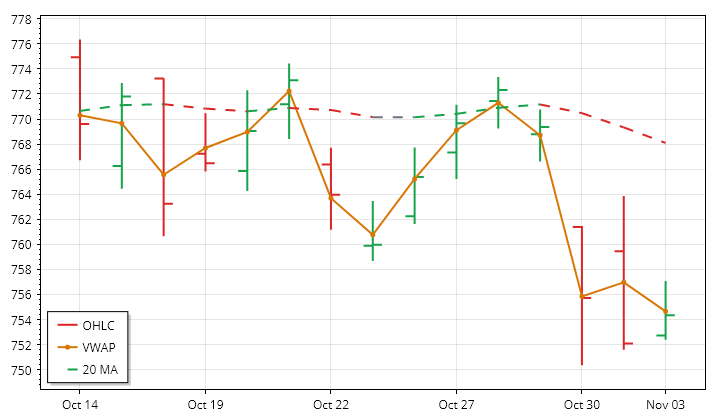
SPY – S&P 500 Technicals Summary
SPY’s completed daily session on November 3 closed at 754.35, up 0.30% from the prior close and 0.22% from the open. The small opening gap up remained unfilled, but the inside bar kept the advance within the previous day’s range. A finish slightly below session VWAP also qualified the gain: price improved from the open without closing above the day’s traded average.
Near- and intermediate-term averages remained falling above price, while the far-term average continued rising below it. The setup therefore retained shorter- and intermediate-term weakness within an intact longer-term uptrend. The prior 15 sessions’ price trend was also downward. The latest below-average range and volume contrasted with expanding ranges and increasing activity across that lookback. PSAR and ATR-median stayed bearish. A next-session high above 771.1175 would conditionally trigger a bullish PSAR reversal.
S&P 500 News and Fundamentals
The S&P 500 finished both September and October 2026 lower, with declines of less than 1% in each month. This marked only the 17th instance of consecutive September and October losses since 1950.
IJH · D:2026-11-03 NC% ▲ +0.28% OC% ▲ +0.20%
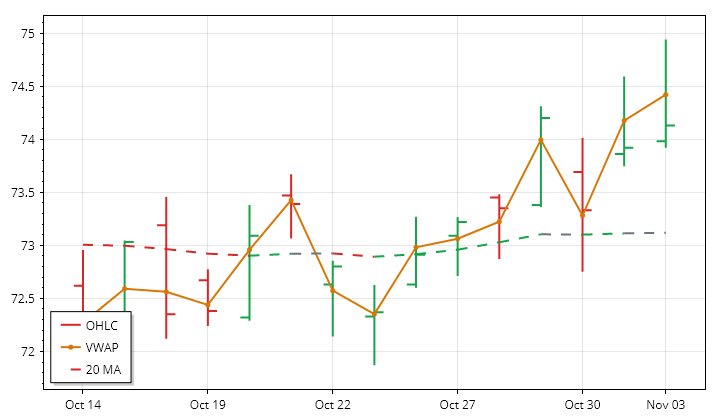
IJH – Mid Cap Technicals Summary
IJH’s completed daily session on November 3 closed at 74.13, gaining 0.28% from the prior close and 0.20% from the open. A higher high and higher low gave the day an upward bias, but the close remained within the previous day’s range. It also finished below session VWAP, showing that the modest gain did not translate into a strong position relative to the day’s traded average.
Near- and far-term trends were rising, while the intermediate horizon remained mixed because price stood above a still-falling average. The prior 15 sessions’ upward price trend had involved substantial back-and-forth movement. This session’s above-average range and volume contrasted with contracting ranges and declining activity across that window. PSAR and ATR-median remained bullish despite the VWAP weakness. A next-session low below 72.8323 would conditionally trigger a bearish PSAR reversal.
QQQ · D:2026-11-03 NC% ▲ +0.62% OC% ▲ +0.13%
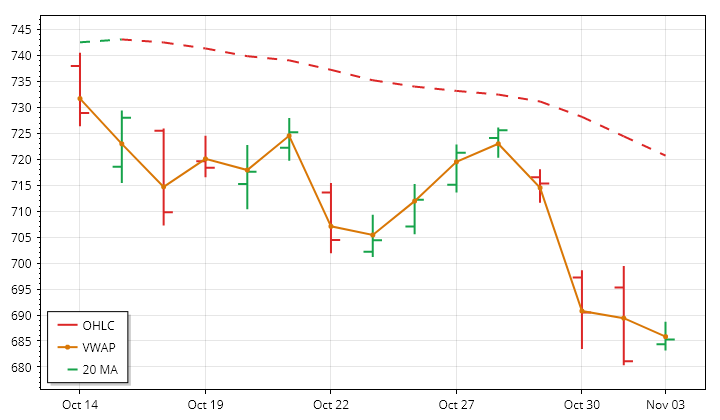
QQQ – Nasdaq 100 Technicals Summary
QQQ’s completed daily session on November 3 rose 0.62% from the prior close to 685.28, but gained only 0.13% from the open. The opening gap up remained unfilled. An inside bar kept trading within the previous day’s range, while a close near the session low and slightly below VWAP tempered the positive return. The session showed limited additional progress after the opening uplift.
Near- and intermediate-term trends remained down, with price below falling averages. Price also remained below a rising far-term average, leaving the longer horizon mixed rather than fully bearish. The latest gain contrasted with the downward price trend over the prior 15 sessions. Range was about half average and volume was subdued, opposing that window’s expanding ranges and increasing activity. Both technical measures stayed bearish; a next-session high above 719.4976 would conditionally reverse PSAR upward.
Nasdaq 100 News and Fundamentals
The Nasdaq 100 entered a technical correction after falling more than 10% from its October highs, reaching its lowest level since July 31. A late-session reversal erased earlier gains as semiconductor shares fell sharply. The reported selloff reflected continuing investor concerns about the artificial-intelligence industry.
DIA · D:2026-11-03 NC% ▼ -0.44% OC% — 0.00%
DIA – Dow Jones Technicals Summary
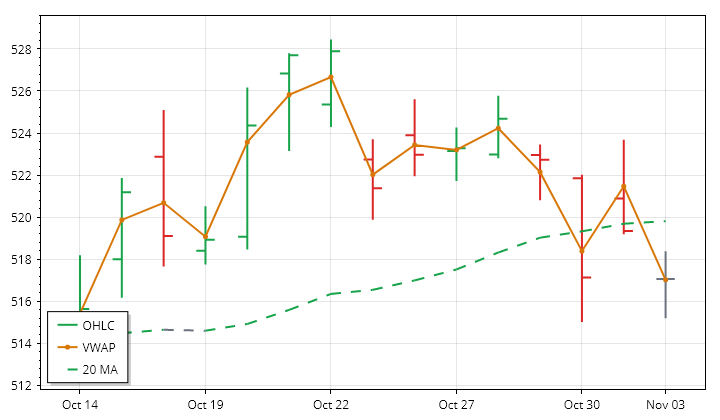
DIA’s completed daily session on November 3 ended at 517.06, down 0.44% from the prior close but unchanged from its opening price. The opening gap down remained unfilled. Trading on both sides of the open produced no net intraday progress, and the close below the prior day’s low preserved the weaker daily structure. Its position just above session VWAP offered only a narrow counterpoint.
Price stayed below rising near- and intermediate-term averages, while the far-term uptrend remained intact. The prior 15 sessions also showed a slight upward price trend, but very little net progress relative to the intervening movement. Below-average range and volume matched that window’s contraction in ranges and declining activity. PSAR remained bearish and ATR-median registered a fresh bearish crossover. A next-session high above 524.1288 would conditionally trigger a bullish PSAR reversal.
IWM · D:2026-11-03 NC% ▲ +0.23% OC% ▼ -0.02%
IWM – Small Cap Technicals Summary
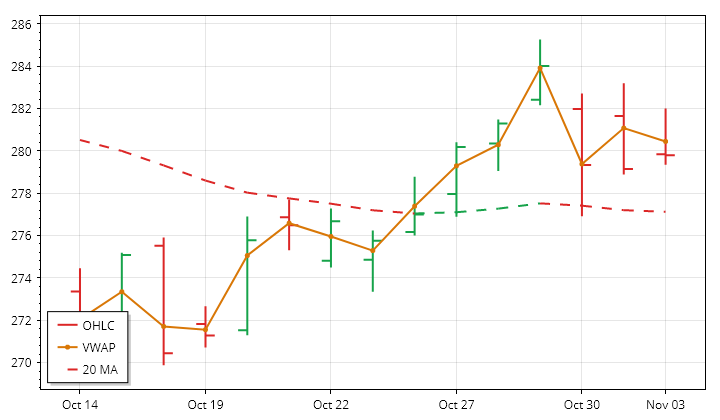
IWM’s completed daily session on November 3 gained 0.23% from the prior close to 279.79 but slipped 0.02% from the open. The unfilled opening gap up accounted for the positive daily return. An inside bar, a finish near the session low and a close below VWAP made the session less constructive than its prior-close gain alone suggested.
Price sat just below a rising near-term average, remained beneath a falling intermediate average, and was below an almost flat but rising far-term average. This mixed-to-weak structure contrasted with the upward price trend over the prior 15 sessions, which had delivered little efficient net progress. Below-average range and volume matched the lookback contraction in both measures. PSAR and ATR-median remained bullish, creating further disagreement with price positioning. A next-session low below 278.58 would conditionally reverse PSAR downward.
| Instrument | Bias | Date | DNC% | DOC% | O | H | L | C | VWAP | Vol |
|---|---|---|---|---|---|---|---|---|---|---|
| ▲ MSFT | ▲ ▲ ▲ | 2026-11-03 | ▲ +2.74% | ▲ +2.35% | 509.00 | 523.44 | 507.82 | 520.99 | ▲ 518.37 | 19,888,415 |
| ▲ AAPL | ▼ ▲ ▲ | 2026-11-03 | ▼ -1.90% | ▲ +1.94% | 325.58 | 334.50 | 325.33 | 331.90 | ▲ 330.81 | 61,289,973 |
| ▲ META | ▲ ▲ ▲ | 2026-11-03 | ▲ +2.36% | ▲ +1.68% | 610.76 | 624.84 | 610.10 | 621.03 | ▲ 619.51 | 13,595,327 |
| ▲ AMZN | ▲ ▲ ▲ | 2026-11-03 | ▲ +2.06% | ▲ +0.84% | 248.59 | 252.45 | 245.88 | 250.69 | ▲ 249.61 | 37,418,750 |
| ▼ GOOGL | ▲ ▼ ▲ | 2026-11-03 | ▲ +0.37% | ▼ -0.07% | 280.23 | 281.61 | 277.20 | 280.03 | ▲ 279.35 | 34,611,661 |
| ▼ NVDA | ▲ ▼ ▼ | 2026-11-03 | ▲ +2.29% | ▼ -0.61% | 207.96 | 209.14 | 205.93 | 206.69 | ▼ 207.57 | 90,056,464 |
| ▼ TSLA | ▼ ▼ ▼ | 2026-11-03 | ▼ -1.32% | ▼ -1.91% | 406.25 | 406.50 | 396.53 | 398.50 | ▼ 399.82 | 26,238,911 |
| AVG/Sum | — | — | +0.94% | +0.60% | — | — | — | — | — | 283,099,501 |
Mag7 Stocks
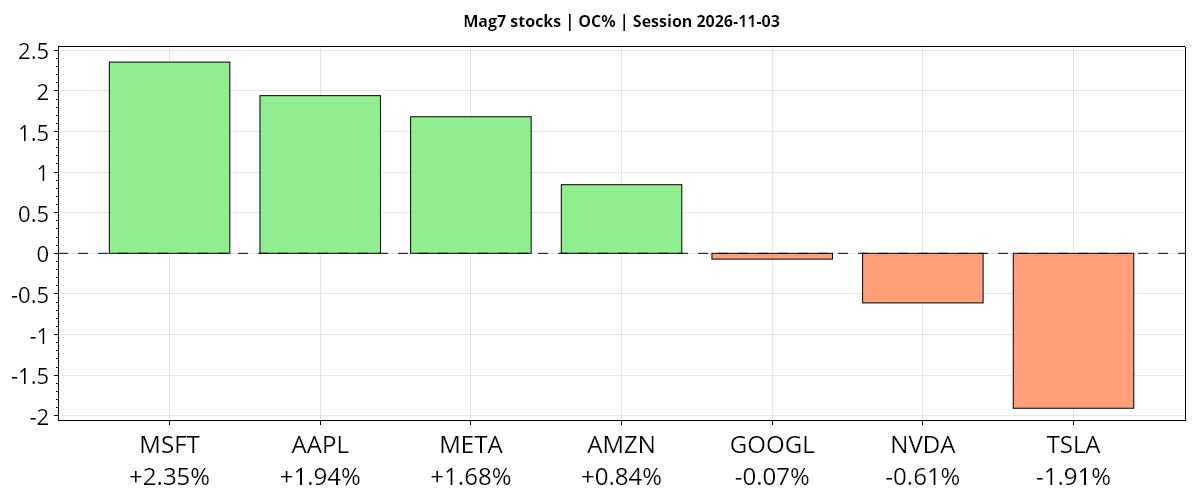
Positive confluence: average DNC% +0.94% versus the prior close, DOC% +0.60% from the open. MSFT led four open-to-close gainers while TSLA lagged; MSFT also led versus the prior close, where AAPL was weakest despite gaining from the open. NVDA gained versus the prior close but fell from the open and closed below VWAP.
MSFT · D:2026-11-03 NC% ▲ +2.74% OC% ▲ +2.35%
MSFT – Microsoft Technicals Summary
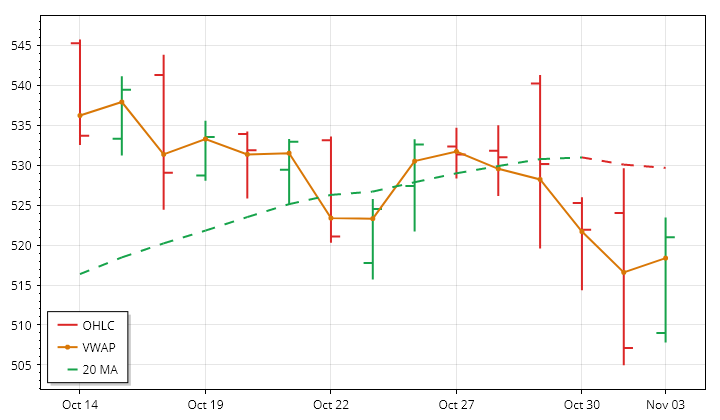
MSFT’s completed daily session on November 3 advanced 2.74% from the prior close to 520.99, with a 2.35% open-to-close gain. The opening gap up remained unfilled, and the close finished above session VWAP. Although the session covered a large range, it remained an inside bar, so the substantial recovery did not take price outside the previous day’s trading boundaries.
Price finished just above its rising intermediate-term average and remained well above its rising far-term average. The near-term average was still falling above price, preserving shorter-term weakness within the broader upward structure. The prior 15 sessions also retained a downward price trend. Above-average range matched that window’s expansion, but below-average volume contrasted with increasing lookback activity. PSAR and ATR-median remained bearish despite the rebound; a next-session high above 536.0222 would conditionally trigger a bullish PSAR reversal.
Microsoft News and Fundamentals
Microsoft reported 48% Azure growth and guided to 49%–50% growth in the second fiscal quarter despite delayed third-party capacity and persistent supply constraints. Operating cash flow reached $58 billion, while conventional free cash flow fell to approximately $18.6 billion. The company disclosed $48.3 billion in component receivables and supplier-linked investments, underscoring capital requirements beyond headline capital expenditure. Microsoft is also offering buyouts to approximately 60,000 employees.
AAPL · D:2026-11-03 NC% ▼ -1.90% OC% ▲ +1.94%
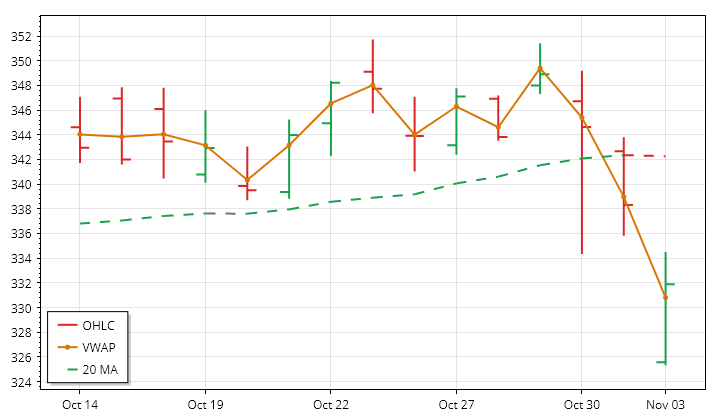
AAPL – Apple Technicals Summary
AAPL’s completed daily session on November 3 closed at 331.90, down 1.90% from the prior close despite gaining 1.94% from the open. The rebound did not fill the opening gap down, and the close remained below the previous day’s low. Finishing above session VWAP nevertheless showed that the intraday recovery had some strength within an otherwise weaker daily structure.
Price remained below rising near- and intermediate-term averages, creating a conflict between current position and their upward direction, while the far-term uptrend stayed intact. The modest upward price trend over the prior 15 sessions had involved considerable back-and-forth movement. This session’s large range and above-average volume reinforced the lookback expansion in ranges and activity. PSAR remained bearish and the ATR-median measure crossed bearish; a next-session high above 349.3137 would conditionally trigger a PSAR bullish reversal.
Apple News and Fundamentals
Apple reported September-quarter revenue of $114.5 billion, up 12% year over year, with iPhone revenue rising 17.5% to $57.6 billion. It forecast holiday revenue growth of 7%–10% and gross margins of 45%–46%, citing higher memory costs and spending on its new Siri AI assistant. On November 3, Apple announced an upcoming AI-powered Health app offering personalized recommendations. Its annual filing also warned that unpredictable AI-agent behavior could threaten its business.
META · D:2026-11-03 NC% ▲ +2.36% OC% ▲ +1.68%
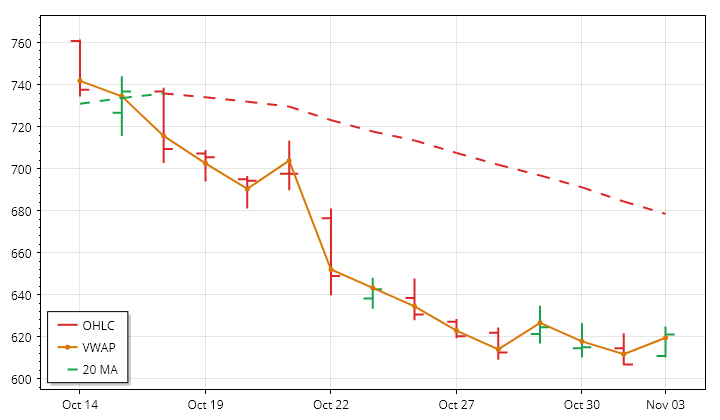
META – Meta Platforms Technicals Summary
META’s completed daily session on November 3 rose 2.36% from the prior close to 621.03, including a 1.68% advance from the open. Its opening gap up remained unfilled, and a higher high and higher low accompanied a finish near the session high and above VWAP. The close nevertheless remained inside the previous day’s range, keeping the recovery contained within that broader daily span.
Near- and intermediate-term averages were still falling above price. The far-term average continued rising, but price remained below it, leaving that horizon mixed. The rebound therefore contrasted with the relatively directional decline over the prior 15 sessions. Range was below average, consistent with lookback contraction, while volume near half its average opposed the increasing activity trend. PSAR and ATR-median stayed bearish; a next-session high above 631.2076 would conditionally trigger a bullish PSAR reversal.
Meta News and Fundamentals
Meta raised $15 billion in a five-part U.S. bond sale on November 3. Earlier reporting said it sought $20 billion–$25 billion across dollar- and euro-denominated debt as infrastructure and AI spending increased. Its third-quarter earnings highlighted Muse AI adoption, advertising revenue growth and rising infrastructure costs. Separately, a San Diego artist said a Meta crawler visited her website more than 550,000 times in 48 hours, exhausting its traffic allowance and effectively taking it offline.
AMZN · D:2026-11-03 NC% ▲ +2.06% OC% ▲ +0.84%
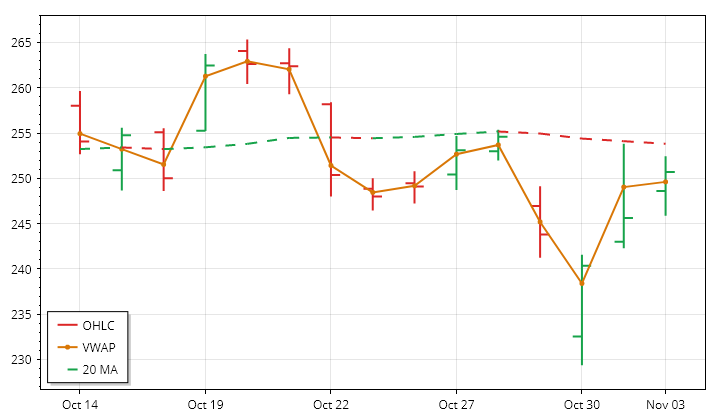
AMZN – Amazon Technicals Summary
AMZN’s completed daily session on November 3 rose 2.06% from the prior close to 250.69, including a 0.84% gain from the open. The opening gap up remained unfilled, and the close finished above session VWAP. However, an inside bar kept the entire session within the previous day’s range, making this a contained rebound rather than a broader price breakout.
The advance lifted price above its falling near-term average, leaving that horizon mixed. The intermediate trend remained down, while price held above a slightly rising far-term average. Those conflicting horizons fit a recovery within the prior 15 sessions’ declining price trend. Range was near average and volume below average, contrasting with expanding ranges and increasing volume across that lookback. PSAR turned bullish while ATR-median remained bearish; a next-session low below 230.5855 would conditionally reverse PSAR downward.
Amazon News and Fundamentals
Amazon reported third-quarter 2026 revenue of $201.94 billion, a 13.9% operating margin and 61% year-over-year operating income growth. AWS revenue rose 39.3% to $45.98 billion, with backlog reaching $578 billion; management forecast AWS growth above 40% in both 2027 and 2028. A November 3 notice disclosed approximately 95 Washington state job cuts, which Amazon said belonged to previously announced retail layoffs rather than a new round.
GOOGL · D:2026-11-03 NC% ▲ +0.37% OC% ▼ -0.07%
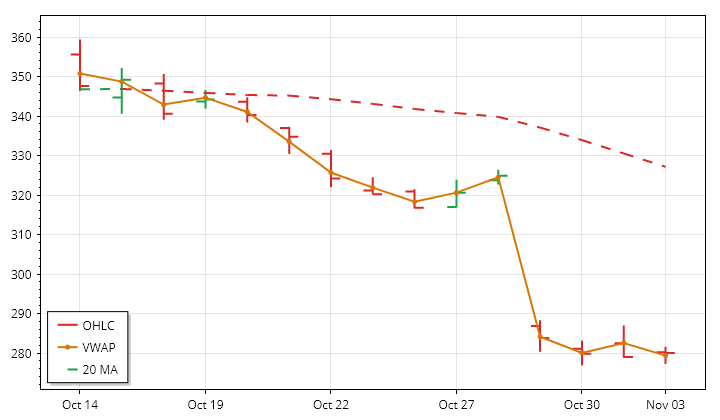
GOOGL – Alphabet Technicals Summary
GOOGL’s completed daily session on November 3 closed at 280.03, up 0.37% from the prior close but down 0.07% from the open. Thus, the daily gain reflected the opening uplift rather than sustained open-to-close progress. The gap was filled, and trading produced a lower high and lower low, although the close stayed within the previous day’s range and above session VWAP.
The small advance contrasted with aligned near-, intermediate- and far-term downtrends. Price remained below falling averages across all three horizons, consistent with the relatively directional decline over the prior 15 sessions. The latest range was substantially below average, matching the lookback contraction, while below-average volume ran against its increasing volume trend. PSAR and ATR-median remained bearish. A next-session high above 302.2563 would conditionally trigger a bullish PSAR reversal, not establish a reversal in the broader trends.
NVDA · D:2026-11-03 NC% ▲ +2.29% OC% ▼ -0.61%
NVDA – Nvidia Technicals Summary
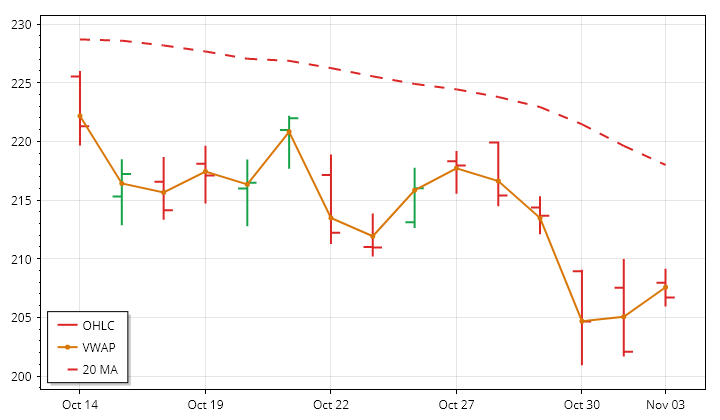
NVDA’s completed daily session on November 3 closed at 206.69, up 2.29% from the prior close but down 0.61% from the open. The positive daily return therefore came from the opening gap up, which remained unfilled, rather than intraday appreciation. An inside bar and a finish near the session low and below VWAP added caution to the apparent strength of the headline gain.
Near- and intermediate-term trends remained down, with price below falling averages. The far-term average was still rising, but price stayed beneath it, leaving that horizon mixed. This positioning was consistent with the prior 15 sessions’ declining price trend. The latest range and volume were below average, contrary to expanding ranges and increasing activity across that window. PSAR and ATR-median retained bearish states. A next-session high above 218.1307 would conditionally trigger a bullish PSAR reversal.
Nvidia News and Fundamentals
Nvidia is directing data-center partners to reduce work with Chinese customers, the Financial Times reported on November 3. The company is also targeting a 14-day AI-factory deployment timeline through its DSX POD modular design, aiming to shorten installation times. Its next earnings report is expected in approximately two weeks.
TSLA · D:2026-11-03 NC% ▼ -1.32% OC% ▼ -1.91%
TSLA – Tesla Technicals Summary
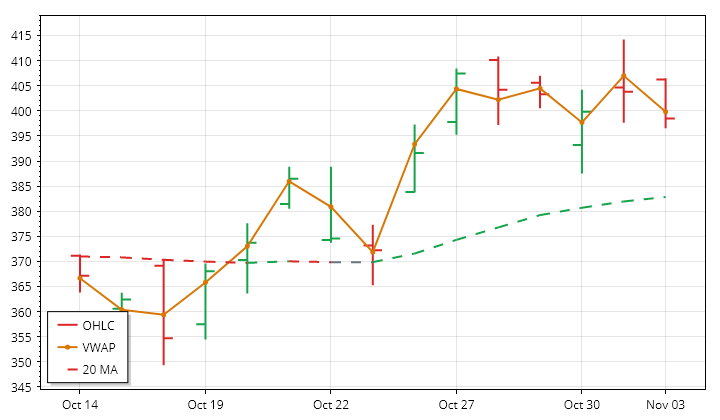
TSLA’s completed daily session on November 3 fell 1.32% from the prior close to 398.50 and lost 1.91% from the open. The opening gap up was filled, and the session formed a lower high and lower low. A finish near the session low and below VWAP emphasized intraday weakness, although the close remained within the previous day’s range rather than breaking below it.
The decline left price only slightly above its rising near-term average, while the intermediate uptrend remained intact. Price was also above a falling far-term average, leaving that longer horizon mixed. The latest loss therefore contrasted with the prior 15 sessions’ upward price trend. Range and volume were below average despite expanding ranges and increasing activity over that window. PSAR and ATR-median stayed bullish; a next-session low below 392.862 would conditionally trigger a bearish PSAR reversal.
Tesla News and Fundamentals
Tesla’s China-made electric-vehicle sales rose 10.3% year over year in October. Separately, a South Korean consumer group alleged that Tesla misled customers about its automated-driving technology.
| Instrument | Bias | Date | DNC% | DOC% | O | H | L | C | VWAP | Vol |
|---|---|---|---|---|---|---|---|---|---|---|
| ▲ IBIT | ▲ ▲ ▲ | 2026-11-03 | ▲ +1.61% | ▲ +1.10% | 43.57 | 44.08 | 43.55 | 44.05 | ▲ 43.86 | 24,296,712 |
| ▲ USO | ▲ ▲ ▲ | 2026-11-03 | ▲ +0.83% | ▲ +0.46% | 157.44 | 158.52 | 156.51 | 158.17 | ▲ 157.55 | 4,456,071 |
| ▼ TLT | ▼ ▼ ▼ | 2026-11-03 | ▼ -0.76% | ▼ -0.40% | 81.44 | 81.45 | 80.97 | 81.11 | ▼ 81.17 | 28,930,620 |
| ▼ GLD | ▼ ▼ ▼ | 2026-11-03 | ▼ -0.66% | ▼ -0.57% | 361.33 | 361.86 | 358.94 | 359.26 | ▼ 360.13 | 6,033,875 |
| AVG/Sum | — | — | +0.26% | +0.15% | — | — | — | — | — | 63,717,278 |
Cross-Market ETFs
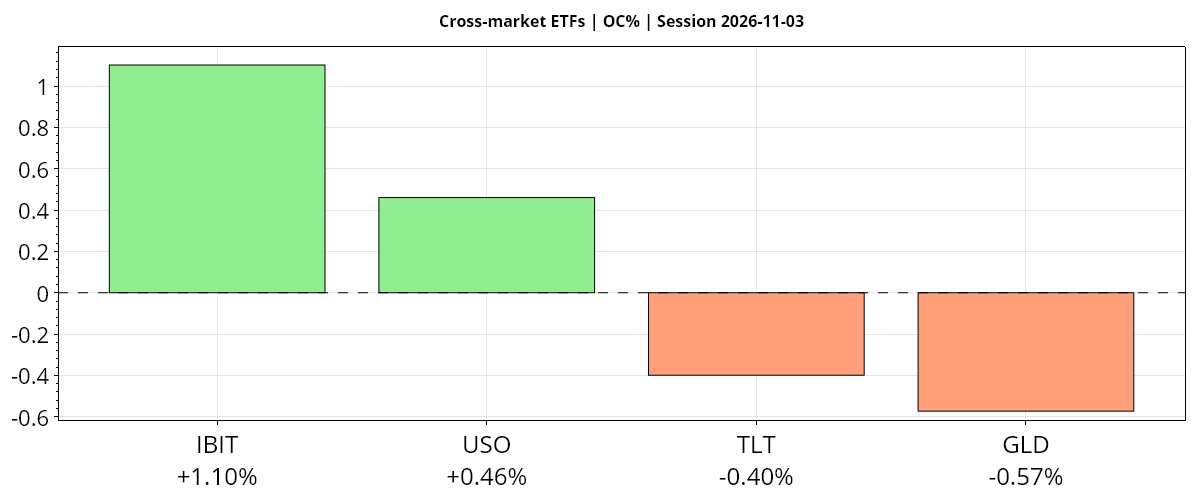
Positive confluence: average DNC% +0.26% versus the prior close, DOC% +0.15% from the open. Bitcoin led oil higher on both comparisons, while gold and bonds declined, diverging from equities’ positive averages. Gold’s moving-average downtrends remained aligned; bitcoin retained near-term weakness despite its daily gain.
IBIT · D:2026-11-03 NC% ▲ +1.61% OC% ▲ +1.10%
IBIT – Bitcoin Technicals Summary
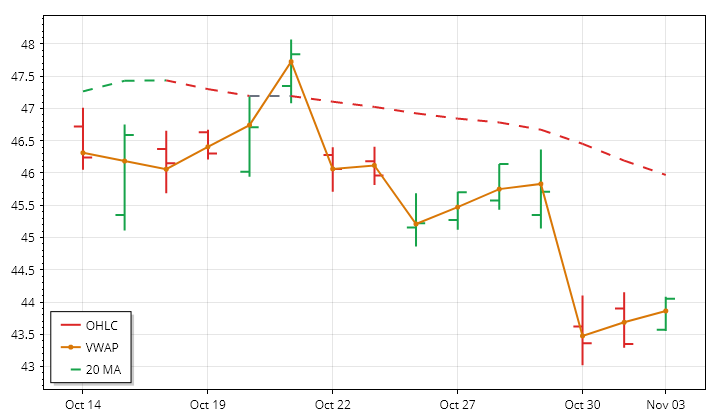
IBIT’s completed daily session on November 3 advanced 1.61% from the prior close to 44.05, including a 1.10% gain from the open. The opening gap up remained unfilled, and the close finished near the session high and above VWAP. Nevertheless, the inside bar confined the recovery to the previous day’s range, limiting the change in the daily price structure.
The near-term trend remained down, and price was still below a rising intermediate-term average, leaving that horizon mixed. The far-term uptrend remained intact, so the latest rebound occurred within shorter-term weakness rather than full trend alignment. Range and volume were both roughly three-fifths of average. The narrow range matched the prior 15 sessions’ contraction, but subdued volume contrasted with increasing lookback activity. Both technical measures stayed bearish; a next-session high above 46.5537 would conditionally reverse PSAR upward.
USO · D:2026-11-03 NC% ▲ +0.83% OC% ▲ +0.46%
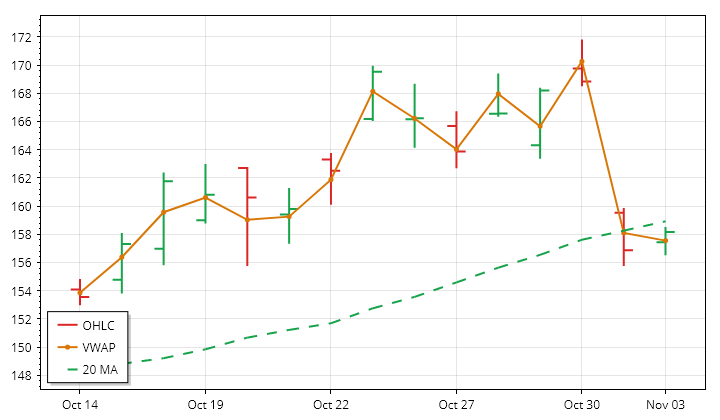
USO – Oil Technicals Summary
USO’s completed daily session on November 3 advanced 0.83% from the prior close to 158.17, including a 0.46% gain from the open. The opening gap up was filled before the close finished near the session high and above VWAP. Still, an inside bar kept the recovery within the previous day’s range, making the session a contained advance rather than a change in the broader daily boundaries.
Price remained below a rising near-term average, leaving that horizon mixed, while intermediate- and far-term uptrends stayed intact. The prior 15 sessions also showed an upward price trend, though with considerable back-and-forth movement. Range was less than half average, consistent with lookback contraction, while below-average volume contrasted with increasing activity. Signals diverged as PSAR turned bearish while ATR-median remained bullish. A next-session high above 171.0165 would conditionally trigger a bullish PSAR reversal.
Oil News and Fundamentals
Crude futures fell approximately 1% to below $96 a barrel on November 3. Oil later traded lower in early Asian trading as U.S. midterm election results unfolded. ANZ Research attributed price volatility to conflicting signals about progress in U.S.-Iran peace talks. Wednesday’s EIA report was identified as an upcoming catalyst amid uncertainty over physical oil supply.
TLT · D:2026-11-03 NC% ▼ -0.76% OC% ▼ -0.40%
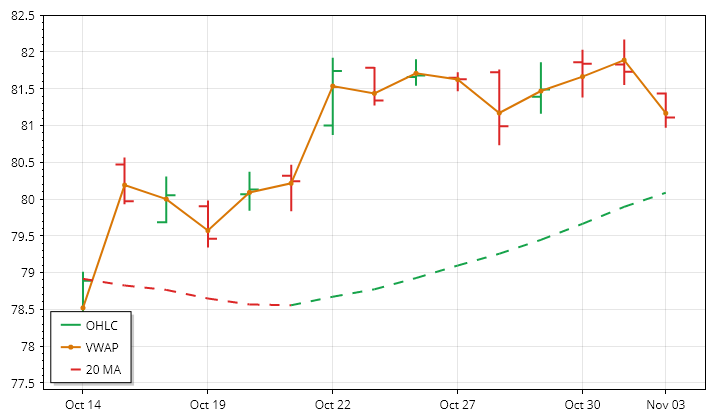
TLT – Long-Term Treasury Bonds Technicals Summary
TLT’s completed daily session on November 3 declined 0.76% from the prior close to 81.11, including a 0.40% loss from the open. The opening gap down remained unfilled. A lower high and lower low, followed by a close below the previous day’s low and below session VWAP, gave the session a weaker structure than the recent upward price trend would suggest.
Price slipped below its rising near-term average, leaving that horizon mixed, but remained above the rising intermediate-term average. The far-term trend was still down, with its falling average above price. The latest decline thus interrupted the prior 15 sessions’ advance without resolving the conflict between intermediate strength and longer-term weakness. Below-average range and volume matched the lookback contraction in both. PSAR and ATR-median remained bullish; a next-session low below 80.9388 would conditionally reverse PSAR downward.
GLD · D:2026-11-03 NC% ▼ -0.66% OC% ▼ -0.57%
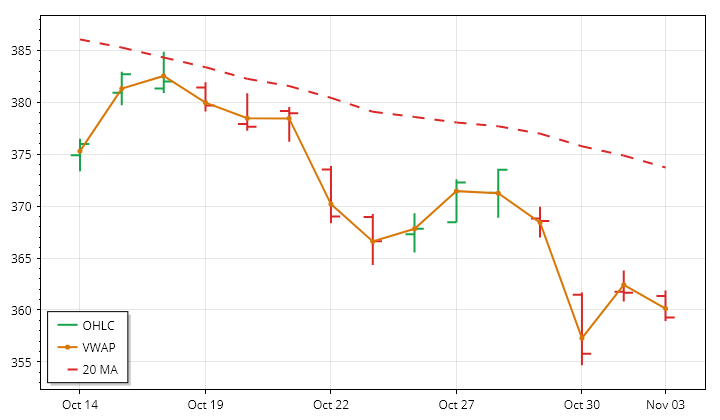
GLD – Gold Technicals Summary
GLD’s completed daily session on November 3 fell 0.66% from the prior close to 359.26, with a 0.57% open-to-close decline. The small opening gap down was filled, but that recovery did not persist. A lower high and lower low, followed by a close below the previous day’s low and below session VWAP, kept the day’s price action aligned with the broader weakness.
Near-, intermediate- and far-term trends were all declining, with price below their falling averages. That agreement also matched the downward price trend over the prior 15 sessions. The latest range and volume were below average, however, contrasting with expanding ranges and increasing activity across the lookback. The close remained only modestly above the annual low. Both PSAR and ATR-median retained bearish states; a next-session high above 369.2803 would conditionally trigger a bullish PSAR reversal.
Gold News and Fundamentals
Central banks accelerated gold purchases in the third quarter to their fastest pace since late 2024, according to the World Gold Council, which cited geopolitical risks and fiscal-discipline concerns. Central-bank buying surged 42%, while overall demand remained near record highs. Higher interest rates and elevated bond yields remained headwinds. Gold recorded its worst October since 2008, and Friday’s U.S. jobs report was identified as an upcoming catalyst.
Glossary: Instrument — ticker symbol; hover for the instrument or company name; Date — session date. DNC% — prior-session close to this session’s close; DOC% — daily session open-to-close percentage change. O — open; H — high; L — low; C — close, all for the table’s daily or weekly session; VWAP — volume-weighted average price; its arrow shows whether the close is above or below VWAP. Vol — period trading volume.
Bias — three directional readings, in order: DNC%, DOC%, then VWAP. ▲ positive/above; ▼ negative/below; — neutral or unavailable. Matching arrows show alignment; opposing arrows show mixed conditions. AVG/Sum — simple average of percentage changes and sum of reported volumes.
Futures Session Fib Grid Analysis – Snapshot
Session Fib Grids normalise market positioning as percentages, making direction and alignment comparable across different asset types.
Latest available snapshot for each instrument; Time(CT) shows the individual update date and time.
| Instrument | Bias | Time(CT) | YSFG | MSFG | WSFG | RSFG | SFG | TSI |
|---|---|---|---|---|---|---|---|---|
| ▲ ES | ▲ ▲ ▲ ▲ ▲ ▲ | 2026-11-04 07:19:12 | ▲ +50 | ▲ +13 | ▲ +20 | ▲ +104 | ▲ +15 | ▲ +55 |
| ▲ NQ | ▲ ▼ ▼ ▲ ▲ ▼ | 2026-11-04 07:19:12 | ▲ +39 | ▼ -9 | ▼ -15 | ▲ +17 | ▲ +15 | ▼ -25 |
| ▲ YM | ▲ ▲ ▲ ▲ ▲ ▲ | 2026-11-04 07:19:15 | ▲ +39 | ▲ +35 | ▲ +67 | ▲ +195 | ▲ +16 | ▲ +293 |
| ▲ EMD | ▲ ▲ ▲ ▲ ▲ ▲ | 2026-11-04 07:17:50 | ▲ +49 | ▲ +55 | ▲ +92 | ▲ +145 | ▲ +16 | ▲ +242 |
| ▲ RTY | ▲ ▲ ▲ ▲ ▲ ▲ | 2026-11-04 07:19:15 | ▲ +45 | ▲ +26 | ▲ +42 | ▲ +125 | ▲ +17 | ▲ +212 |
| ▲ FDAX | ▲ ▲ ▲ ▲ ▲ ▲ | 2026-11-04 07:19:15 | ▲ +38 | ▲ +37 | ▲ +57 | ▲ +145 | ▲ +20 | ▲ +270 |
| ▼ NKD | ▲ ▲ ▲ ▼ ▲ ▼ | 2026-11-04 07:19:07 | ▲ +148 | ▲ +4 | ▲ +9 | ▼ -29 | ▲ +6 | ▼ -39 |
| Instrument | Bias | Time(CT) | YSFG | MSFG | WSFG | RSFG | SFG | TSI |
|---|---|---|---|---|---|---|---|---|
| ▲ BTC | ▼ ▲ ▲ ▲ ▲ ▲ | 2026-11-04 07:17:45 | ▼ -45 | ▲ +4 | ▲ +11 | ▲ +47 | ▲ +2 | ▲ +55 |
| ▲ GC | ▼ ▲ ▲ ▲ ▼ ▲ | 2026-11-04 07:19:14 | ▼ -136 | ▲ +38 | ▲ +88 | ▲ +172 | ▼ -6 | ▲ +150 |
| ▼ CL | ▲ ▼ ▼ ▼ ▼ ▼ | 2026-11-04 07:19:14 | ▲ +167 | ▼ -40 | ▼ -102 | ▼ -6 | ▼ -7 | ▼ -139 |
| ▲ 6E | ▼ ▲ ▲ ▲ ▲ ▲ | 2026-11-04 07:19:00 | ▼ -51 | ▲ +45 | ▲ +94 | ▲ +131 | ▲ +2 | ▲ +78 |
| ▼ ZB | ▼ ▲ ▲ ▼ ▼ ▲ | 2026-10-21 09:39:59 | ▼ -39 | ▲ +77 | ▲ +6 | ▼ -3 | ▼ -2 | ▲ +29 |
Glossary: YSFG — yearly; MSFG — monthly; WSFG — weekly; RSFG — regular trading hours (RTH); SFG — the current session, including pre-market or other sessions. TSI indicates trend strength and power.
Bias shows trend alignment across these six readings. The arrows follow the column order: YSFG, MSFG, WSFG, RSFG, SFG and TSI. Matching arrows show alignment; opposing arrows show mixed conditions.
Futures Higher Time Frame Analysis
Summary of the current state of US Indices Futures based on higher time-frame (HTF) technical analysis as of: 2026-11-04 07:16 -06:00 CT.
US Indices Futures
- ES above YSFG/MSFG/WSFG centers, below 5–100-day benchmarks, daily pivots down, support 7490, reversal threshold 7673.50, resistance 7906.25.
- NQ above YSFG center, below MSFG/WSFG centers and 5–100-day benchmarks, daily pivots down, support 27500.75–27615.75, reversal threshold 28830.75.
- YM above YSFG/MSFG/WSFG centers, declining 5–55-day benchmarks, daily pivots down, support 51444, reversal threshold 52718, resistance 53168.
- EMD above YSFG/MSFG/WSFG centers, above most daily benchmarks but below 100-day, daily pivots up, support 3600.3, resistance 3763.8–3793.9.
- RTY above YSFG/MSFG/WSFG centers, below declining 55/100-day benchmarks, daily pivots up, support 2725.3, reversal reference 2793.2, resistance 2880.2–2888.9.
- FDAX above YSFG/MSFG/WSFG centers and all daily/weekly benchmarks, pivots up, daily reversal reference 25815, weekly support 24909–24925, resistance 26844–26847.
Overall State
- Short-Term: Neutral
- Intermediate-Term: Neutral
- Long-Term: Bullish
Conclusion
Daily directional alignment is split: ES, NQ, and YM retain downward short-term pivots, while EMD, RTY, and FDAX have upward daily pivots. FDAX leads benchmark alignment; NQ lags below MSFG/WSFG centers with its 200-day benchmark under test. EMD and RTY rebounds remain below their declining 100-day benchmarks. Weekly intermediate HiLo uptrends and YSFG positioning preserve the broader upward context, although NQ retains bearish intermediate conditions. Recent NQ MSFG and FDAX monthly short signals contrast with their longer-term upward structures. Swing resistance remains at ES 7906.25, YM 55316, EMD 3969.6, RTY 3101.8, and FDAX 26844–26847; NQ support is 27500.75–27615.75.
Note: Intra-day counter-trend pullbacks or retracements may occur, HTF is context for informational usage and market structure. Glossary: Session Fib Grids periods of YSFG:’Yearly’, MSFG:’Monthly’, WSFG:’Weekly’
For full details visit: AlphaWebTrader Technicals
SPY Daily View
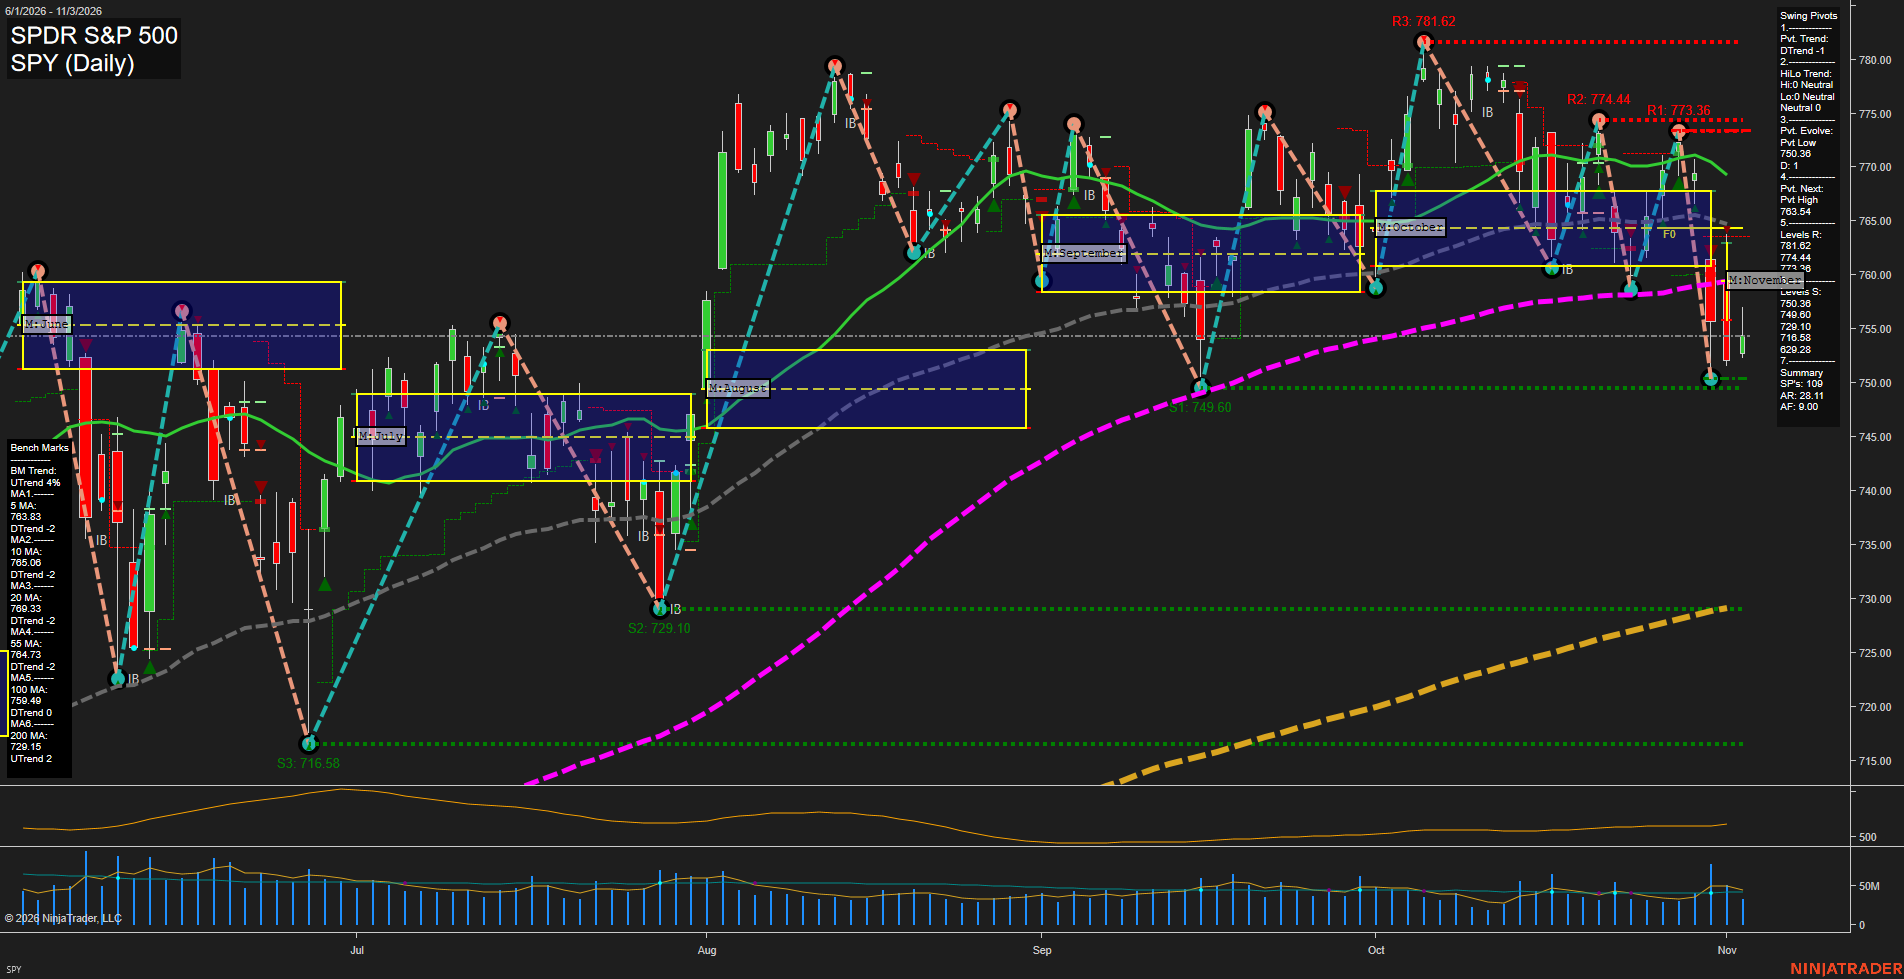
Overall Rating
- Short-Term: Bearish
- Intermediate-Term: Bearish
- Long-Term: Neutral.
Key Insights Summary
SPY futures-equivalent price action is in a sharp short-term liquidation swing, with large bars and fast downside momentum pressing into the 750.38-749.60 support cluster. The daily pivot structure remains bearish, and price is below every benchmark from the 5-day through 100-day average, confirming downside trend alignment across short and intermediate horizons. The developing pivot low near 750.67 creates a near-term response area, while 763.54 is the pivotal upside reversal threshold; overhead resistance is layered at 773.36, 774.44, and 781.62. The broader structure remains neutral rather than fully bearish because price is still materially above a rising 200-day benchmark near 729.15, leaving the current move characterized as a pronounced correction within the larger yearly trend.
View charts on: AlphaWebTrader HTF Charts
ES Daily View
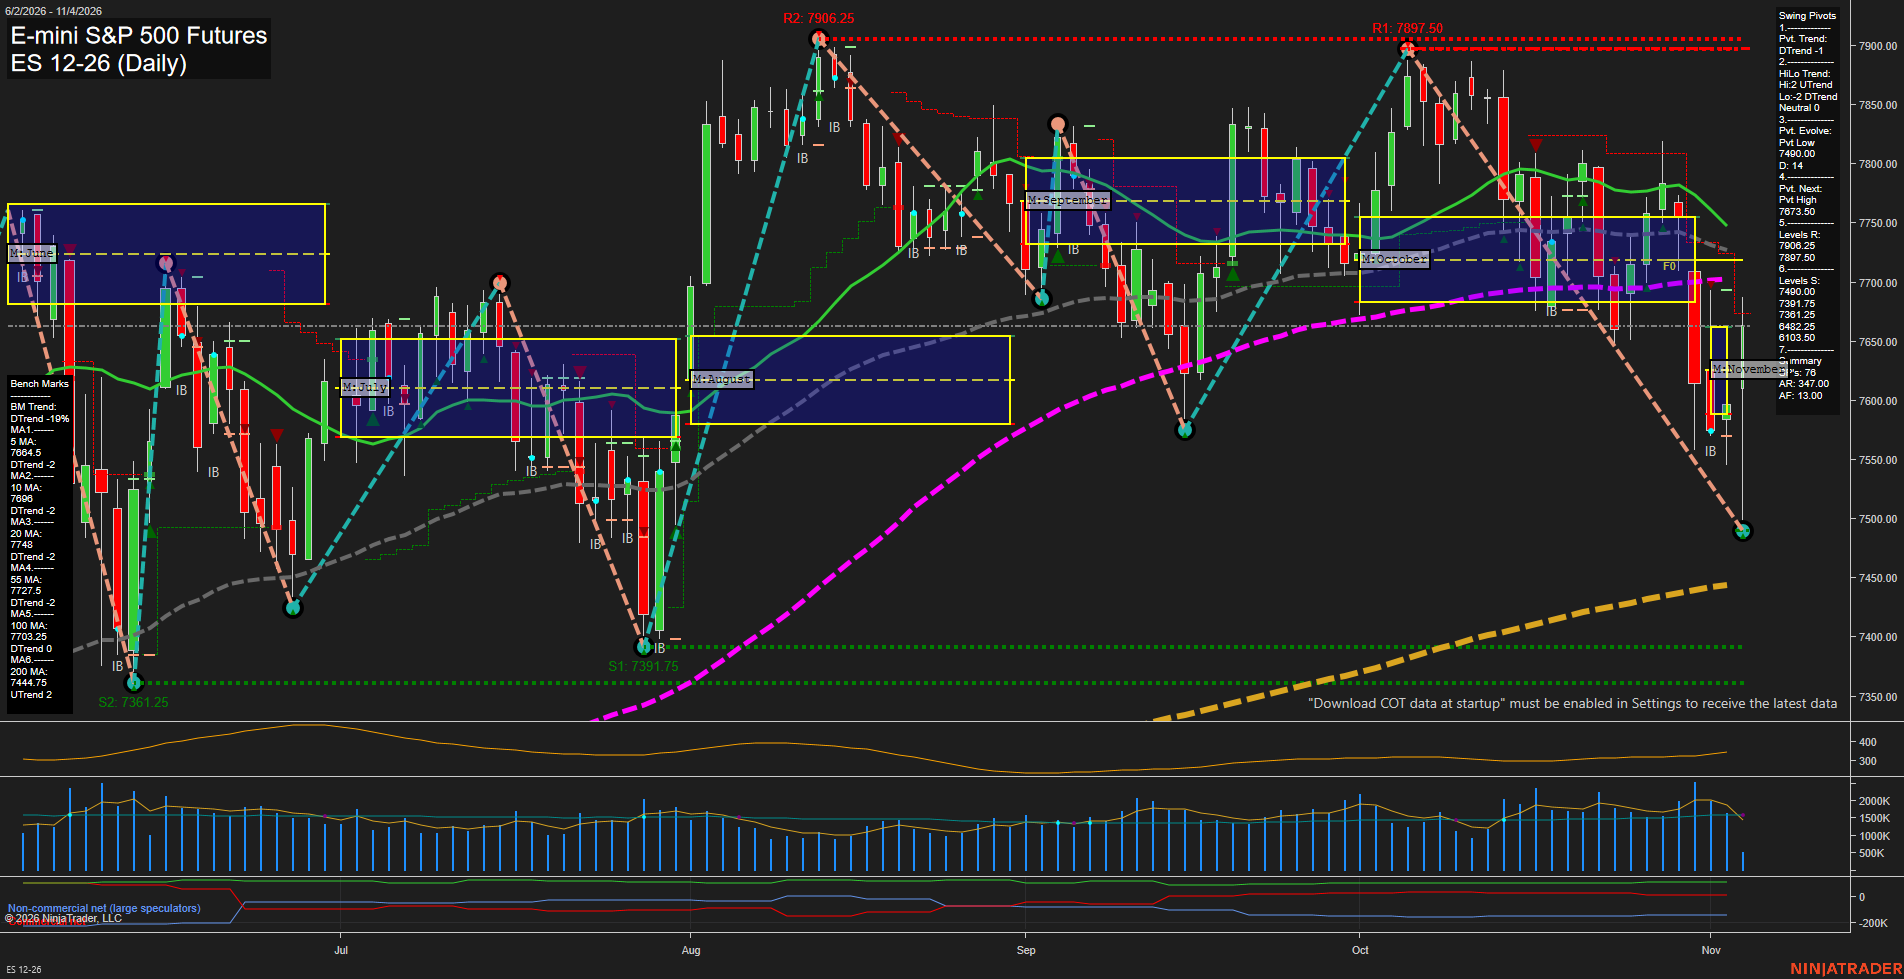
Overall Rating
- Short-Term: Bearish
- Intermediate-Term: Neutral
- Long-Term: Bullish.
Key Insights Summary
The daily structure reflects a sharp, high-volatility countertrend selloff from the October swing high, with large bars and price positioned below the 5-, 10-, 20-, 55-, and 100-day benchmarks. The short-term pivot trend remains down, although the intermediate pivot sequence remains constructive and the broader yearly grid is positive. The 7490 pivot low is the principal nearby structural support, while 7673.50 is the immediate pivot-reversal threshold and the 7700-7750 area contains a dense cluster of declining moving-average resistance. Long-term conditions remain supported by price holding above the rising 200-day benchmark, preserving the broader bullish structure despite the current daily retracement.
View charts on: AlphaWebTrader HTF Charts
QQQ Daily View
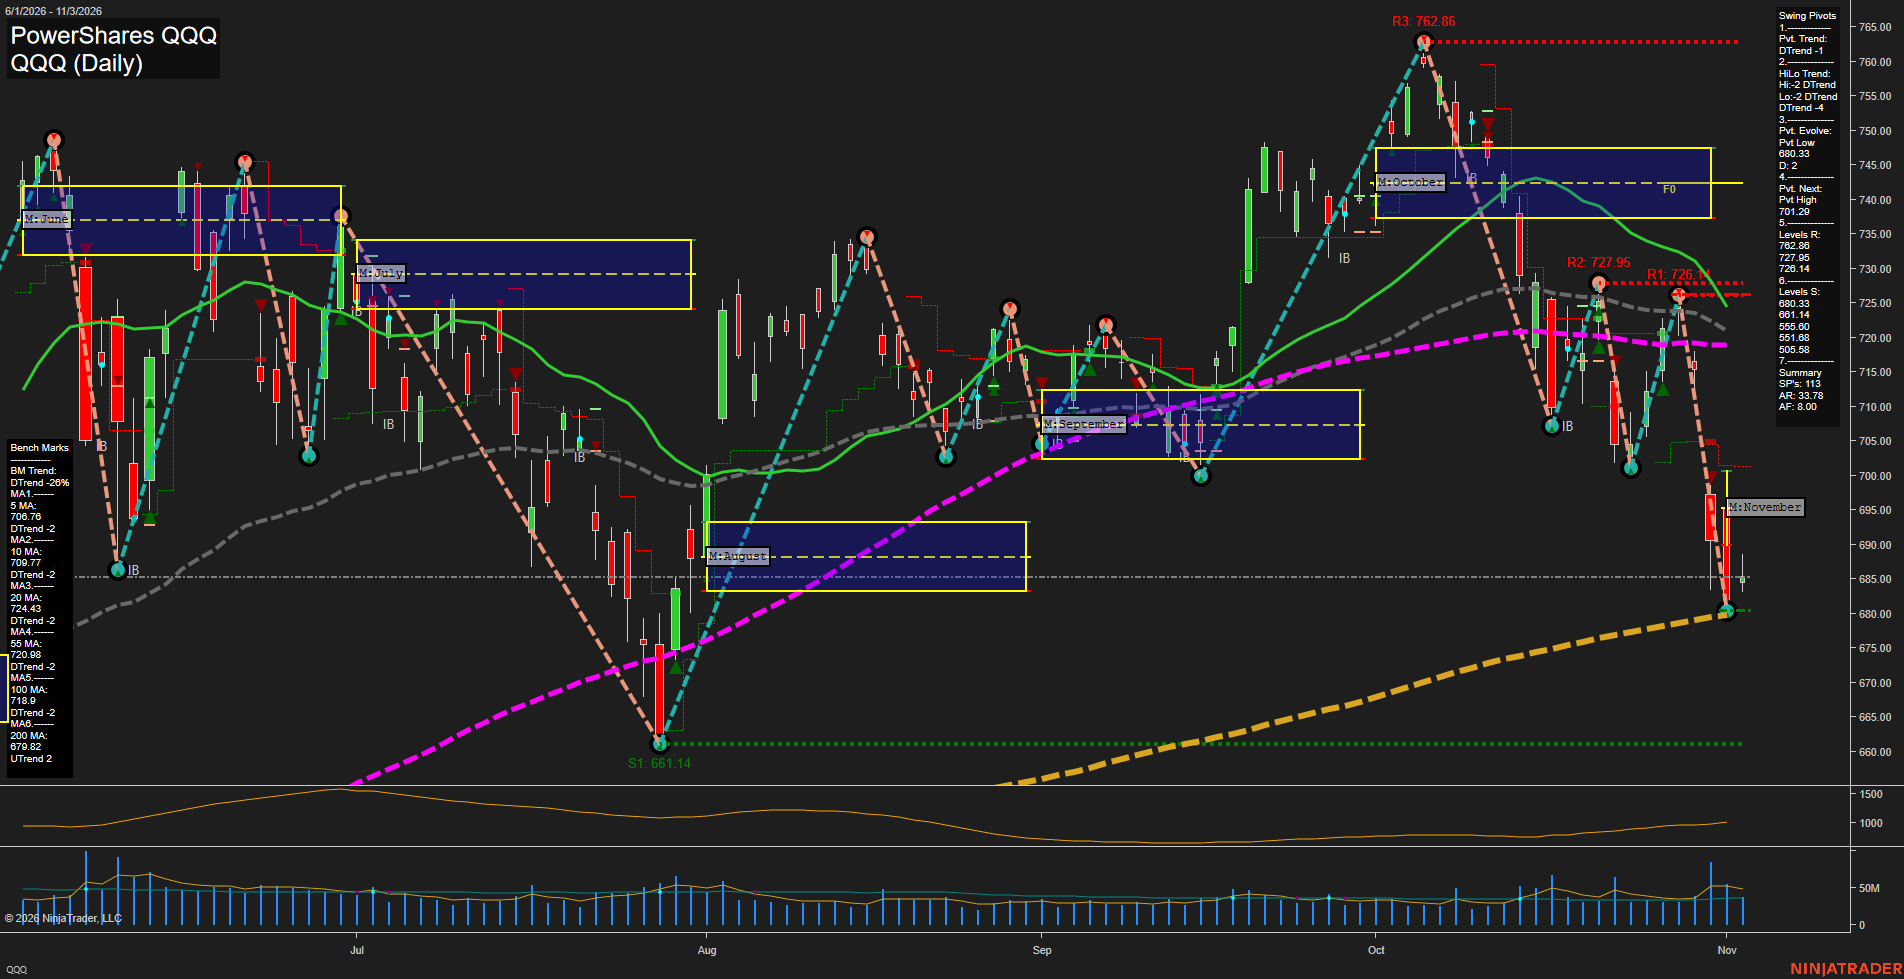
Overall Rating
- Short-Term: Bearish
- Intermediate-Term: Bearish
- Long-Term: Neutral.
Key Insights Summary
QQQ reflects a sharp futures-style liquidation leg, with large-range bars and fast downside momentum driving price beneath every benchmark from the 5-day through 100-day averages. Both the short-term pivot trend and intermediate HiLo trend are in DTrend, defining a lower-high/lower-low structure. The 680.33 swing-low area and nearby rising 200-day average at 679.82 form the principal long-term support confluence, while 701.29 is the initial pivot-reversal reference and 724.43-727.95 is a dense overhead resistance zone. November price action is below the monthly NTZ lower boundary, confirming intermediate-term downside pressure; however, the 200-day average remains positively sloped, leaving the major trend structurally neutral rather than fully bearish.
View charts on: AlphaWebTrader HTF Charts
NQ Daily View
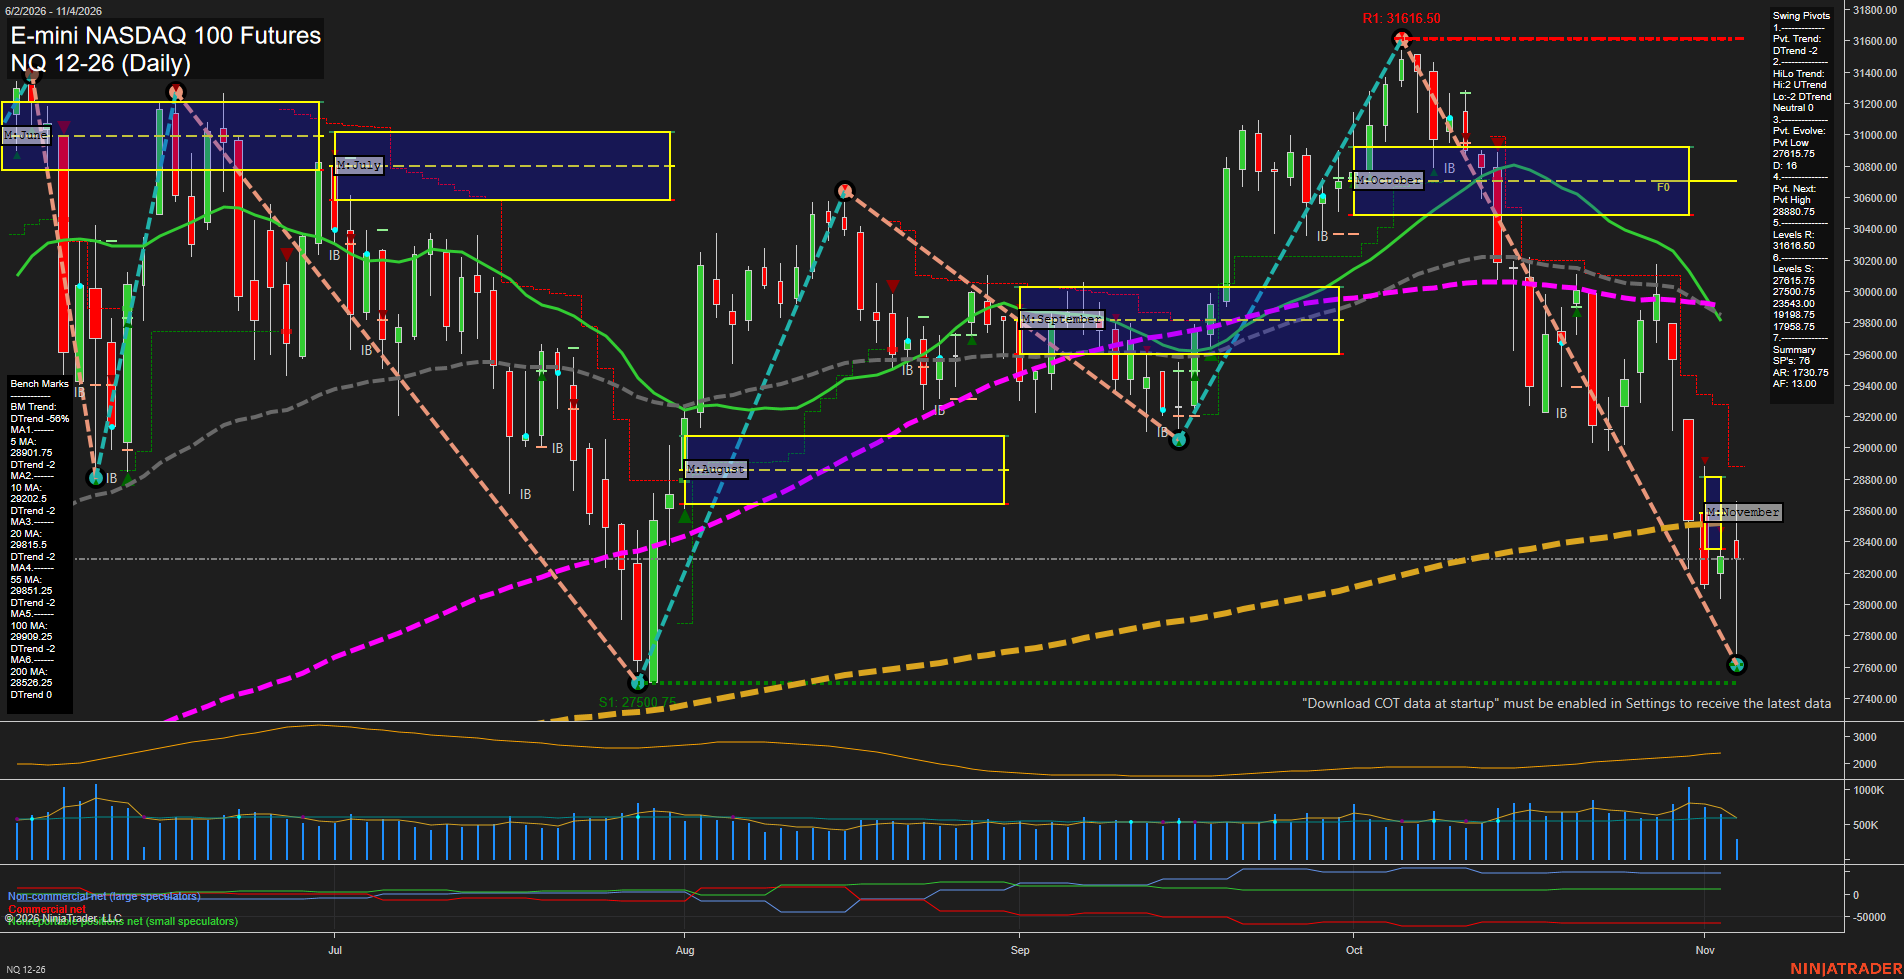
Overall Rating
- Short-Term: Bearish
- Intermediate-Term: Bearish
- Long-Term: Neutral.
Key Insights Summary
Price is in a fast, high-volatility downswing from the October peak, with large daily bars and a sequence of lower highs driving the short-term pivot trend lower. Price remains below the weekly and monthly F0% levels, beneath the 5, 10, 20, 55, and 100-day benchmarks, confirming broad short- and intermediate-term downside alignment. The 200-day average near 28526.25 is being tested, while the 27615.75 to 27500.75 swing-support area marks the major nearby downside reference. The intermediate HiLo trend remains positive and the yearly grid remains above F0%, framing the current decline as a substantial countertrend retracement within the longer-term 2026 advance. A recovery through the 28830.75 next-pivot threshold would be the first structural indication that the immediate decline is evolving into a rebound.
View charts on: AlphaWebTrader HTF Charts
USO Daily View
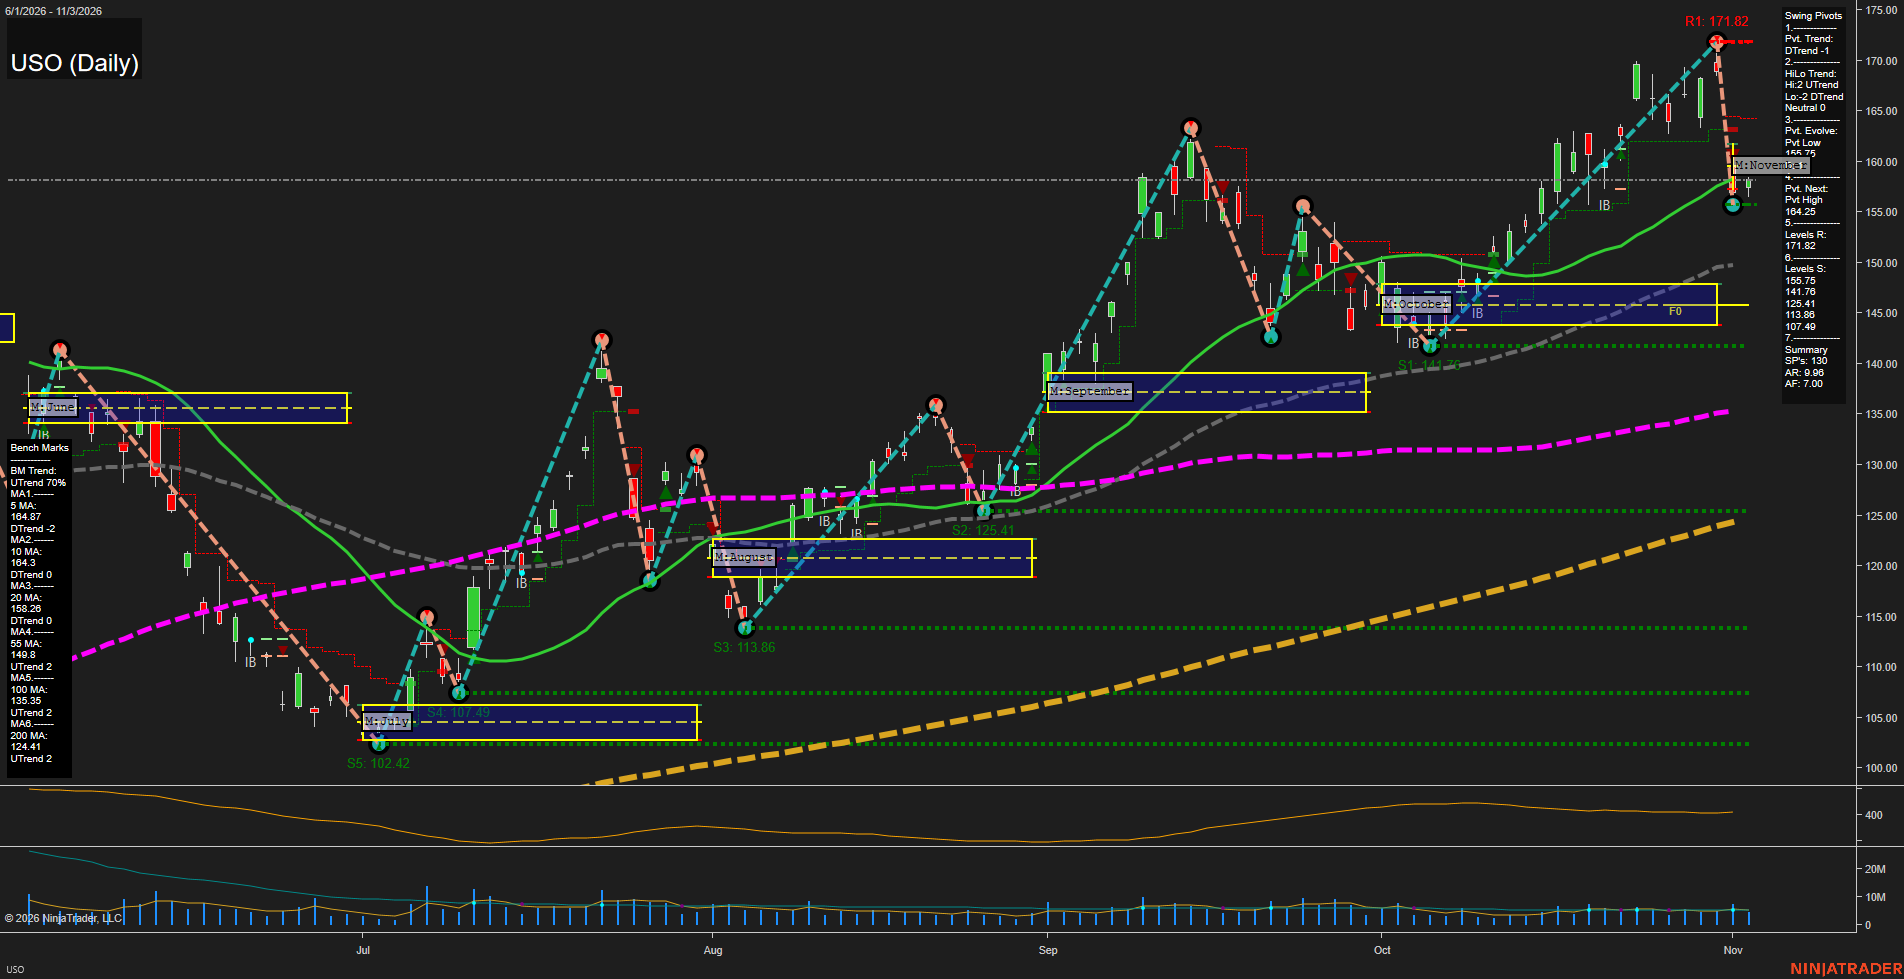
Overall Rating
- Short-Term: Bearish
- Intermediate-Term: Bullish
- Long-Term: Bullish.
Key Insights Summary
USO remains in a broader higher-high and higher-low structure above rising 55-, 100-, and 200-day benchmarks, supporting the intermediate and long-term bullish trend condition. The recent rejection from 171.82 created a short-term pivot downtrend, with price still beneath declining 5-, 10-, and 20-day averages. The 155.75 pivot low is the immediate structural reference after a sharp pullback and rebound, while 164.25 is the next pivot-high reversal level and 171.82 remains the major overhead swing resistance. November price action is above the monthly F0%/NTZ region, reflecting an upside extension from the monthly balance area, but the short-term structure remains a countertrend recovery within a recent selloff from the highs.
View charts on: AlphaWebTrader HTF Charts
CL Daily View
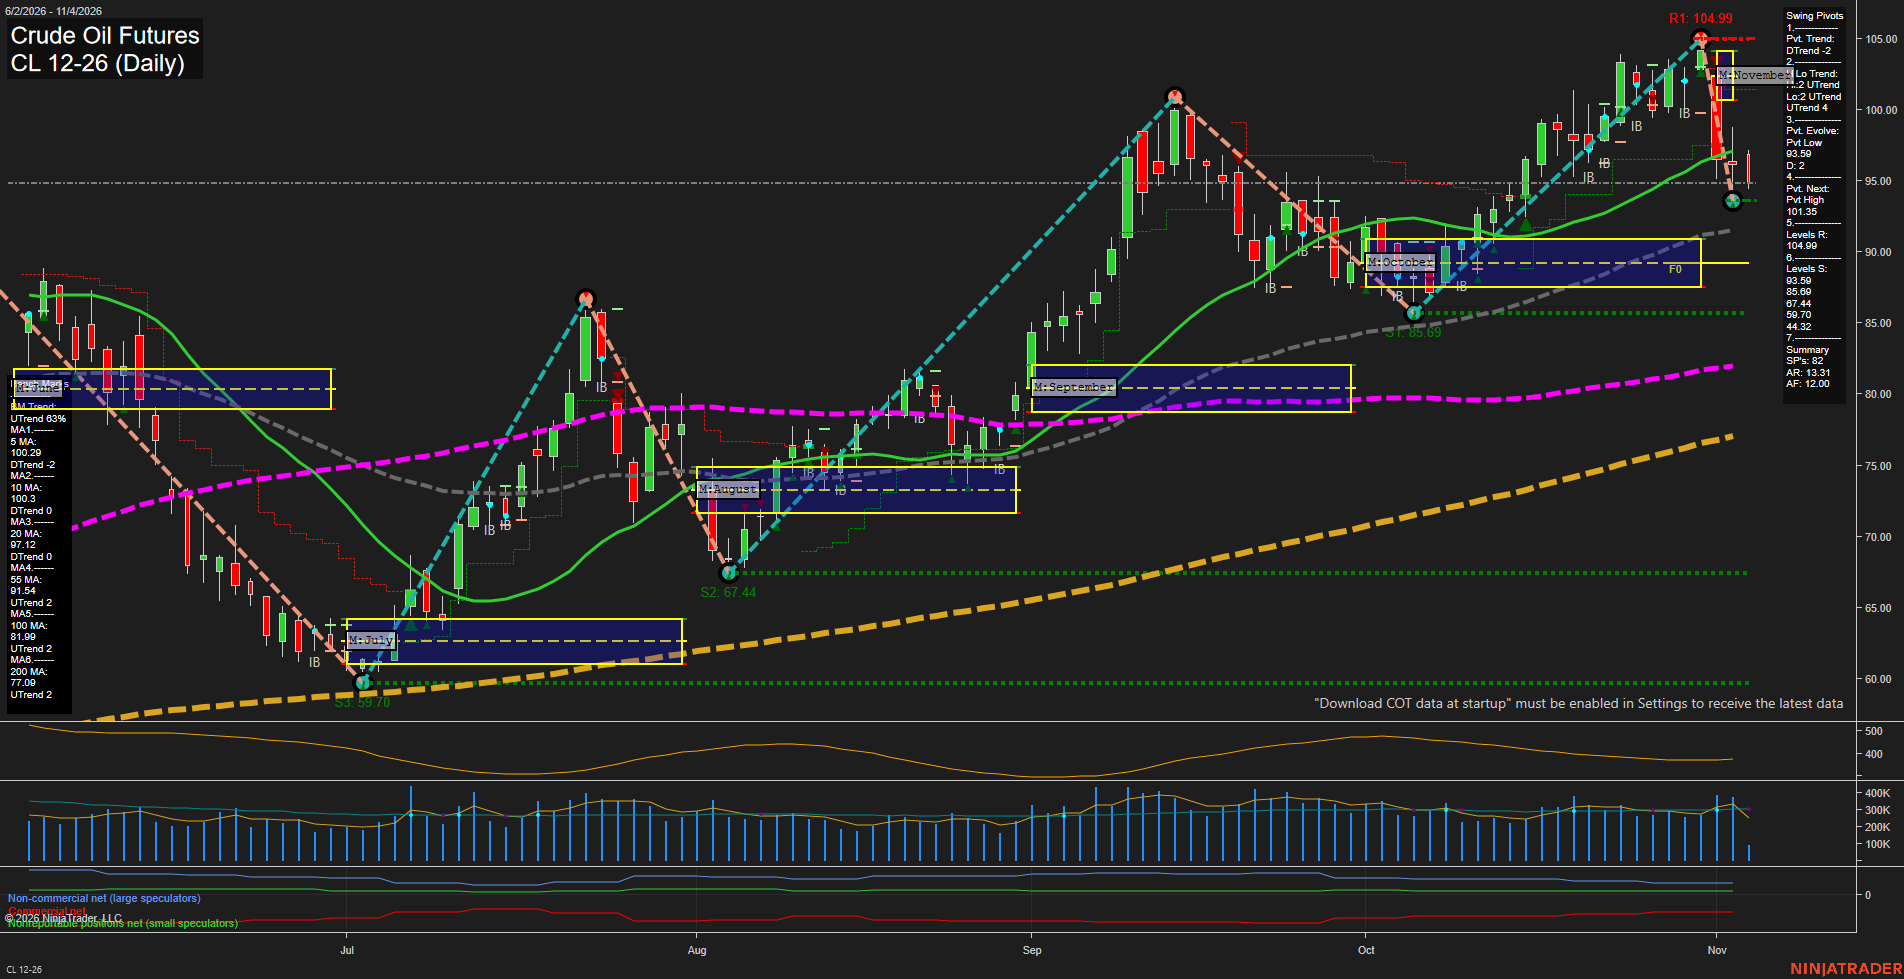
Overall Rating
- Short-Term: Bearish
- Intermediate-Term: Bearish
- Long-Term: Bullish.
Key Insights Summary
Price has shifted into a fast, large-range selloff from the 104.99 swing-high resistance area, breaking beneath the 5-, 10-, and 20-day benchmarks and placing both weekly and monthly Fib-grid conditions below their F0%/NTZ zones. The short-term pivot sequence is bearish, while 93.59 is the immediate pivot-low reference. The intermediate structure remains mixed because the HiLo trend and 55-day benchmark remain upward, but current momentum and the monthly grid show a countertrend retracement within the broader 2026 advance. The long-term structure remains constructive above the rising 100- and 200-day benchmarks and the annual Fib-grid F0% area.
View charts on: AlphaWebTrader HTF Charts
GLD Daily View
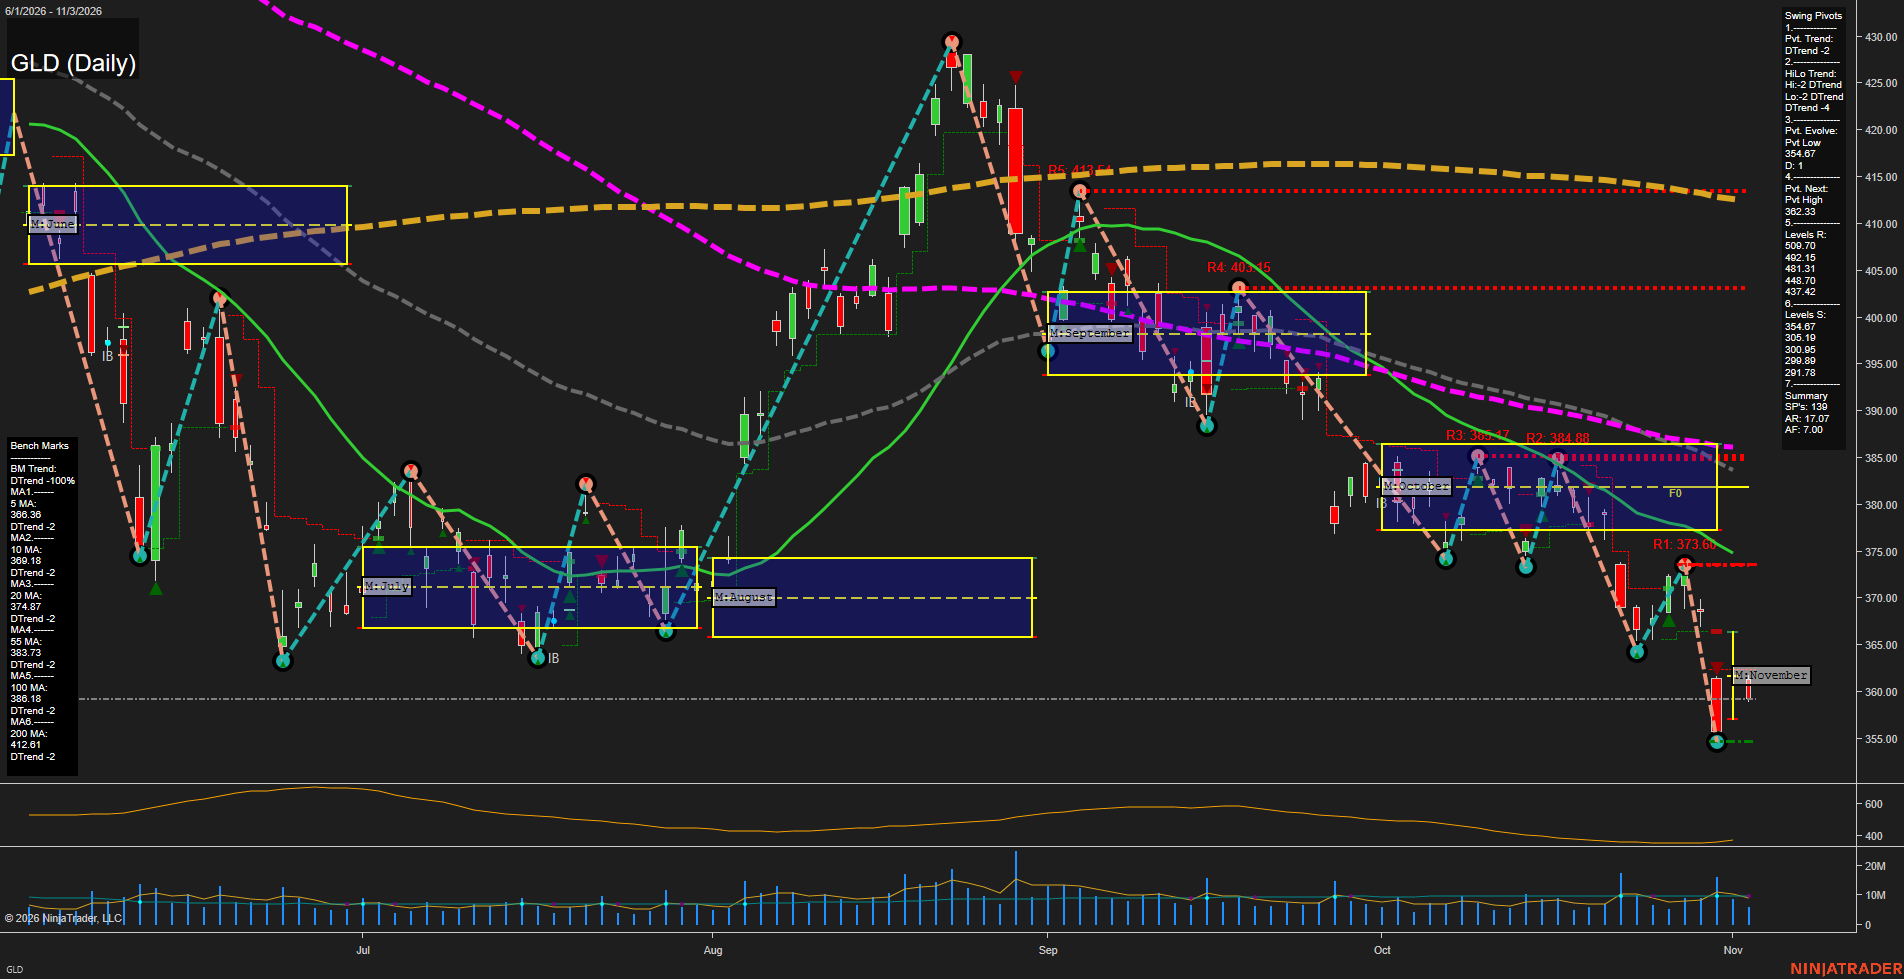
Overall Rating
- Short-Term: Bearish
- Intermediate-Term: Bearish
- Long-Term: Bearish.
Key Insights Summary
GLD reflects a broad futures-style liquidation structure: price is beneath every daily benchmark, all benchmark slopes are down, and both the short-term pivot trend and intermediate HiLo trend remain in DTrend. The decline from the October rebound has produced lower highs and lower lows, with momentum accelerating into the 356.17 pivot low area. The 373.60 pivot-next level defines the nearby countertrend reversal threshold, while the 364.67 area is the closest prior support reference now overhead after the breakdown. The November monthly grid is newly established around current pricing, showing a reset period following a sharp downside expansion. Elevated ATR conditions and firm volume activity characterize a volatile directional decline rather than a stable consolidation.
View charts on: AlphaWebTrader HTF Charts
GC Daily View
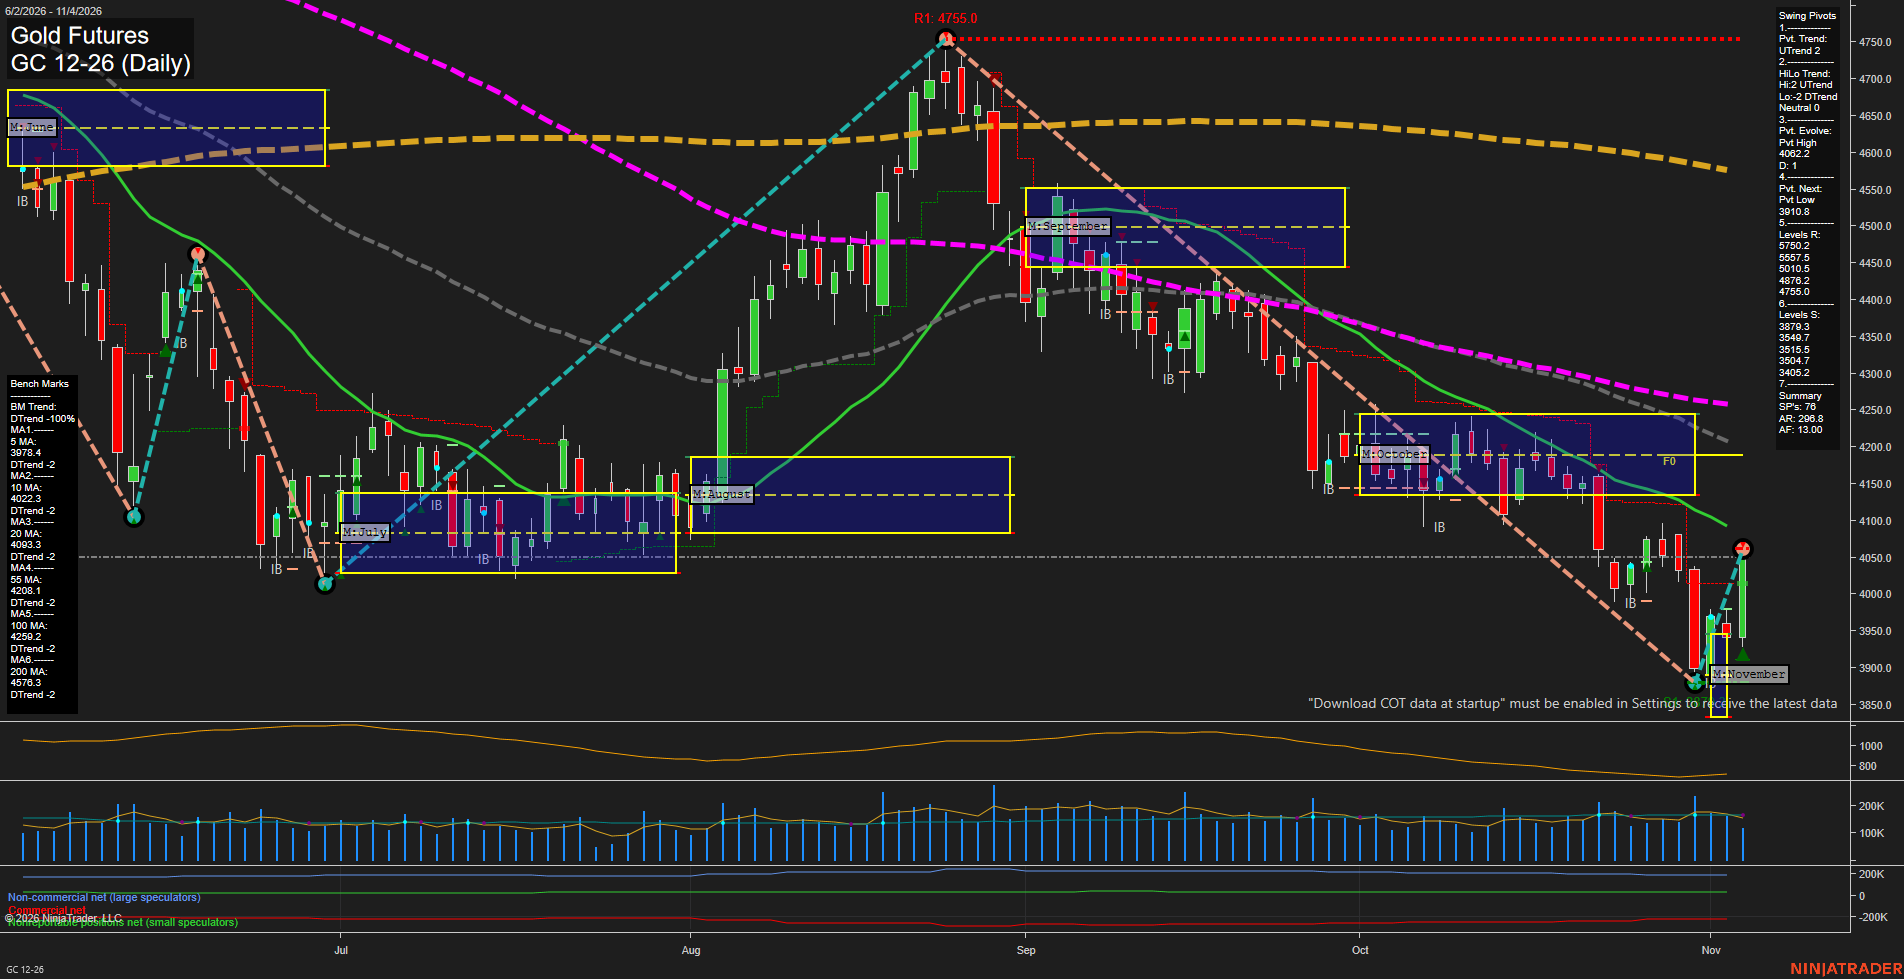
Overall Rating
- Short-Term: Neutral
- Intermediate-Term: Bearish
- Long-Term: Bearish.
Key Insights Summary
Price is staging a sharp V-shaped rebound from the 3879.3 swing-support area, producing a short-term UTrend and a fast recovery in momentum. The rebound has lifted price above the 5-day and 10-day benchmarks, but price remains beneath the declining 20-, 55-, 100-, and 200-day averages, preserving a broader bearish moving-average structure. The November MSFG remains below its F0% area, while the weekly structure and newly formed pivot sequence reflect counter-trend strength. The 4062.2 evolving pivot high and nearby 4093.3 20-day average form the immediate technical test zone; failure to sustain the rebound would retain focus on 3910.8 and 3879.3 support. Elevated ATR conditions indicate wide daily ranges and an active, volatile swing environment.
View charts on: AlphaWebTrader HTF Charts
ZB Daily View
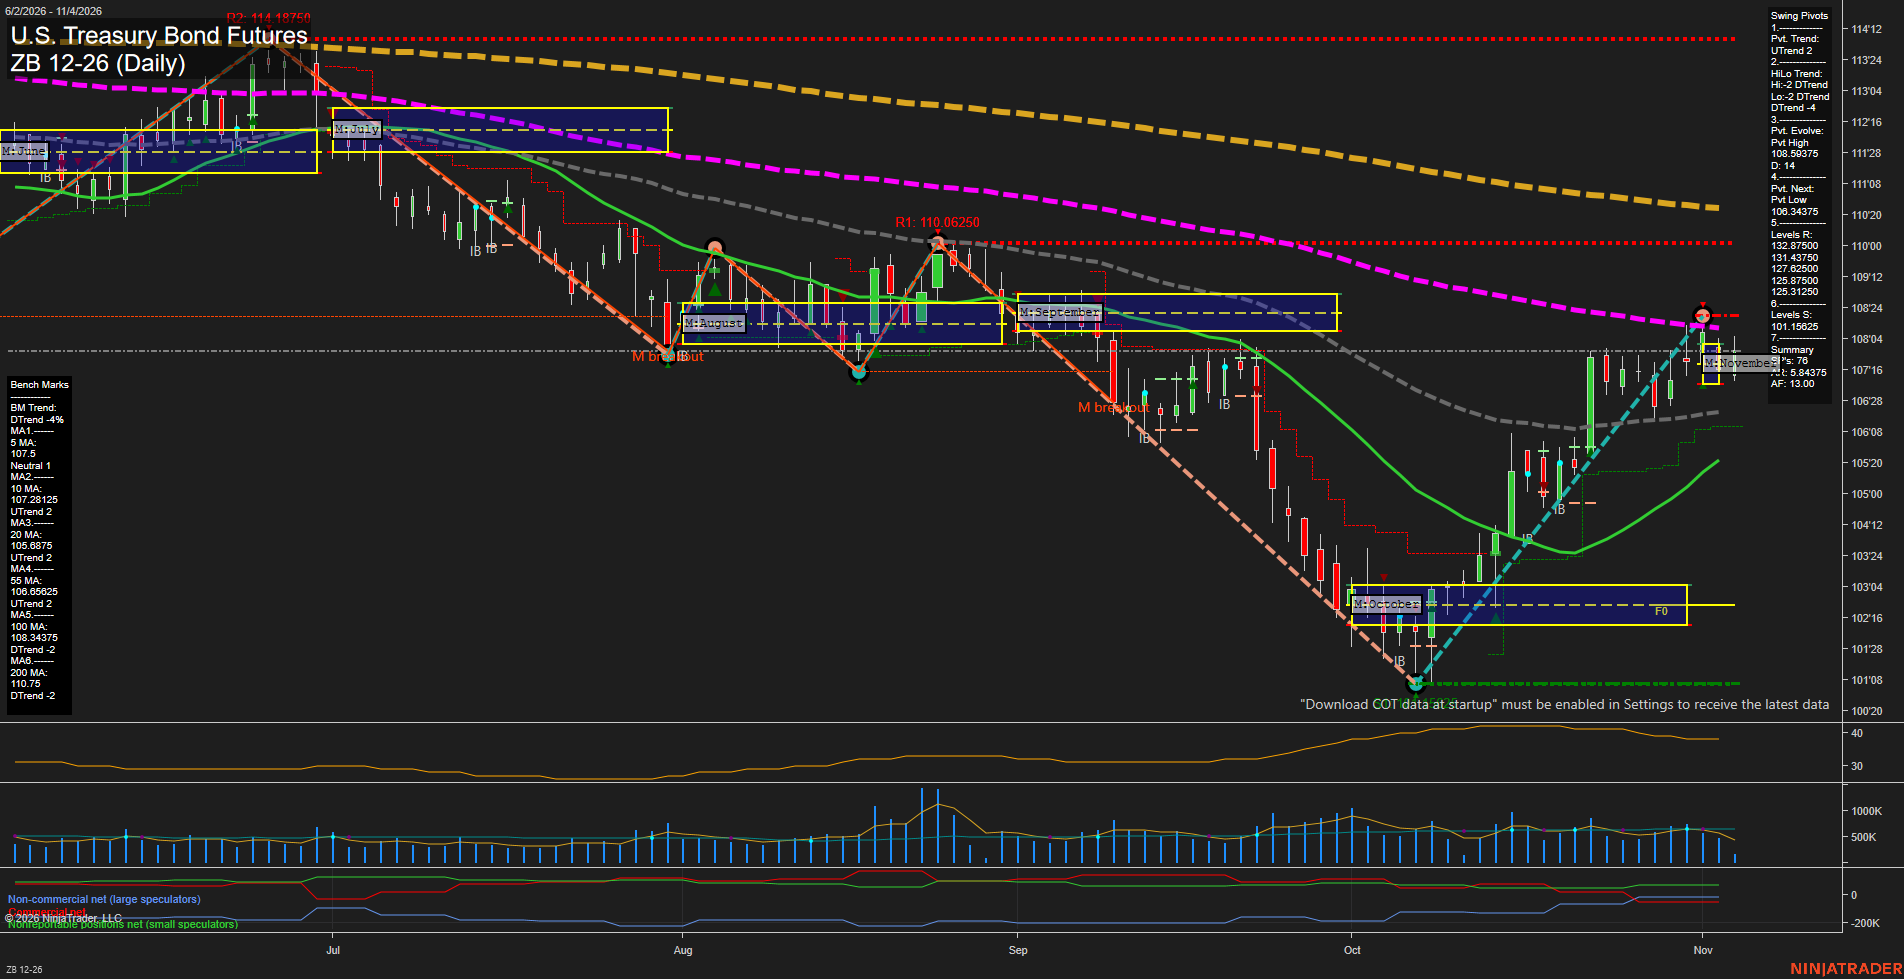
Overall Rating
- Short-Term: Bullish
- Intermediate-Term: Bullish
- Long-Term: Bearish.
Key Insights Summary
Price is consolidating near 107'16 after a sharp October recovery from the 101 area. The short-term pivot structure remains upward and price holds above the rising 10-, 20-, and 55-day benchmarks, while the weekly and November fib grids remain positive. The 108.9375 evolving pivot high is the nearby recovery ceiling, with 106.34375 defining the next short-term downside pivot threshold. Intermediate conditions reflect a countertrend recovery within a broader declining structure: the HiLo trend remains down and price is still below declining 100- and 200-day averages. Small daily bars and moderating momentum indicate a pause and compression following the rally rather than a broad long-term trend reversal.
View charts on: AlphaWebTrader HTF Charts
Sentiment Summary: Coverage was neutral-led (43%) with a slight negative bias, reflecting AI spending, debt and margin concerns alongside regulatory uncertainty after Democrats’ November 3 congressional sweep. Early November 4 index-futures losses later gave way to reported market gains, while Tesla and AI data-center shares weakened and renewables rose. Strong cloud growth and rebounding chip stocks provided counterweights to concerns over hyperscaler cash flow and Apple’s higher memory costs.
Conclusion: Sector divergence defines the post-election context, with Friday, November 6 payrolls still ahead as a reported catalyst for repricing rate-hike expectations.