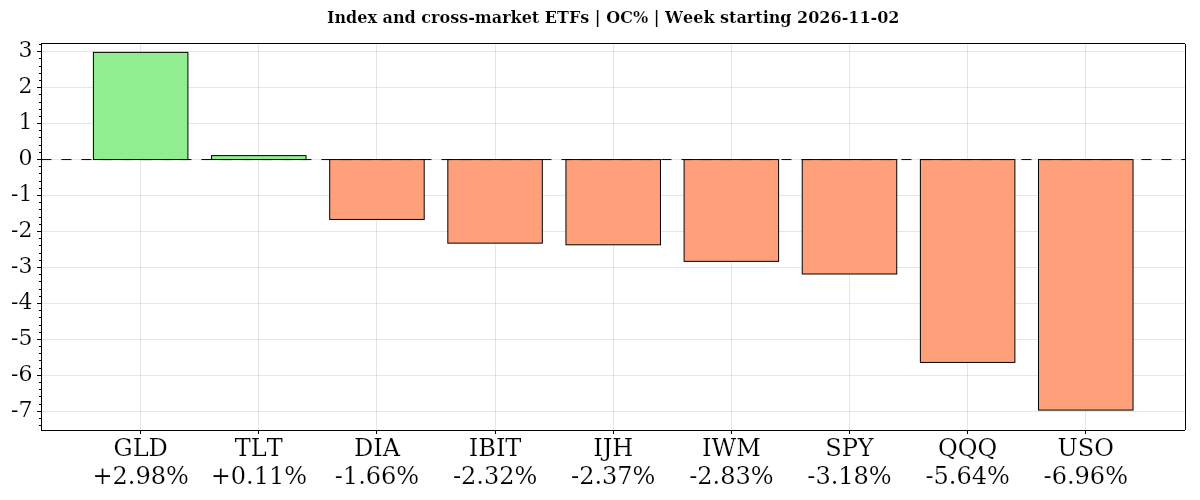
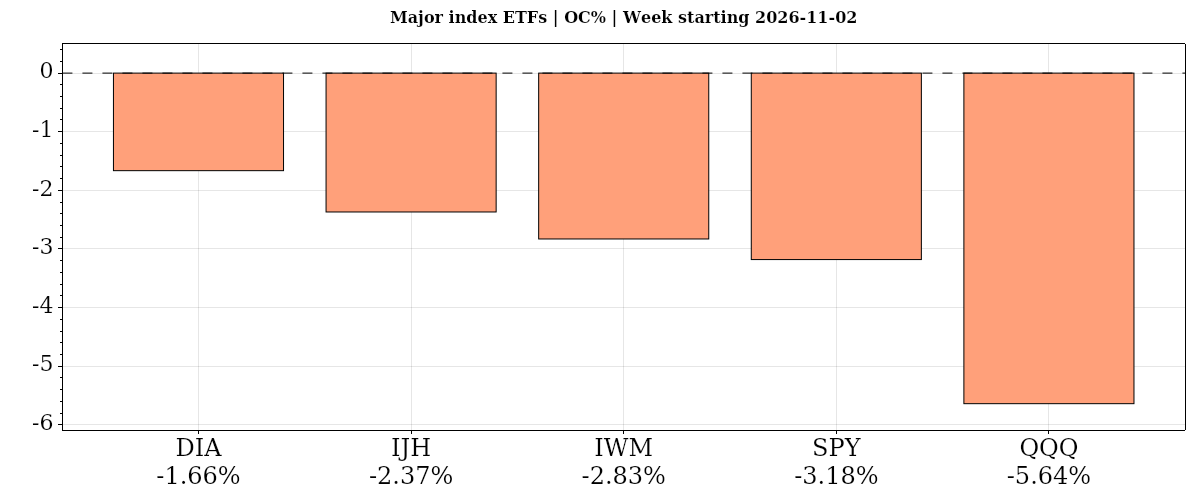
Technology-led selling left equities lower for the week despite intermittent rebounds. QQQ fell 4.98% and SPY lost 2.70%, while DIA declined a milder 0.95%. Concerns about AI spending, profitability and post-election constraints on data-center construction dominated. Cross-market divergence was pronounced: USO plunged 12.10%, GLD gained 4.71% and TLT edged up 0.10%.
Fundamentals: Stocks and technology ended the week lower despite Friday’s rebound, with near-term equity futures trends still bearish. AI spending concerns and post-election data-center restrictions weighed on tech. Oil fell as investors reassessed U.S. policy toward Iran after Democrats won Congress; gold and bonds rose. Earnings positioning featured Apple and chipmakers, while Friday’s released jobs report showed 165,000 payroll gains and 4.1% unemployment.
Technicals: The S&P 500 and Nasdaq 100 finished the week bearish, falling 2.70% and 4.98%, respectively. Amazon led the listed stock gainers with a bullish rating and a 7.88% rise, while bearish Tesla and Nvidia lost 10.40% and 8.80%. Oil was bearish after a 12.10% decline, contrasting with bullish gold, up 4.71%, and far-term Treasuries, up 0.10%.
Weekly Market Recap: weekly ETF and stock performance, daily session commentary, economic releases, earnings and market news, with a whole-week summary.
As of: November 7, 2026 11:30 CT
Earnings Radar Week Recap
Monitoring for earnings releases by the Magnificent 7, AI-tech-related firms, and major financial institutions.
| Date/Day | Impact | Company / Symbol | Time | EPS | Revenue | ||||||||
|---|---|---|---|---|---|---|---|---|---|---|---|---|---|
| 2026-11-02 – Monday | High | Apple (AAPL) | After close |
|
| ||||||||
| 2026-11-03 – Tuesday | Medium | Advanced Micro Devices (AMD) | After close |
|
| ||||||||
| 2026-11-03 – Tuesday | Medium | Arista Networks (ANET) | After close |
|
| ||||||||
| 2026-11-03 – Tuesday | Medium | Super Micro Computer (SMCI) | After close |
|
| ||||||||
| 2026-11-04 – Wednesday | Medium | Riot Platforms (RIOT) | Before open |
|
| ||||||||
| 2026-11-05 – Thursday | Medium | Microchip Technology (MCHP) | After close |
|
|
For full details visit: Yahoo Earnings Calendar
EcoNews Radar U.S. Events Week Recap
| Date | Impact | Event, Prev, Forecast, Actual | Info |
|---|---|---|---|
| 2026-11-02 Monday 10:00 | Medium | ISM Manufacturing PMI Prev: 54.5 Forecast: 54.5 Actual: 55.5 | Surveys factory activity across production, orders and employment; traders monitor it for growth signals that inform earnings and interest-rate expectations. |
| 2026-11-03 Tuesday 10:00 | Medium | JOLTS Job Openings Prev: 7.08M Forecast: 7.15M Actual: 7.52M | Counts unfilled positions employers are actively recruiting for; traders use it to assess labor demand, wage pressure and the monetary-policy outlook. |
| 2026-11-03 Tuesday 10:16 | High | Congressional Elections Prev: — Forecast: — Actual: — | Determines the composition of the federal legislature; traders monitor implications for taxation, spending, regulation and corporate earnings. |
| 2026-11-04 Wednesday 08:15 | High | ADP Employment Change Prev: 90K Forecast: 69K Actual: 86K | Estimates changes in private-sector employment from payroll records; traders monitor hiring momentum for clues about economic growth and monetary policy. |
| 2026-11-04 Wednesday 09:45 | Medium | S&P Global Composite PMI Prev: 57.6 Forecast: 57.6 Actual: 55.9 | Combines manufacturing and services survey activity; traders use it to assess broad business momentum and potential implications for corporate earnings. |
| 2026-11-04 Wednesday 10:00 | High | ISM Services PMI Prev: 54.9 Forecast: 54.8 Actual: 54.5 | Surveys activity across service industries; traders monitor this broad economic segment for growth, inflation and interest-rate implications. |
| 2026-11-04 Wednesday 10:00 | Medium | ISM Services Employment Index Prev: 50.1 Forecast: — Actual: 51.4 | Tracks whether service-sector businesses report expanding or contracting staffing; traders monitor it for hiring momentum and labor-market conditions. |
| 2026-11-04 Wednesday 10:00 | Medium | ISM Services New Orders Index Prev: 59.8 Forecast: — Actual: 55.9 | Tracks incoming business at service-sector companies; traders monitor it as a signal of future activity and revenue demand. |
| 2026-11-04 Wednesday 10:00 | Medium | ISM Services Prices Paid Prev: 74.0 Forecast: — Actual: 73.0 | Tracks changes in input prices reported by service businesses; traders watch it for inflation pressure that may influence margins and monetary policy. |
| 2026-11-04 Wednesday 10:30 | Low | EIA Crude Oil Stocks Change Prev: -1.89M Forecast: 0.90M Actual: -0.86M | Measures the weekly change in commercial crude inventories; traders monitor petroleum supply-demand conditions and their implications for energy shares and inflation. |
| 2026-11-05 Thursday 05:30 | Medium | Challenger Job Cuts Prev: 43K Forecast: — Actual: 44K | Tallies announced job reductions by employers; traders monitor it for signs of weakening labor demand, while recognizing announcements do not necessarily represent immediate layoffs. |
| 2026-11-05 Thursday 08:30 | Medium | Initial Jobless Claims Prev: 194K Forecast: 196K Actual: 189K | Counts new applications for unemployment benefits; traders monitor this timely gauge of layoffs for shifts in labor-market strength and interest-rate expectations. |
| 2026-11-05 Thursday 08:30 | Medium | Nonfarm Productivity Prev: 1.4 Forecast: 2.5 Actual: 3.6 | Measures output per hour worked in the nonfarm business sector; traders watch efficiency trends for implications for profit margins and sustainable wage growth. |
| 2026-11-05 Thursday 08:30 | Medium | Unit Labor Costs Prev: 1.2 Forecast: 0.6 Actual: -0.7 | Measures labor compensation per unit of output; traders monitor it for wage-related inflation pressure and corporate margin implications. |
| 2026-11-05 Thursday 08:50 | Medium | Fed's Hammack speech Prev: — Forecast: — Actual: — | Offers central-bank commentary on economic conditions and policy; traders watch for signals that could reshape interest-rate expectations and equity valuations. |
| 2026-11-05 Thursday 10:00 | Medium | Fed's Barkin speech Prev: — Forecast: — Actual: — | Provides a policymaker's assessment of growth, inflation and monetary policy; traders monitor any guidance relevant to the expected path of interest rates. |
| 2026-11-05 Thursday 11:30 | Medium | 4-Week Bill Auction · $115B Prev: 3.91% Forecast: — Actual: 3.89% | Reports pricing and demand for short-term government financing; traders monitor funding conditions and money-market yields that help frame broader financial conditions. |
| 2026-11-05 Thursday 11:30 | Medium | 8-Week Bill Auction · $110B Prev: — Forecast: — Actual: — | Reveals investor demand and borrowing costs for short-dated government debt; traders watch for signals about liquidity and near-term funding conditions. |
| 2026-11-06 Friday 04:30 | Medium | Fed's Williams speech Prev: — Forecast: — Actual: — | Provides central-bank views on the economy and policy outlook; traders monitor commentary for implications for expected interest rates and equity discount rates. |
| 2026-11-06 Friday 08:30 | High | Average Hourly Earnings (MoM) Prev: 0.10% Forecast: 0.30% Actual: 0.40% | Measures monthly changes in workers' average hourly pay; traders monitor near-term wage pressure for implications for consumption, inflation and monetary policy. |
| 2026-11-06 Friday 08:30 | High | Nonfarm Payrolls Prev: 29K Forecast: 65K Actual: 165K | Measures the change in employment outside agriculture; traders monitor hiring strength as a major signal of growth, household income and the interest-rate outlook. |
| 2026-11-06 Friday 08:30 | High | Unemployment Rate Prev: 4.2% Forecast: 4.2% Actual: 4.1% | Measures the share of the labor force without work and actively seeking employment; traders use it to assess labor-market slack and monetary-policy implications. |
| 2026-11-06 Friday 08:30 | High | Average Hourly Earnings (YoY) Prev: 3.0% Forecast: 2.9% Actual: 3.1% | Measures annual growth in workers' average hourly pay; traders monitor the underlying wage trend for implications for household purchasing power, inflation and corporate costs. |
| 2026-11-06 Friday 08:30 | Medium | Labor Force Participation Rate Prev: 61.8% Forecast: — Actual: 61.9% | Measures the share of the civilian noninstitutional population working or seeking work; traders monitor labor supply and context for changes in unemployment. |
| 2026-11-06 Friday 08:30 | Medium | U6 Underemployment Rate Prev: 7.6% Forecast: — Actual: 7.9% | Includes unemployed people, marginally attached workers and those working part-time for economic reasons; traders monitor this broader measure of labor-market underutilization. |
| 2026-11-06 Friday 09:30 | Medium | Fed's Musalem speech Prev: — Forecast: — Actual: — | Offers a policymaker's perspective on economic conditions and monetary policy; traders monitor potential changes in the policy outlook that could affect rates and equity valuations. |
| 2026-11-06 Friday 10:00 | High | Michigan Consumer Sentiment Index Prev: 48 Forecast: 48 Actual: 51 | Surveys household attitudes toward personal finances and economic conditions; traders watch for signals about consumer spending, a key driver of corporate revenues. |
| 2026-11-06 Friday 10:00 | Medium | UoM 1-year Consumer Inflation Expectations Prev: 4.7 Forecast: — Actual: 4.3 | Measures households' expected inflation over the coming year; traders monitor near-term price perceptions for implications for spending behavior and monetary-policy expectations. |
| 2026-11-06 Friday 10:00 | Medium | Michigan Consumer Expectations Index Prev: 48.8 Forecast: — Actual: 50.9 | Measures households' outlook for finances and business conditions; traders monitor forward-looking confidence for clues about future consumer demand. |
| 2026-11-06 Friday 10:00 | Medium | UoM 5-year Consumer Inflation Expectation Prev: 3.5 Forecast: — Actual: 3.4 | Measures households' longer-run inflation expectations; traders watch whether expectations remain anchored, an important consideration for monetary policy and bond yields. |
| 2026-11-06 Friday 12:15 | Medium | Fed's Bowman speech Prev: — Forecast: — Actual: — | Provides central-bank commentary on economic risks and policy; traders monitor any guidance that could influence interest-rate expectations and equity valuations. |
| 2026-11-06 Friday 13:00 | Medium | Fed's Daly speech Prev: — Forecast: — Actual: — | Offers a policymaker's assessment of the economic and inflation outlook; traders watch for policy signals relevant to financing costs and equity discount rates. |
Summary: The calendar centers on U.S. labor conditions and the monetary-policy outlook, alongside business activity, household attitudes and political developments.
Conclusion: Friday contains the densest cluster of closely watched releases.
Market Technical Analysis
Analysis of completed-week VIX volatility, major ETFs and mega-cap tech stocks, futures snapshots, higher-time-frame analysis and weekly charts.
VIX — Market Fear Gauge Weekly
| Level | Open | High | MaxVix | Low | MinVix | WNC% | WOC% | VR | MaxVR | MinVR |
|---|---|---|---|---|---|---|---|---|---|---|
| 25.63 | 19.05 | 28.36 | 23.93 | 16.57 | 13.80 | +35.18% | +34.54% | 13.01 | 17.64 | -19.11 |
VIX rose 35.18% versus the previous weekly close. Open-to-close change: 34.54%. VIX is above the recent 12-week range (13.80–23.93).
VR: Weekly VR: Stocks fell while expected volatility rose. VR is in the upper part of its preceding 12-week VR range (-19.11 to 17.64), in the 80–90% band. VR rose 13.48 points from the previous week, a large shift relative to that range.
Range lookback: preceding 12 completed weeks.
Major ETFs and Mega Cap Tech Stocks Weekly
ETF, Mag7, and Cross-Market ETF Weekly Insights
Overall Tone
Risk tone was weak for the completed week beginning 2026-11-02, with declines from the week open dominating equity breadth.
| Instrument | Bias | Date | WNC% | WOC% | O | H | L | C | VWAP | Vol | Mon | Tue | Wed | Thu | Fri |
|---|---|---|---|---|---|---|---|---|---|---|---|---|---|---|---|
| ▼ DIA | ▼ ▼ ▼ | 2026-11-02 | ▼ -0.95% | ▼ -1.66% | 520.89 | 536.60 | 508.66 | 512.22 | ▼ 521.37 | 28,702,314 | +0.43% | -0.44% | +3.10% | -3.53% | -0.40% |
| ▼ IJH | ▼ ▼ ▼ | 2026-11-02 | ▼ -1.66% | ▼ -2.37% | 73.86 | 75.18 | 71.31 | 72.11 | ▼ 73.32 | 50,570,270 | +0.80% | +0.28% | +0.62% | -3.90% | +0.60% |
| ▼ IWM | ▼ ▼ ▼ | 2026-11-02 | ▼ -2.03% | ▼ -2.83% | 281.64 | 286.17 | 270.23 | 273.67 | ▼ 278.11 | 152,545,636 | -0.07% | +0.23% | +1.51% | -4.59% | +0.99% |
| ▼ SPY | ▼ ▼ ▼ | 2026-11-02 | ▼ -2.70% | ▼ -3.18% | 759.45 | 775.64 | 732.71 | 735.29 | ▼ 749.43 | 329,944,936 | -0.48% | +0.30% | +1.65% | -4.41% | +0.31% |
| ▼ QQQ | ▼ ▼ ▼ | 2026-11-02 | ▼ -4.98% | ▼ -5.64% | 695.32 | 701.45 | 647.05 | 656.10 | ▼ 671.82 | 360,030,338 | -1.36% | +0.62% | +0.97% | -6.49% | +1.40% |
| AVG/Sum | — | — | -2.46% | -3.14% | — | — | — | — | — | 921,793,494 | -0.14% | +0.20% | +1.57% | -4.58% | +0.58% |
DIA · W:2026-11-02 NC% ▼ -0.95% OC% ▼ -1.66%
DIA – Dow Jones Technicals Summary
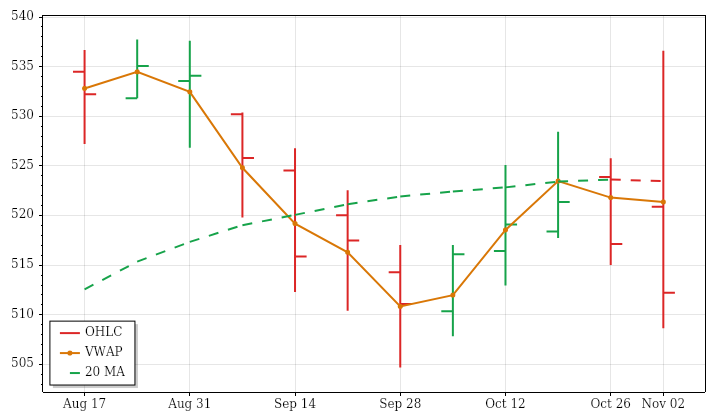
DIA’s completed week beginning November 2, 2026 finished at 512.22, down 0.95% from the prior weekly close and 1.66% from the open. An opening gap up was filled, and an outside bar ultimately closed below the previous week’s low. The range reached roughly 2.7 times its prior 12-week average, with markedly above-average volume, extending the lookback pattern of expanding ranges and rising activity.
This weakness aligned with the near-term downtrend and the broader 12-week price decline, but conflicted with still-rising intermediate- and far-term averages. Price remained only slightly above the intermediate benchmark, making the separation between shorter-term weakness and longer-term strength narrow at that horizon. The close was well below weekly VWAP. PSAR still indicated an uptrend despite the weak price action; a next-week low below 507.4231 would trigger a bearish reversal.
IJH · W:2026-11-02 NC% ▼ -1.66% OC% ▼ -2.37%
IJH – Mid Cap Technicals Summary
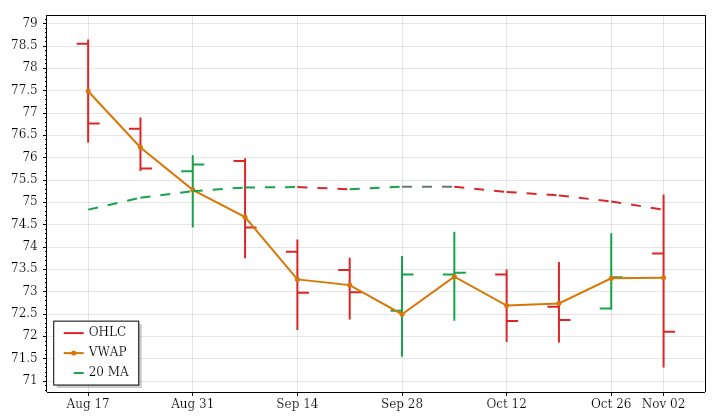
IJH’s completed week beginning November 2, 2026 finished at 72.11, losing 1.66% from the prior weekly close and 2.37% from the open. Its opening gap up was filled, and an outside bar ended below the previous week’s low. Price also closed clearly below weekly VWAP. A range more than twice the prior 12-week average and substantially elevated volume extended the existing trends toward expanding ranges and increasing participation.
The latest weakness aligned with both the near-term and far-term downtrends. The intermediate picture was less uniform: its average still rose, but price closed below it, leaving that horizon mixed rather than positive. The completed decline also fit the broader 12-week price downtrend. PSAR was in a short state, consistent with the weak price structure; a next-week high above 75.18 would trigger a bullish reversal, not confirm one in advance.
IWM · W:2026-11-02 NC% ▼ -2.03% OC% ▼ -2.83%
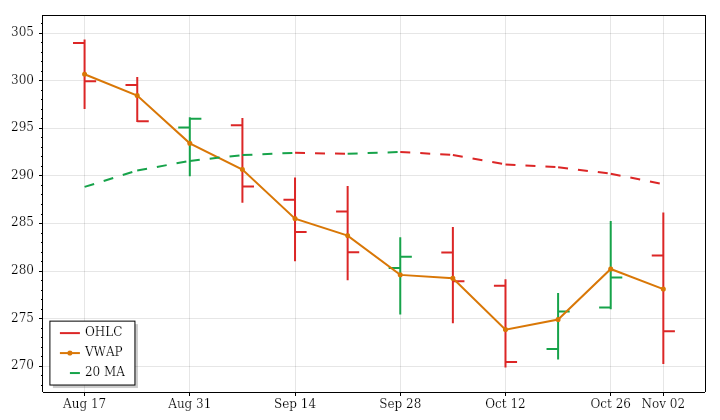
IWM – Small Cap Technicals Summary
IWM’s completed week beginning November 2, 2026 closed at 273.67, down 2.03% from the prior weekly close and 2.83% from the open. The opening gap up was filled, and an outside bar finished below the previous week’s low. The close below weekly VWAP reinforced the weak finish. Range was approximately twice the prior 12-week average, with above-average volume, continuing the lookback pattern of expanding ranges and increasing activity.
The loss aligned with the near-term downtrend and the 12-week price decline. Intermediate conditions remained mixed because price was below a still-rising average, while the far-term uptrend persisted beneath price. That separation left shorter-term weakness within a positive longer-term structure. PSAR still showed an uptrend despite the completed week’s deterioration; a next-week low below 270.23 would trigger a bearish reversal rather than represent an already-confirmed signal.
SPY · W:2026-11-02 NC% ▼ -2.70% OC% ▼ -3.18%
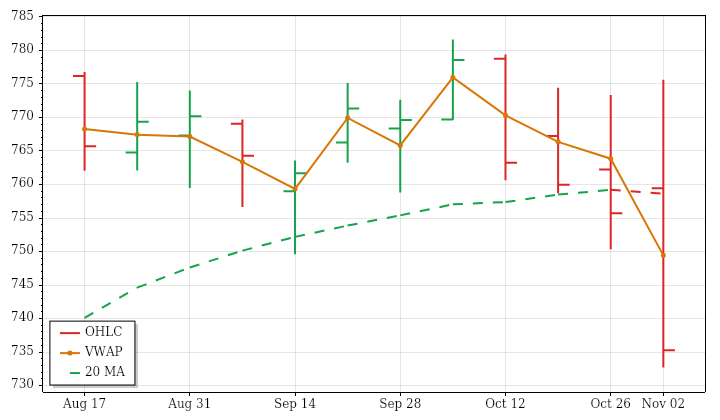
SPY – S&P 500 Technicals Summary
SPY’s completed week beginning November 2, 2026 ended at 735.29, losing 2.70% from the prior weekly close and 3.18% from the open. The opening gap up was filled, and an outside bar finished below the previous week’s low, close to its own low. Price also closed well below weekly VWAP. The range was nearly three times the prior 12-week average, accompanied by substantially above-average volume and a fourth consecutive large-range week.
The decline left price below still-rising near- and intermediate-term averages, creating mixed conditions at those horizons rather than fully aligned downtrends. The far-term uptrend remained positive. Meanwhile, the 12-week price trend was slightly negative, with expanding ranges and increasing volume. A fresh bearish ATR-median crossover reinforced the current bearish PSAR state. A next-week high above 779.1745 would trigger a bullish PSAR reversal, but no such reversal was confirmed.
S&P 500 News and Fundamentals
The S&P 500 fell 4.36% on November 5 after starting less than 2% below its October 6 record close. The decline followed Wednesday’s post-election rally and left the index experiencing its largest drawdown since the start of the Iran war. Nvidia, Microsoft, Apple, Amazon, Alphabet and Meta together represented 30.8% of the index in early November.
QQQ · W:2026-11-02 NC% ▼ -4.98% OC% ▼ -5.64%
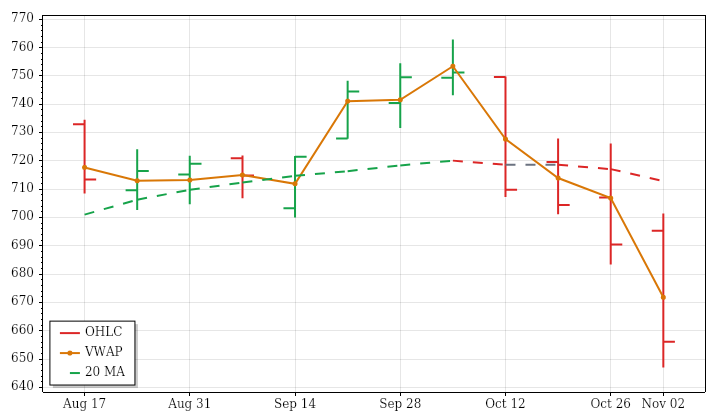
QQQ – Nasdaq 100 Technicals Summary
QQQ’s completed week beginning November 2, 2026 closed at 656.10, down 4.98% from the prior weekly close and 5.64% from the open. An opening gap up was filled, and the week formed a lower high and lower low before closing below the previous week’s low. The finish below weekly VWAP reinforced the decline. Range exceeded twice the prior 12-week average, as did volume, extending established trends of expanding ranges and increasing activity.
The near- and intermediate-term averages were still rising, but price stood below both, leaving those horizons mixed. The far-term uptrend remained intact, while the broader 12-week price trend was slightly negative. A fresh bearish ATR-median crossover added to the existing bearish PSAR state, showing deterioration despite the longer-term structure. A next-week high above 736.3786 would trigger a bullish PSAR reversal; that possibility was not yet confirmed.
Nasdaq 100 News and Fundamentals
The Nasdaq 100 entered a correction after falling more than 10% from its October highs, reaching its lowest level since July 31, according to November 3 reporting. Concerns about the artificial-intelligence industry accompanied the decline, with semiconductor weakness contributing to a late-session reversal. QQQ subsequently rose on Wednesday, November 4, as investors bought initial weakness following the midterm elections.
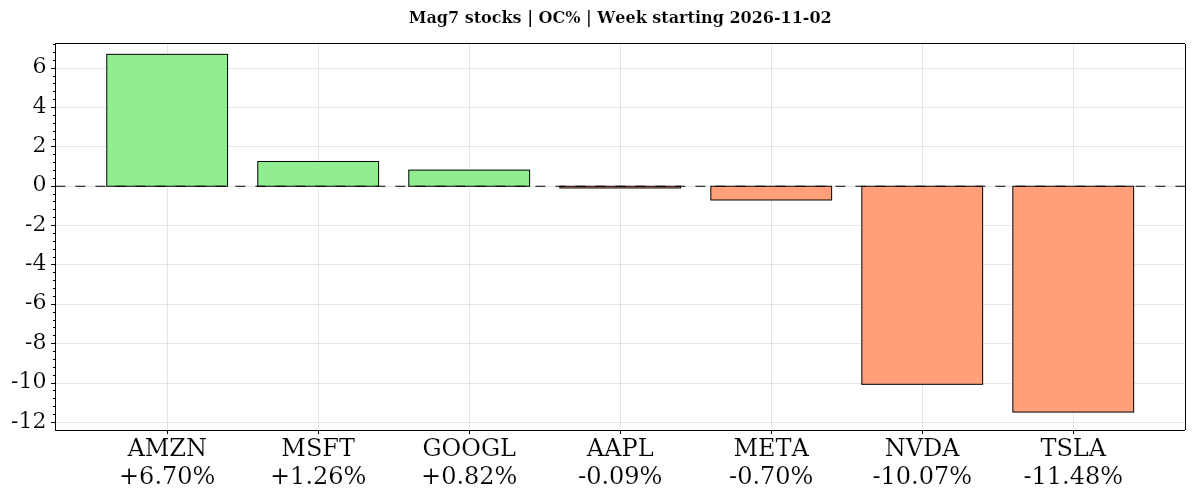
| Instrument | Bias | Date | WNC% | WOC% | O | H | L | C | VWAP | Vol | Mon | Tue | Wed | Thu | Fri |
|---|---|---|---|---|---|---|---|---|---|---|---|---|---|---|---|
| ▲ AMZN | ▲ ▲ ▼ | 2026-11-02 | ▲ +7.88% | ▲ +6.70% | 243.01 | 273.23 | 242.28 | 259.30 | ▼ 259.41 | 316,557,325 | +2.20% | +2.06% | +6.12% | -2.19% | -0.35% |
| ▲ GOOGL | ▲ ▲ ▼ | 2026-11-02 | ▲ +1.77% | ▲ +0.82% | 282.46 | 296.49 | 277.07 | 284.78 | ▼ 285.05 | 225,540,509 | -0.30% | +0.37% | +3.18% | -2.20% | +0.78% |
| ▲ MSFT | ▲ ▲ ▼ | 2026-11-02 | ▲ +1.67% | ▲ +1.26% | 524.01 | 559.15 | 504.96 | 530.61 | ▼ 535.81 | 174,743,702 | -2.83% | +2.74% | +6.68% | -3.58% | -0.99% |
| ▼ AAPL | ▼ ▼ ▼ | 2026-11-02 | ▼ -0.66% | ▼ -0.09% | 342.67 | 355.38 | 325.33 | 342.37 | ▼ 342.90 | 337,122,546 | -1.83% | -1.90% | +5.31% | -1.53% | -0.52% |
| ▼ META | ▼ ▼ ▼ | 2026-11-02 | ▼ -0.79% | ▼ -0.70% | 614.44 | 643.09 | 583.80 | 610.15 | ▼ 617.57 | 110,209,863 | -1.34% | +2.36% | +1.44% | -3.96% | +0.84% |
| ▼ NVDA | ▼ ▼ ▼ | 2026-11-02 | ▼ -8.80% | ▼ -10.07% | 207.53 | 209.98 | 181.46 | 186.64 | ▼ 194.31 | 848,693,070 | -1.26% | +2.29% | -3.17% | -9.26% | +2.78% |
| ▼ TSLA | ▼ ▼ ▼ | 2026-11-02 | ▼ -10.40% | ▼ -11.48% | 404.66 | 414.23 | 338.15 | 358.22 | ▼ 373.80 | 234,980,767 | +1.00% | -1.32% | -3.34% | -10.77% | +4.23% |
| AVG/Sum | — | — | -1.33% | -1.93% | — | — | — | — | — | 2,247,847,782 | -0.62% | +0.94% | +2.32% | -4.78% | +0.97% |
Mag7 Stocks
Negative confluence: average WOC% -1.94% from the week open; WNC% -1.33% versus the prior weekly close. Amazon led both comparisons, while Tesla lagged, followed by Nvidia; Apple was nearly flat from the open. Microsoft retained aligned moving-average uptrends, but all seven stocks closed below weekly VWAP.
AMZN · W:2026-11-02 NC% ▲ +7.88% OC% ▲ +6.70%
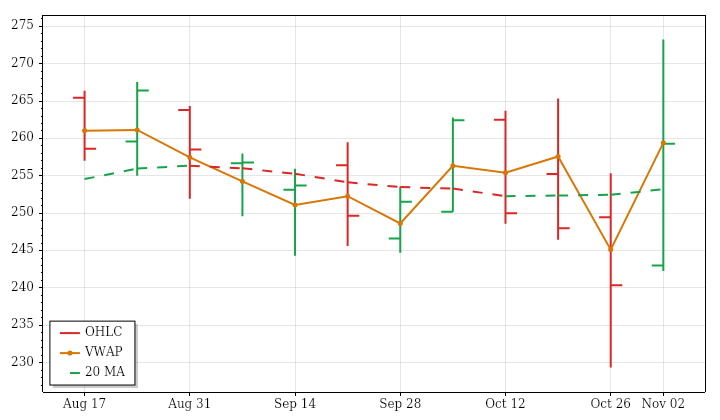
AMZN – Amazon Technicals Summary
AMZN’s completed week beginning November 2, 2026 closed at 259.30, gaining 7.88% from the prior weekly close and 6.70% from the open. The opening gap up remained unfilled, and price finished above the previous week’s high after making a higher high and higher low. A range more than twice the prior 12-week average and substantially elevated volume reinforced the scale of the advance, consistent with expanding ranges and increasing volume over that lookback.
The rebound challenged the 12-week price downtrend without fully resolving shorter-term weakness. Price moved above its near-term benchmark, but that average was still falling; intermediate- and far-term averages remained rising beneath price. The close was marginally below weekly VWAP, leaving some tension with the strong weekly return. PSAR remained bearish; a next-week high above 278.8137 would trigger a bullish reversal.
Amazon News and Fundamentals
Amazon posted its highest operating margin ever, and AWS recorded its fastest growth in nearly five years. On November 6, Amazon began letting a small invited group text its Alexa for Shopping agent to search, compare products and place orders. A new Uber Eats partnership gives Prime members delivery-fee-free restaurant orders of $25 or more through Amazon. Separately, unredacted details from an August FTC lawsuit alleged Amazon misled advertisers about the causes of advertising price increases.
GOOGL · W:2026-11-02 NC% ▲ +1.77% OC% ▲ +0.82%
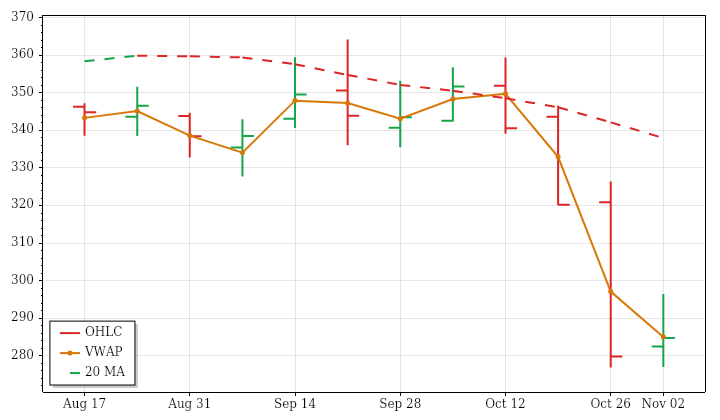
GOOGL – Alphabet Technicals Summary
GOOGL’s completed week beginning November 2, 2026 ended at 284.78, gaining 1.77% from the prior weekly close and 0.82% from the open. The opening gap up was filled, and price traded on both sides of the open within an inside bar. The close remained inside the previous week’s range and slightly below weekly VWAP, making the advance a contained rebound rather than a range breakout.
The near-term structure remained bearish, with price below a falling average. Intermediate conditions were mixed because price remained below a still-rising average, while the far-term uptrend remained intact. This left the latest gain at odds with the 12-week price decline. Weekly range was slightly below average despite expanding lookback ranges, whereas elevated volume continued the increasing-volume trend. PSAR remained bearish; a next-week high above 347.4156 would trigger a bullish reversal.
MSFT · W:2026-11-02 NC% ▲ +1.67% OC% ▲ +1.26%
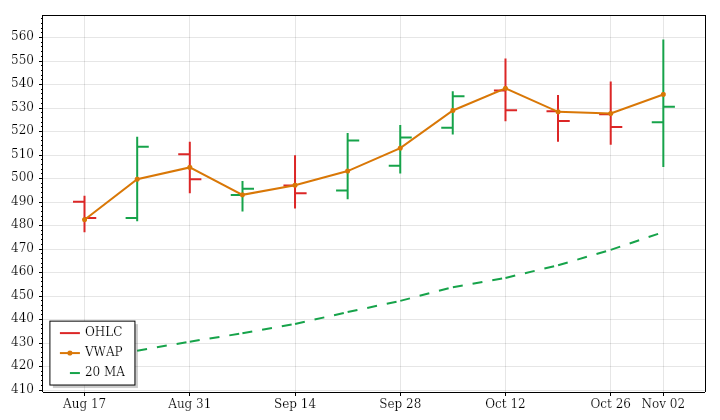
MSFT – Microsoft Technicals Summary
MSFT’s completed week beginning November 2, 2026 closed at 530.61, up 1.67% from the prior weekly close and 1.26% from the open. The opening gap up was filled, and an outside bar breached both prior-pattern boundaries before finishing inside the previous week’s range. The gain therefore came with considerable two-way movement rather than an uninterrupted advance. Price also finished below weekly VWAP, qualifying the positive weekly return.
Near-, intermediate- and far-term uptrends remained aligned, with price above rising averages across all three horizons. The 12-week price trend was likewise upward, although low directional efficiency indicated a choppy path. Weekly range was roughly 2.4 times average and volume was substantially elevated, exceeding the modest lookback increases in both measures. PSAR remained long; a next-week low below 504.96 would trigger a bearish reversal rather than an existing reversal signal.
Microsoft News and Fundamentals
Microsoft reported fiscal Q1 2027 revenue of $92.3 billion, up 19%, with Azure growing 48% and Microsoft Cloud revenue rising 30%, despite gross-margin compression. Sources said Microsoft plans to reduce its number of neocloud partners while retaining key suppliers and building its own infrastructure. The company also offered buyouts to about 60,000 employees. On November 6, anti-AI protesters entered its Amsterdam data-center construction site; activist group Geef Tegengas claimed responsibility.
AAPL · W:2026-11-02 NC% ▼ -0.66% OC% ▼ -0.09%
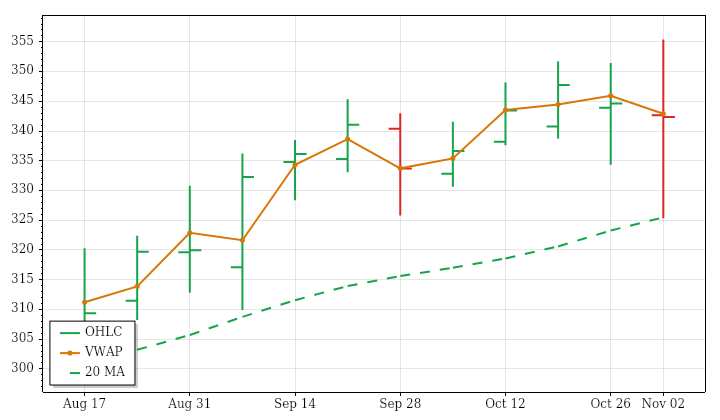
AAPL – Apple Technicals Summary
AAPL’s completed week beginning November 2, 2026 ended at 342.37, down 0.66% from the prior weekly close but only 0.09% from the open. The opening gap down was filled, and an outside bar took price above and below the open before finishing inside the previous week’s range. That small net change masked a weekly range roughly twice the prior 12-week average, accompanied by substantially above-average volume.
The decline ran against aligned near-, intermediate- and far-term uptrends, with price still above rising averages across all three horizons. It also contrasted with the lookback pattern of contracting ranges, although stronger volume continued the existing volume trend. The close slightly below weekly VWAP tempered the otherwise positive trend structure. PSAR remained long; a next-week low below 325.33 would trigger a bearish reversal, rather than one already being confirmed.
Apple News and Fundamentals
Apple reported record fourth-quarter revenue of $114.5 billion and 17% iPhone growth, while rising memory costs pressured margins. On November 5, it sought about $7 billion in bonds, partly to fund buybacks; Bloomberg Intelligence described the financing as opportunistic. Upcoming iOS 27.3 changes include Siri controlling apps and coordinating tasks across applications. Apple also said software support for its foldable iPhone Duo was improving after early reviews criticized the shortage of optimized apps.
META · W:2026-11-02 NC% ▼ -0.79% OC% ▼ -0.70%
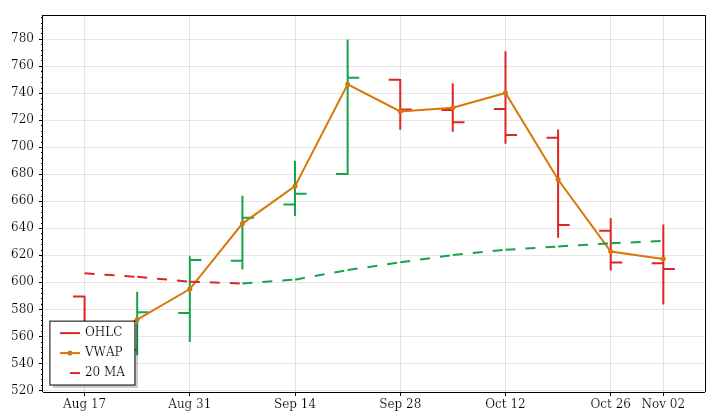
META – Meta Platforms Technicals Summary
META’s completed week beginning November 2, 2026 ended at 610.15, down 0.79% from the prior weekly close and 0.70% from the open. A small opening gap down was filled, but the week formed a lower high and lower low. Despite trading above and below the open, price finished close to its starting point and inside the previous week’s range. The close below weekly VWAP added a weaker element to that contained net move.
Near- and intermediate-term conditions were mixed: both averages were rising, but price remained below them. The far-term uptrend stayed intact. Although the 12-week price trend was positive, extremely low directional efficiency showed little net progress relative to the intervening movement. Range and volume were modestly above average, consistent with their rising lookback trends. PSAR remained bearish; a next-week high above 752.5304 would trigger a bullish reversal.
Meta News and Fundamentals
Meta reported negative free cash flow of $2.12 billion for Q3 2026. Price per ad rose 14%, while costs outpaced revenue for a fifth consecutive quarter; operating margin excluding a $9.89 billion legal charge was 35%. On November 5, Meta made Muse Voice calling and video chat available nationwide in the U.S., followed by Spaces for collaborating with Muse agents. President Dina Powell McCormick warned that Democratic election wins would make data-center construction harder.
NVDA · W:2026-11-02 NC% ▼ -8.80% OC% ▼ -10.07%
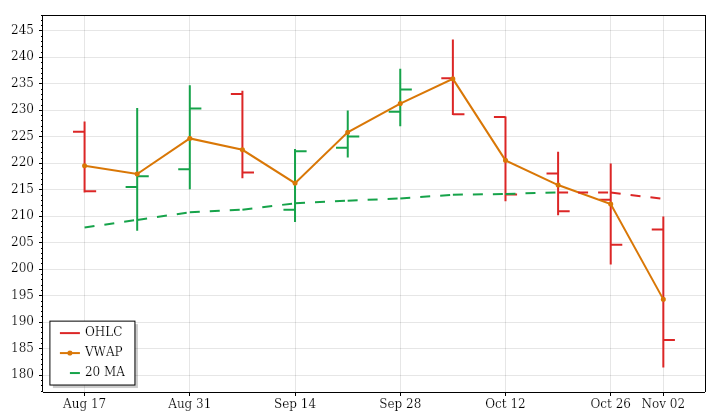
NVDA – Nvidia Technicals Summary
NVDA’s completed week beginning November 2, 2026 finished at 186.64, falling 8.80% from the prior weekly close and 10.07% from the open. The opening gap up was filled, followed by a lower high and lower low. Price closed below the previous week’s low and below weekly VWAP, giving the completed period a decisively weaker profile than the initially positive opening gap.
Price stood below the near-, intermediate- and far-term averages, even though all three averages were still rising. Consequently, each horizon was mixed rather than uniformly bearish, while the 12-week price trend was already downward. The weekly range approached twice its average and volume was markedly elevated, opposing lookback trends of contracting ranges and decreasing activity. The ATR-median measure entered a downtrend, adding to bearish PSAR conditions. A next-week high above 235.2689 would trigger a bullish PSAR reversal.
Nvidia News and Fundamentals
Nvidia is finding new ways to support neocloud providers as the industry faces growing pains. Its potential exposure could extend beyond supplying AI chips to responsibility for an entire data center.
TSLA · W:2026-11-02 NC% ▼ -10.40% OC% ▼ -11.48%
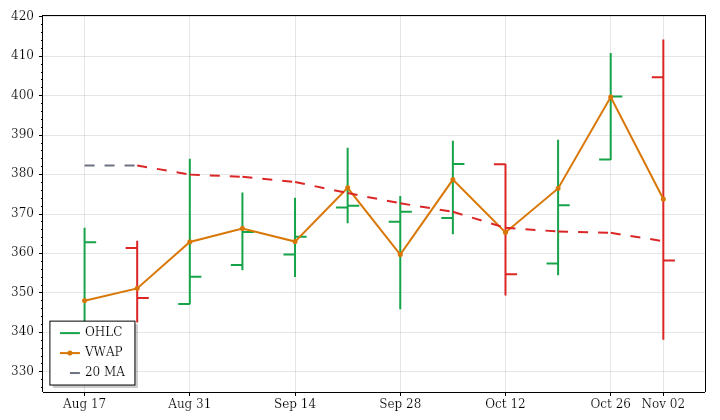
TSLA – Tesla Technicals Summary
TSLA’s completed week beginning November 2, 2026 finished at 358.22, down 10.40% from the prior weekly close and 11.48% from the open. The opening gap up was filled, and an outside bar ended below the previous week’s low and below weekly VWAP. Range reached roughly 2.8 times the prior 12-week average, accompanied by above-average volume. This fourth consecutive large-range week extended the lookback trends of expanding ranges and increasing activity.
The sharp decline conflicted with the positive 12-week price trend. Near-term conditions became mixed, with price below a still-rising average, while the intermediate downtrend aligned with the latest weakness. The far-term average remained rising beneath price, preserving longer-term strength without resolving the shorter-horizon deterioration. PSAR was in a short state despite a positive ATR-median trend. A next-week high above 414.23 would trigger a bullish PSAR reversal.
Tesla News and Fundamentals
Elon Musk said on November 6 that Tesla will wind down Cybertruck production at Gigafactory Texas around mid-2027 to make room for increased Cybercab robotaxi output. The shift follows Cybertruck sales falling 48% in 2025 and another 38% through September 2026, far below Musk’s original vision of 250,000 annually. The Cybercab expansion remains dependent on regulatory approval, customer demand and demonstrating viable robotaxi economics.
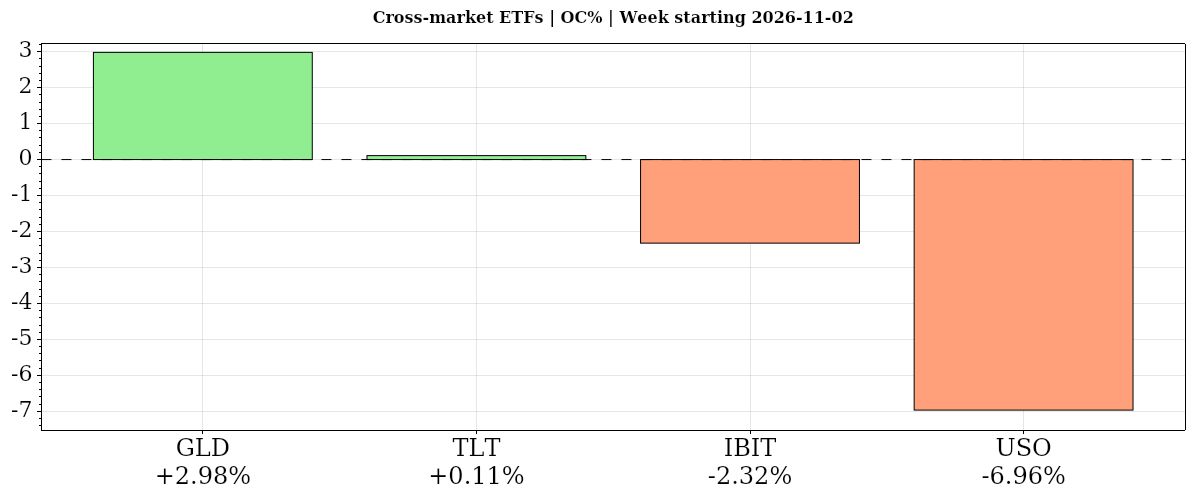
| Instrument | Bias | Date | WNC% | WOC% | O | H | L | C | VWAP | Vol | Mon | Tue | Wed | Thu | Fri |
|---|---|---|---|---|---|---|---|---|---|---|---|---|---|---|---|
| ▲ GLD | ▲ ▲ ▲ | 2026-11-02 | ▲ +4.71% | ▲ +2.98% | 361.74 | 378.97 | 358.94 | 372.52 | ▲ 369.50 | 46,391,398 | +1.65% | -0.66% | +3.68% | +0.81% | -0.79% |
| ▲ TLT | ▲ ▲ ▲ | 2026-11-02 | ▲ +0.10% | ▲ +0.11% | 81.83 | 82.42 | 80.89 | 81.92 | ▲ 81.75 | 196,846,044 | -0.13% | -0.76% | +0.80% | +0.21% | -0.01% |
| ▼ IBIT | ▼ ▼ ▼ | 2026-11-02 | ▼ -1.11% | ▼ -2.32% | 43.90 | 45.95 | 42.27 | 42.88 | ▼ 43.85 | 231,123,967 | -0.02% | +1.61% | +2.91% | -5.07% | -0.35% |
| ▼ USO | ▼ ▼ ▼ | 2026-11-02 | ▼ -12.10% | ▼ -6.96% | 159.52 | 159.86 | 142.96 | 148.41 | ▼ 151.17 | 33,312,415 | -7.08% | +0.83% | -8.07% | +1.93% | +0.13% |
| AVG/Sum | — | — | -2.10% | -1.55% | — | — | — | — | — | 507,673,824 | -1.40% | +0.26% | -0.17% | -0.53% | -0.25% |
Cross-Market ETFs
Negative confluence: average WOC% -1.55% from the week open; WNC% -2.10% versus the prior weekly close. Gold led gains on both measures, diverging from equities, while bonds edged higher; bitcoin fell and oil lagged sharply. Gold remained below falling near/intermediate averages, while oil’s weekly loss coexisted with rising intermediate and longer-term structures.
GLD · W:2026-11-02 NC% ▲ +4.71% OC% ▲ +2.98%
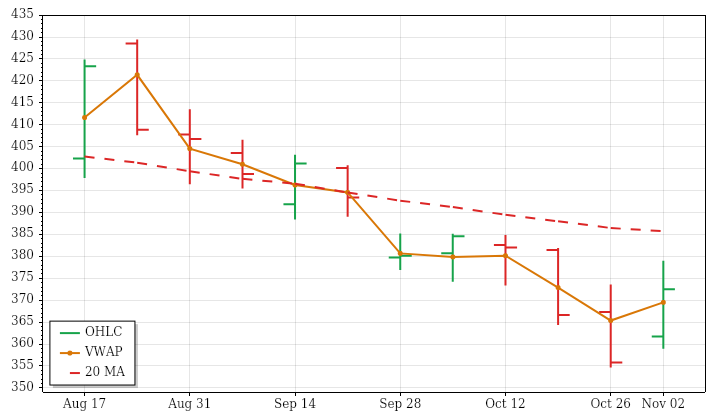
GLD – Gold Technicals Summary
GLD’s completed week beginning November 2, 2026 closed at 372.52, up 4.71% from the prior weekly close and 2.98% from the open. The opening gap up remained unfilled, and the week established a higher high and higher low. Nevertheless, the close stayed inside the previous week’s range, so the advance did not constitute a closing breakout from that range. Finishing above weekly VWAP added a positive feature to the rebound.
The gain opposed both the 12-week price downtrend and falling near- and intermediate-term averages, which remained above price. The far-term structure stayed positive, leaving a rebound within shorter-horizon weakness rather than broad trend alignment. Weekly range expanded above average despite a contracting lookback trend, while volume remained slightly below average amid declining activity. A next-week high above 385.6789 would trigger a bullish PSAR reversal; the current state remained bearish.
Gold News and Fundamentals
Gold recovered above $4,000 an ounce during the week as the Democratic congressional sweep supported a post-election rally. Stronger-than-expected October payroll growth of 165,000 subsequently pressured prices, with elevated real yields weighing on demand. On November 6, gold traded near $4,050 after preliminary University of Michigan consumer sentiment rose to 51, versus expectations of 48, while inflation expectations eased. Walsh Trading’s John Weyer identified the Federal Reserve’s December decision as an upcoming catalyst for gold.
TLT · W:2026-11-02 NC% ▲ +0.10% OC% ▲ +0.11%
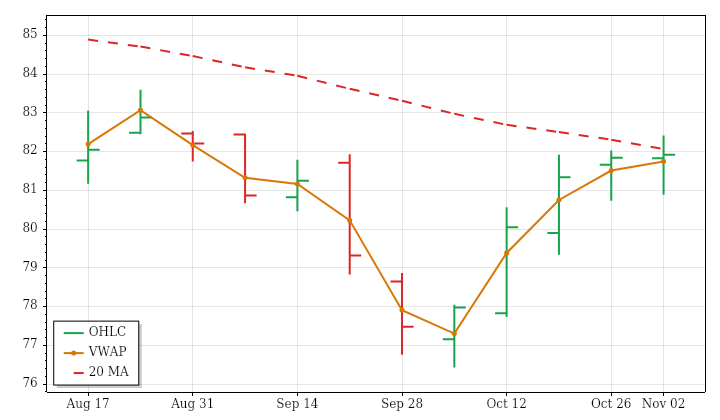
TLT – Long-Term Treasury Bonds Technicals Summary
TLT’s completed week beginning November 2, 2026 closed at 81.92, up 0.10% from the prior weekly close and 0.11% from the open. The negligible opening gap down was filled, and price made a higher high and higher low while finishing inside the previous week’s range. The close remained near the open but above weekly VWAP, giving the otherwise nearly flat result a modestly positive feature.
Price was above its falling near-term average, leaving that horizon mixed, while intermediate- and far-term averages remained falling above price. The latest gain therefore did not resolve the broader downward structure. The 12-week price trend was also negative and highly inefficient, reflecting substantial back-and-forth movement. Weekly range was below average despite expanding lookback ranges, while volume was slightly above average. PSAR remained positive; a next-week low below 77.2805 would trigger a bearish reversal.
Treasury Bonds News and Fundamentals
Bond investors were looking ahead to a potential 2027 debt-ceiling confrontation following Democratic election gains. November 5 reporting said the Treasury’s remaining borrowing room was shrinking faster than its plans suggested.
IBIT · W:2026-11-02 NC% ▼ -1.11% OC% ▼ -2.32%
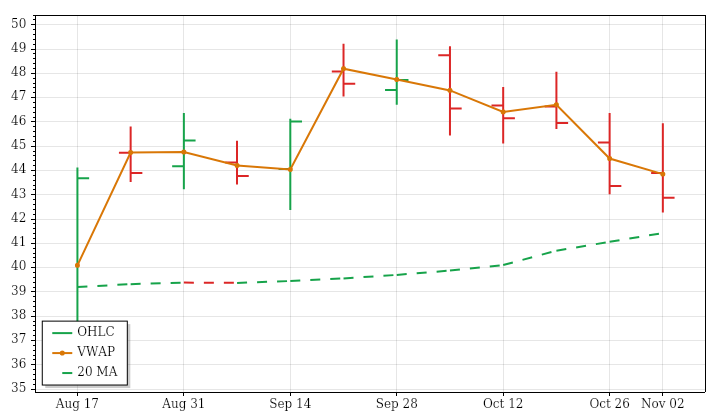
IBIT – Bitcoin Technicals Summary
IBIT’s completed week beginning November 2, 2026 closed at 42.88, down 1.11% from the prior weekly close and 2.32% from the open. The opening gap up was filled, followed by a lower high and lower low. Price finished below the previous week’s low and near the weekly low, while also closing below weekly VWAP. Those features gave the completed period a weaker character than its modest prior-close loss alone suggests.
The decline conflicted with the upward 12-week price trend, although that advance had relatively low directional efficiency. Near-term conditions were mixed because price was below a rising average; intermediate conditions were also mixed, with price above a falling average. No far-term structure was supplied. Range exceeded average despite contracting lookback ranges, while slightly below-average volume matched declining activity. A next-week high above 49.034 would trigger a bullish PSAR reversal.
USO · W:2026-11-02 NC% ▼ -12.10% OC% ▼ -6.96%
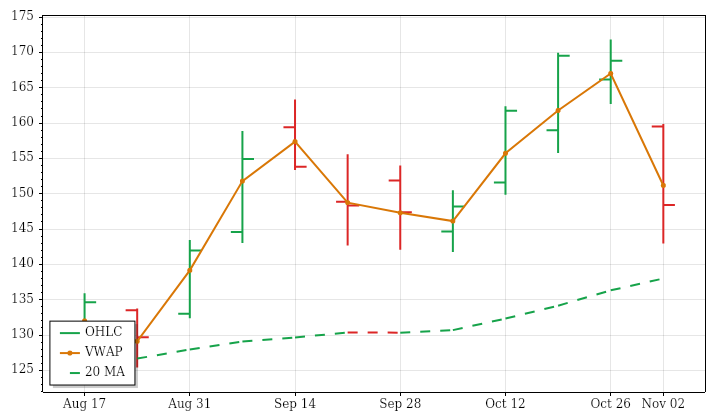
USO – Oil Technicals Summary
USO’s completed week beginning November 2, 2026 closed at 148.41, down 12.10% from the prior weekly close and 6.96% from the open. A substantial opening gap down remained unfilled, explaining why the prior-close loss exceeded the open-to-close decline. The week formed a lower high and lower low, closed below the previous week’s low, and finished below weekly VWAP. Above-average range and volume continued the lookback trends of expansion and increasing activity.
The selloff contrasted sharply with the strong 12-week price uptrend. Price fell below its still-rising near-term average, leaving that horizon mixed, while intermediate- and far-term uptrends remained intact beneath price. This created a clear conflict between the latest weakness and the broader rising structure. PSAR was short while the ATR-median trend stayed positive. A next-week high above 171.82 would trigger a bullish PSAR reversal, not establish one beforehand.
Oil News and Fundamentals
Oil fell for a fourth consecutive day on November 5 as Democratic congressional gains raised expectations of reduced escalation or an eventual end to the U.S.-Iran war. Analysts and traders also reported emerging signs of excess supply as high prices curbed demand, despite the unresolved conflict. Falling distillate inventories and Middle East supply constraints offered support. FGE NexantECA’s Fereidun Fesharaki forecast that oversupply could push oil toward $65–$70 a barrel by this time next year.
Glossary: Instrument — ticker symbol; hover for the instrument or company name; Date — week-start date. WNC% — prior-week close to this week’s close; WOC% — weekly session open-to-close percentage change. O — open; H — high; L — low; C — close, all for the table’s daily or weekly session; VWAP — volume-weighted average price; its arrow shows whether the close is above or below VWAP. Vol — period trading volume. Mon–Fri — each day’s prior-close-to-close percentage change.
Bias — three directional readings, in order: WNC%, WOC%, then VWAP. ▲ positive/above; ▼ negative/below; — neutral or unavailable. Matching arrows show alignment; opposing arrows show mixed conditions. AVG/Sum — simple average of percentage changes and sum of reported volumes.
Futures Session Fib Grid Analysis – Snapshot
Session Fib Grids normalise market positioning as percentages, making direction and alignment comparable across different asset types.
Latest available snapshot for each instrument; Time(CT) shows the individual update date and time.
| Instrument | Bias | Time(CT) | YSFG | MSFG | WSFG | RSFG | SFG | TSI |
|---|---|---|---|---|---|---|---|---|
| ▲ ES | ▲ ▼ ▼ ▲ ▲ ▼ | 2026-11-06 15:59:59 | ▲ +24 | ▼ -73 | ▼ -121 | ▲ +7 | ▲ +7 | ▼ -56 |
| ▼ NQ | ▲ ▼ ▼ ▼ ▼ ▼ | 2026-11-06 15:59:58 | ▲ +10 | ▼ -57 | ▼ -102 | ▼ -8 | ▼ -8 | ▼ -27 |
| ▲ YM | ▲ ▼ ▼ ▲ ▲ ▼ | 2026-11-06 15:59:59 | ▲ +18 | ▼ -27 | ▼ -49 | ▲ +38 | ▲ +38 | ▼ -23 |
| ▲ EMD | ▲ ▼ ▼ ▲ ▲ ▲ | 2026-11-06 15:59:55 | ▲ +22 | ▼ -42 | ▼ -73 | ▲ +20 | ▲ +20 | ▲ +17 |
| ▲ RTY | ▲ ▼ ▼ ▲ ▲ ▲ | 2026-11-06 15:59:56 | ▲ +26 | ▼ -44 | ▼ -78 | ▲ +32 | ▲ +32 | ▲ +27 |
| ▼ FDAX | ▲ ▼ ▼ ▼ ▲ ▼ | 2026-11-06 15:03:58 | ▲ +20 | ▼ -18 | ▼ -29 | ▼ -116 | ▲ +4 | ▼ -114 |
| ▲ NKD | ▲ ▼ ▼ ▲ ▲ ▲ | 2026-11-06 15:59:58 | ▲ +91 | ▼ -52 | ▼ -107 | ▲ +54 | ▲ +1 | ▲ +25 |
| Instrument | Bias | Time(CT) | YSFG | MSFG | WSFG | RSFG | SFG | TSI |
|---|---|---|---|---|---|---|---|---|
| ▼ BTC | ▼ ▼ ▼ ▼ ▲ ▼ | 2026-11-07 10:08:09 | ▼ -54 | ▼ -15 | ▼ -46 | ▼ -7 | ▲ +5 | ▼ -43 |
| ▲ GC | ▼ ▲ ▲ ▲ ▲ ▲ | 2026-11-06 15:59:59 | ▼ -130 | ▲ +45 | ▲ +104 | ▲ +13 | ▲ +43 | ▲ +104 |
| ▼ CL | ▲ ▼ ▼ ▼ ▼ ▼ | 2026-11-06 15:59:58 | ▲ +155 | ▼ -62 | ▼ -159 | ▼ -11 | ▼ -8 | ▼ -49 |
| ▼ 6E | ▼ ▼ ▼ ▼ ▲ ▼ | 2026-11-06 15:59:58 | ▼ -61 | ▼ -7 | ▼ -16 | ▼ -37 | ▲ +11 | ▼ -70 |
| ▼ ZB | ▼ ▲ ▲ ▼ ▼ ▲ | 2026-10-21 09:39:59 | ▼ -39 | ▲ +77 | ▲ +6 | ▼ -3 | ▼ -2 | ▲ +29 |
Glossary: YSFG — yearly; MSFG — monthly; WSFG — weekly; RSFG — regular trading hours (RTH); SFG — the current session, including pre-market or other sessions. TSI indicates trend strength and power.
Bias shows trend alignment across these six readings. The arrows follow the column order: YSFG, MSFG, WSFG, RSFG, SFG and TSI. Matching arrows show alignment; opposing arrows show mixed conditions.
Data, Market and System
Market Weekly Recap Summary
AI investment economics and earnings positioning were recurring themes, not just late-week pressures. Monday’s technology selloff reflected concerns about spending commitments and cash flow ahead of Apple’s results. Tuesday brought selective semiconductor strength and modest equity gains ahead of AMD, Arista Networks and Super Micro Computer earnings, but Apple’s margin outlook and broader free-cash-flow concerns restrained confidence. Weekly mega-cap results were sharply divided: Amazon gained 7.88%, Microsoft rose 1.67% and Alphabet added 1.77%, while Nvidia fell 8.80% and Tesla lost 10.40%.
Wednesday’s election clarity briefly supported broader equities as Democratic control of Congress raised expectations of gridlock under President Trump. Yet the outcome also intensified concerns about data-center moratoriums, regulation, delays and development costs, leaving semiconductor shares under pressure even as major cloud providers advanced. Those concerns drove Thursday’s much sharper technology-led retreat. Oil’s decline provided a separate source of divergence: Wednesday’s reassessment of U.S. policy toward Iran weighed on energy shares while lower fuel prices benefited airlines.
Friday’s technology dip buying recovered only part of Thursday’s losses and did not resolve the AI infrastructure concerns that had persisted throughout the week. Labor-market positioning also developed into a concrete policy consideration: after Thursday’s anticipation of the jobs report, Friday’s release showed payrolls rising 165,000 and unemployment falling to 4.1%. Employment strength alongside persistent inflation concerns complicated the monetary-policy backdrop. Gold’s strong weekly advance contrasted with equity weakness, while long-dated Treasuries finished nearly unchanged despite mixed daily moves.
Daily Session Recap
Monday 2026-11-02 — Session Summary
- ISM Manufacturing PMI — 10:00 ET · Medium
- AAPL — Earnings · AMC
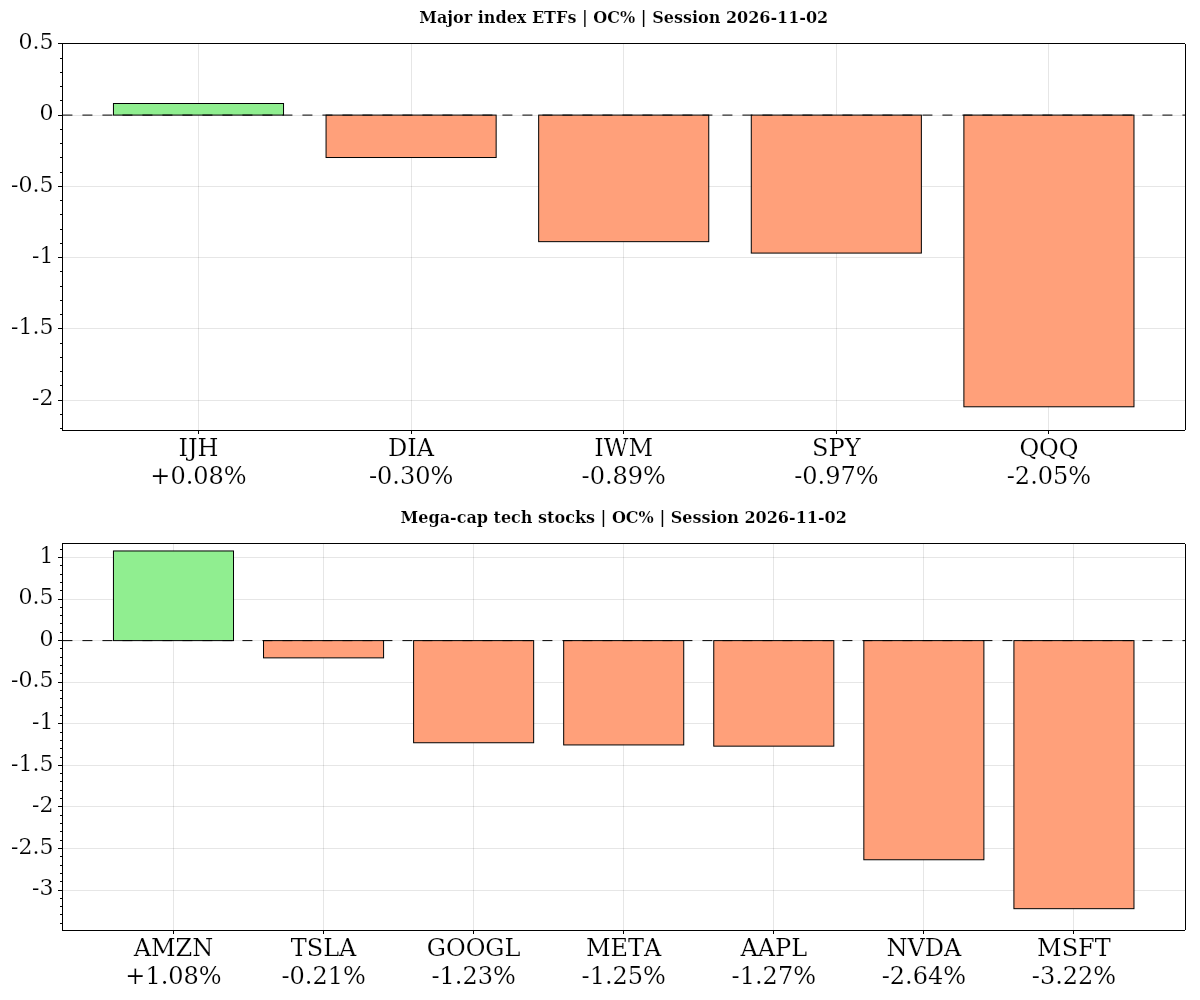
Stocks fell Monday, with technology leading losses as concerns about artificial-intelligence spending and cash flow weighed on sentiment ahead of Apple’s earnings after the close. Measured from the open, the S&P 500 fund lost 0.97% and the Nasdaq-100 fund dropped 2.05%. Microsoft declined 3.22%, while Amazon bucked the broader technology weakness with a 1.08% gain. Oil and long-dated Treasury bonds also fell, leaving a cautious tone across several markets.
The technology selloff extended a difficult backdrop for the sector rather than standing as an isolated session. The Nasdaq 100 had fallen 6.66% in October, even as the Dow gained 1.7%, highlighting a rotation away from technology. Questions about the profitability of hyperscalers’ AI investment and the financing pressures associated with that spending remained central risks. Stronger earnings surprises outside technology reinforced the contrast in sector performance, while positioning ahead of Apple’s results kept earnings firmly in focus. Election positioning added another consideration to the market backdrop.
Monday’s economic calendar featured the 10 a.m. ET ISM Manufacturing PMI, alongside the continuing earnings focus. In energy, U.S. oil traded below $100 a barrel, and the oil fund fell 1.66% from the open, leaving it 7.08% below its prior close. Gold showed a different pattern: it slipped just 0.02% from the open but remained 1.65% above its previous close. Long-dated Treasury bonds eased 0.12%. Despite the session’s equity declines and pronounced weakness in technology, broader equity futures retained bullish longer-term technical structures, contrasting with the immediate pressure on stock funds.
Tuesday 2026-11-03 — Session Summary
- JOLTS Job Openings — 10:00 ET · Medium
- Congressional Elections — 10:16 ET · High
- AMD — Earnings · AMC
- ANET — Earnings · AMC
- SMCI — Earnings · AMC
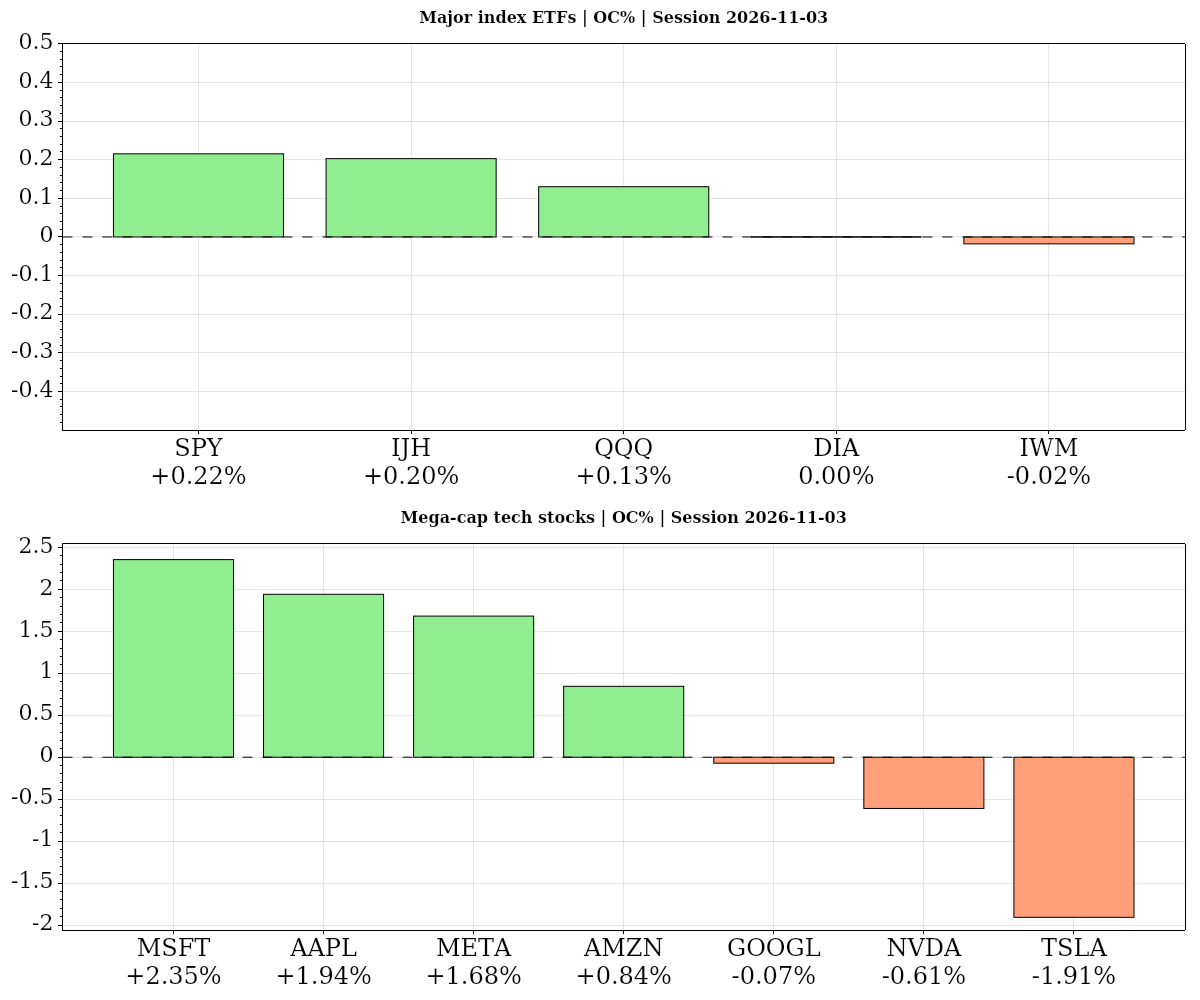
Stocks and technology finished higher Tuesday as investors positioned ahead of earnings from AMD, Arista Networks and Super Micro Computer after the close. The gains were modest and left weak near-term trends intact. The S&P 500 ETF rose 0.22% from the open, while the Nasdaq-100 ETF gained 0.13% on the same basis. Both closed below their volume-weighted average prices on below-average volume, tempering the positive finish.
AI investment costs and mega-cap earnings reactions remained the main forces shaping sentiment. Semiconductor strength provided a counterweight to concerns about the cost of AI spending, margin compression and pressure on free cash flow. The pending reports from AMD, Arista Networks and Super Micro kept technology earnings in focus, but the session’s gains did not amount to a uniform endorsement of the sector. Instead, selective strength sat alongside continued pressure on technology valuations as investors weighed investment commitments against profitability.
Performance among the largest technology names reflected that divide. Microsoft gained 2.35% from the open, while Apple’s margin outlook remained a concern. Apple recovered 1.94% from its opening level but still finished 1.90% below its previous close, highlighting the distinction between its improvement during the session and its negative daily result. JOLTS job openings, scheduled for 10:00 a.m. ET, and congressional elections also formed part of the day’s labor-market and political backdrop.
Cross-market moves were mixed. The oil fund gained 0.46% from the open, while gold and the far-term Treasury bond fund fell 0.57% and 0.40%, respectively. Those moves accompanied an equity session in which earnings positioning and selective semiconductor gains supported prices, but weak technical conditions and concerns over the financial burden of AI investment continued to restrain conviction.
Wednesday 2026-11-04 — Session Summary
- ADP Employment Change — 08:15 ET · High
- S&P Global Composite PMI — 09:45 ET · Medium
- ISM Services PMI — 10:00 ET · High
- ISM Services Employment Index — 10:00 ET · Medium
- ISM Services New Orders Index — 10:00 ET · Medium
- ISM Services Prices Paid — 10:00 ET · Medium
- EIA Crude Oil Stocks Change — 10:30 ET · Low
- RIOT — Earnings · BMO
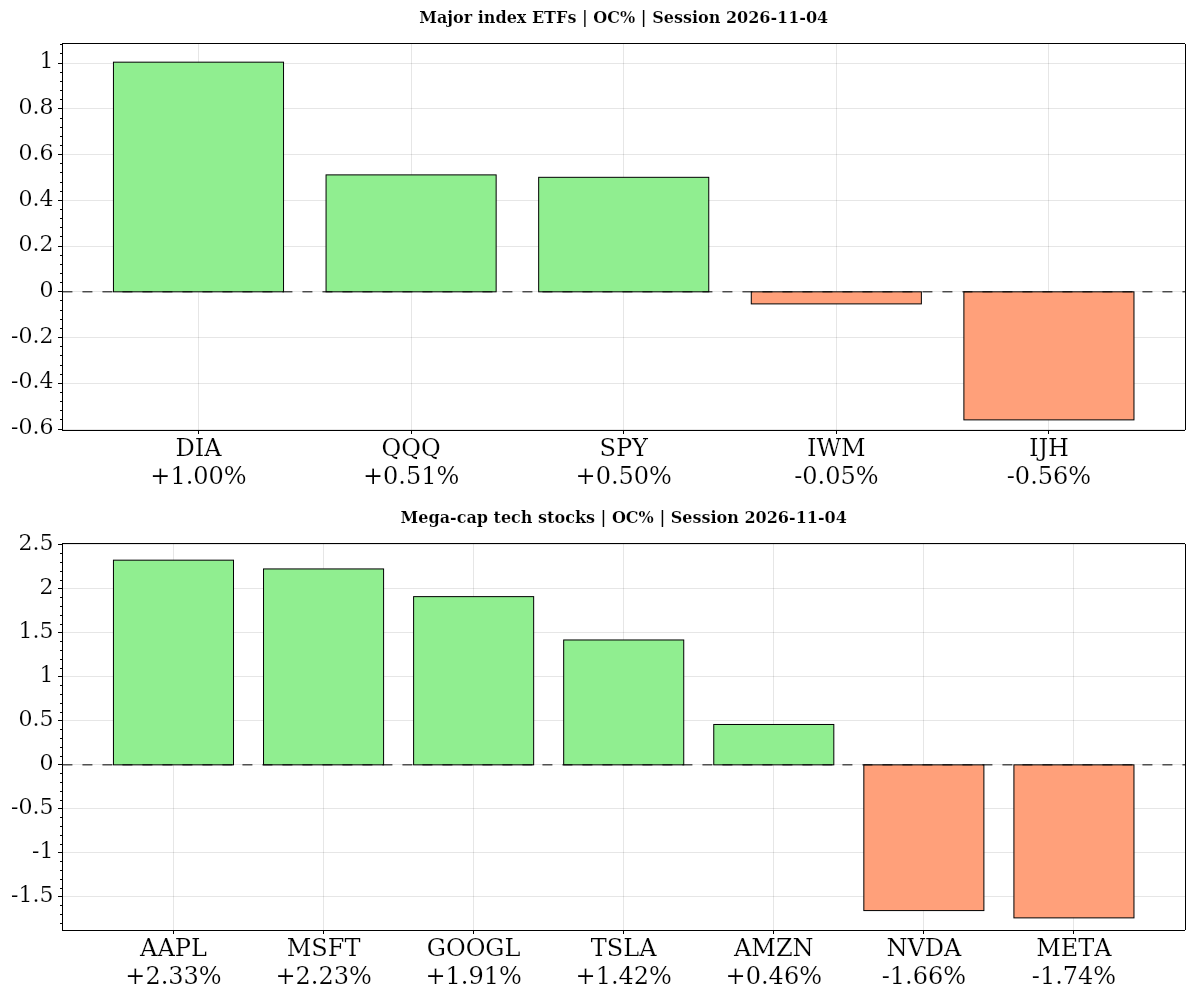
U.S. stocks closed higher Wednesday as reduced election uncertainty and expectations of congressional gridlock supported the Dow, S&P 500 and Nasdaq. Democrats’ capture of both the House and Senate set up divided government under President Trump, giving investors a clearer policy backdrop. Falling oil prices also supported major indices and fuel-sensitive businesses, although losses in energy shares and uneven technology participation tempered the broadly positive session. Measured from the open, the S&P 500 ETF gained 0.50% and the Nasdaq-100 ETF advanced 0.51%.
Technology’s gains masked a divide between major cloud providers and semiconductor companies. Apple and Microsoft each rose more than 2% from their opens, while chip shares faced pressure from concerns about data-center restrictions and development costs. Some election winners had campaigned on moratoriums and tighter regulation, including promises to pause development in Texas. The concerns centered on project delays, relocations and higher expenses rather than a large decline in aggregate U.S. spending. Questions about AI capital spending and corporate balance sheets remained important, alongside rising correlations within technology stocks, while the broader market outside the sector stayed relatively insulated.
Oil’s sharp decline was another defining feature of the session. The oil ETF fell 5.10%, and oil prices were on track for their largest weekly drop since 2020. The selloff was linked to a reassessment of U.S. policy toward Iran following the Democratic election sweep. Energy stocks weakened amid the election outcome and backlash against AI data-center development. Airlines benefited from lower fuel prices: JetBlue gained 14%, while American Airlines and Delta each rose 7%, illustrating the contrasting effects of the energy move across equities.
Gold and longer-dated Treasury funds also advanced, with the gold ETF gaining 0.79% and the far-term Treasury ETF rising 0.48%. Technical conditions remained less reassuring than the positive equity session suggested, as Nasdaq near- and medium-term trends stayed bearish. Individual stock performance also required care in distinguishing gains from the open from full-session returns: Tesla rose 1.42% from its open but still finished 3.34% below its prior close.
Thursday 2026-11-05 — Session Summary
- Challenger Job Cuts — 05:30 ET · Medium
- Initial Jobless Claims — 08:30 ET · Medium
- Nonfarm Productivity — 08:30 ET · Medium
- Unit Labor Costs — 08:30 ET · Medium
- Fed's Hammack speech — 08:50 ET · Medium
- Fed's Barkin speech — 10:00 ET · Medium
- 4-Week Bill Auction · $115B — 11:30 ET · Medium
- 8-Week Bill Auction · $110B — 11:30 ET · Medium
- MCHP — Earnings · AMC
Stocks sank Thursday as concerns about post-election constraints on AI data-center construction drove a technology-led selloff. Semiconductor weakness weighed on the Nasdaq and S&P 500, with the decline bringing both indexes’ 200-day moving averages into focus. Selling came on elevated volume, while short- and medium-term equity ETF trends remained weak, reinforcing the session’s negative technical backdrop.
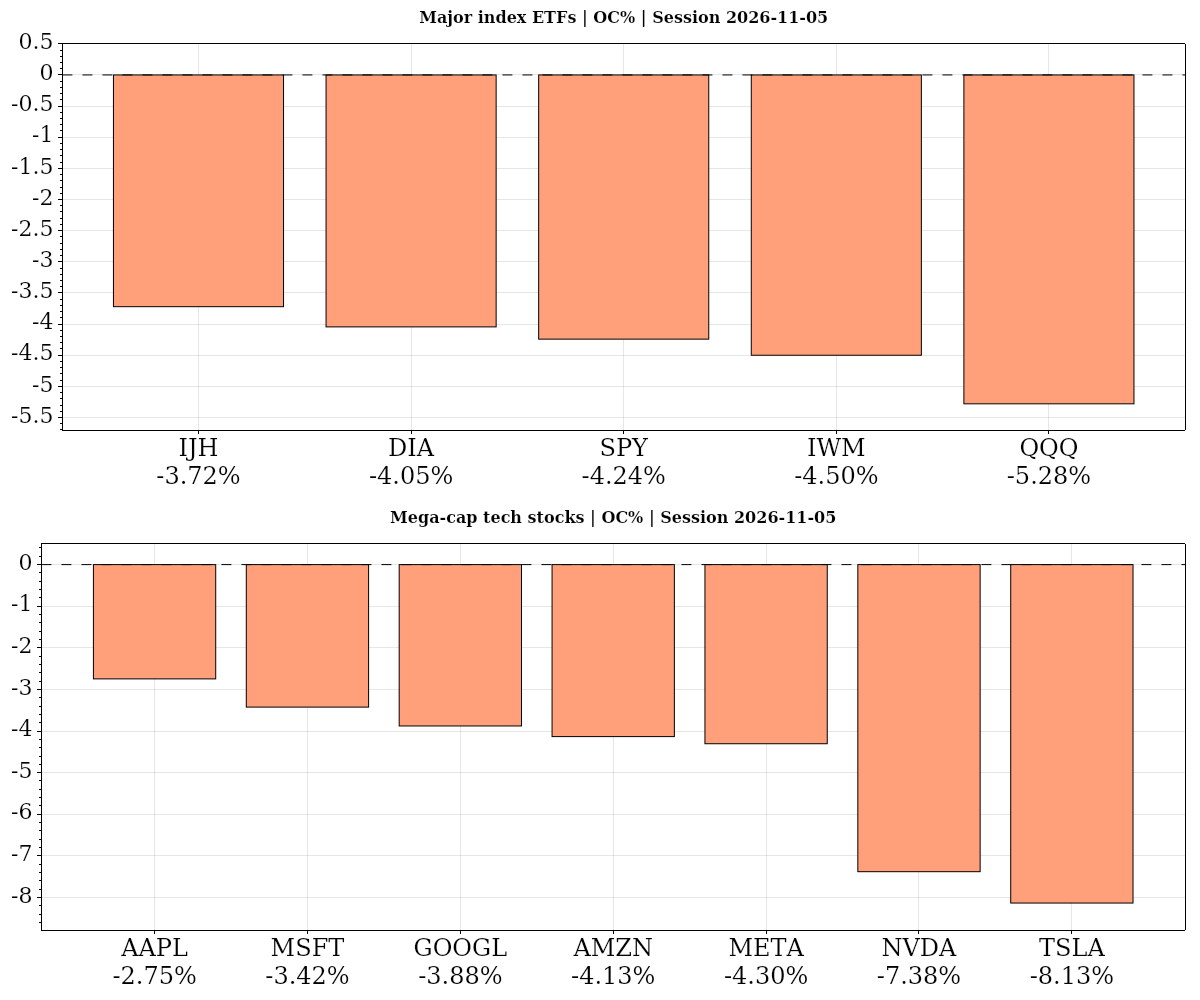
AI infrastructure spending was the dominant concern, putting pressure on companies tied to the buildout and leaving technology shares at the center of the retreat. From the open, the Nasdaq-100 ETF lost 5.28% and the S&P 500 ETF fell 4.24%. Nvidia dropped 7.38% from its open, while Tesla slid 8.13%. The scale of those declines underscored the pressure on prominent technology-related shares. Selective bargain-hunting commentary offered a counterpoint, but the overall tone remained predominantly negative.
Earnings and labor-market positioning also framed the session. Microchip Technology was due to report after the close, keeping semiconductor earnings in focus as the group sold off. Thursday’s calendar included unemployment claims, while the October jobs report was scheduled for Friday, November 6. That forthcoming release remained a key risk alongside further technology weakness, with investors heading into the report after a sharp equity decline.
Cross-market moves were more mixed. Oil rose 0.73% from its open, while the far-term Treasury ETF gained 0.47%, contrasting with the heavy losses in equities. Gold’s ETF slipped 0.56% from the open but still finished 0.81% above its prior close. Those different reference points matter: gold weakened during the session yet retained a gain against the previous close, even as the equity selloff left major technical levels under scrutiny.
Friday 2026-11-06 — Session Summary
- Fed's Williams speech — 04:30 ET · Medium
- Average Hourly Earnings (MoM) — 08:30 ET · High
- Nonfarm Payrolls — 08:30 ET · High
- Unemployment Rate — 08:30 ET · High
- Average Hourly Earnings (YoY) — 08:30 ET · High
- Labor Force Participation Rate — 08:30 ET · Medium
- U6 Underemployment Rate — 08:30 ET · Medium
- Fed's Musalem speech — 09:30 ET · Medium
- Michigan Consumer Sentiment Index — 10:00 ET · High
- UoM 1-year Consumer Inflation Expectations — 10:00 ET · Medium
- Michigan Consumer Expectations Index — 10:00 ET · Medium
- UoM 5-year Consumer Inflation Expectation — 10:00 ET · Medium
- Fed's Bowman speech — 12:15 ET · Medium
- Fed's Daly speech — 13:00 ET · Medium
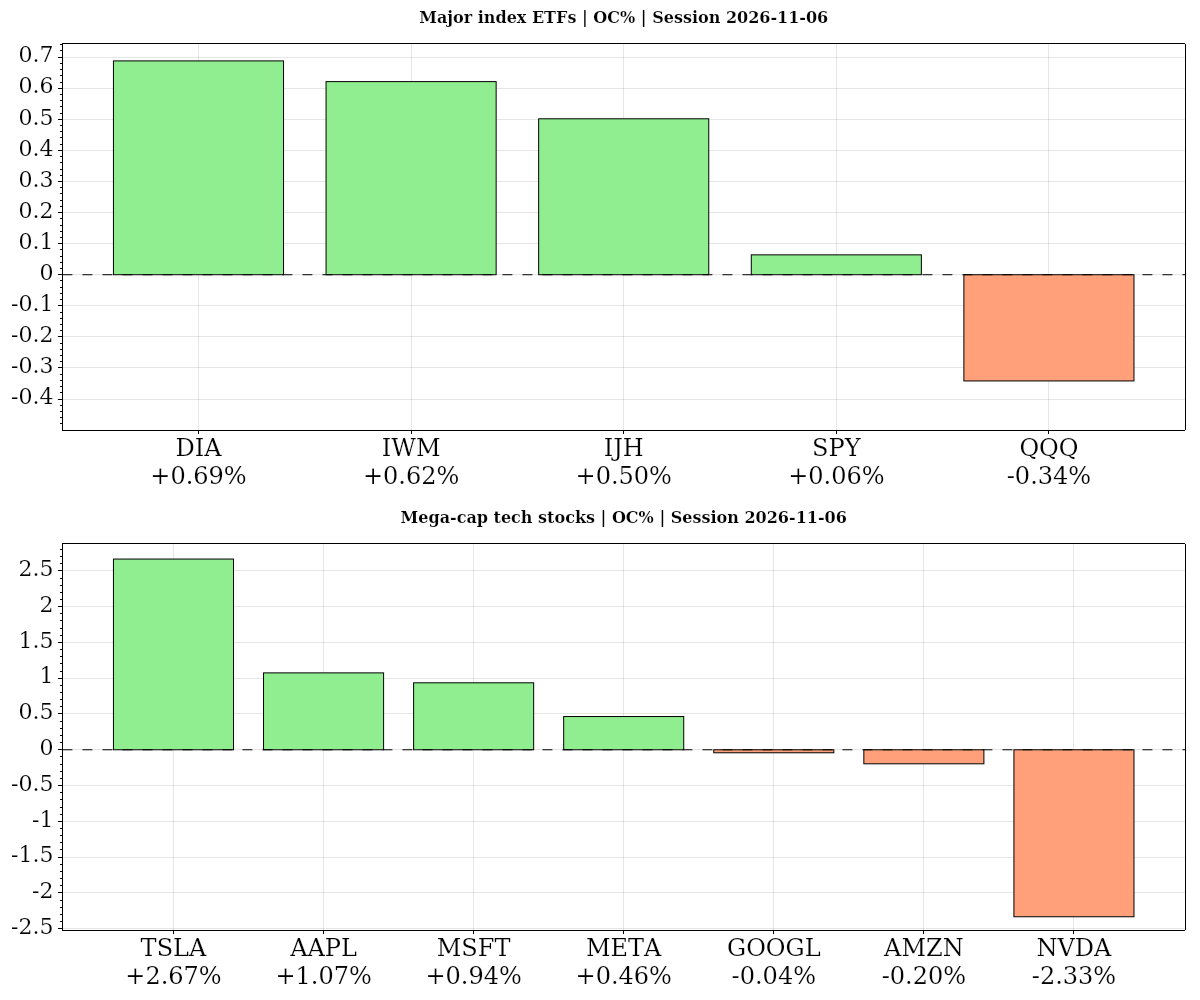
Stocks rebounded Friday as dip buying in technology and AI shares helped reverse part of Thursday’s sharp selloff. The recovery was stronger against prior closing levels than against Friday’s opening prices, leaving a mixed picture beneath the headline gains. The Nasdaq-100 ETF finished 1.40% above its previous close but slipped 0.34% from its open, while the S&P 500 ETF edged up 0.06% from its open. The rebound did not dislodge bearish near-term equity futures trends.
Technology remained at the center of both the recovery and the risks. Investors bought shares after the previous session’s steep decline, but concerns over AI infrastructure spending persisted. Oracle fell despite the broader rebound, underscoring the continued pressure on that theme. Nvidia gained 2.78% against its prior close yet fell 2.33% from its opening level. Those contrasting measures captured the session’s uneven tone: technology recovered lost ground without sustaining the same strength from the open, and renewed AI infrastructure selling remained a principal risk.
The labor market added another source of monetary policy uncertainty. October payrolls rose by 165,000 and the unemployment rate fell to 4.1%, keeping employment strength in focus alongside persistent inflation concerns. The combination complicated the policy backdrop even as equities recovered. Friday’s buying therefore unfolded against unresolved questions about inflation and monetary policy, rather than a clear easing of the concerns weighing on markets.
Cross-market moves were also mixed. Oil, gold and far-term Treasury ETFs rose from their opening levels, but gold and Treasuries still ended below their previous closes. Gold held above $4,000 an ounce. These differing comparisons echoed the uneven equity recovery: gains during the session did not uniformly translate into gains against Thursday’s finish, while bearish technical conditions remained in place for near-term equity futures.
Futures Higher Time Frame Analysis
Summary of the current state of US Indices Futures based on higher time-frame (HTF) technical analysis as of: 2026-11-07 11:30 -06:00 CT.
US Indices Futures
- ES YSFG above F0, MSFG/WSFG below F0, daily benchmarks overhead, weekly 100/200 rising, pivots down, support 7322.25–7322.50, resistance 7522.25, weekly reversal 7601.75.
- NQ YSFG above F0, MSFG/WSFG below F0, daily benchmarks declining, weekly 100/200 rising, pivots down, support 26363.50–26368.50, daily reversal 27804.50, weekly reversal 28597.50.
- YM YSFG above F0, MSFG/WSFG below F0, below short-term benchmarks, above rising daily 200, pivots down, support 50859–50894, daily reversal 52487, weekly reversal 53223.
- EMD YSFG above F0, MSFG/WSFG below F0, all daily benchmarks overhead, long-term weekly benchmarks rising, pivots down, support 3560.7, daily reversal 3678.1, resistance 3770.1–3969.6.
- RTY YSFG above F0, MSFG/WSFG below F0, all daily benchmarks overhead, weekly 100/200 rising, pivots down, support 2712.0–2714.2, daily reversal 2821.7, weekly reversal 2887.8.
- FDAX YSFG above F0, MSFG/WSFG below F0, above rising 20/55/100/200 benchmarks, pivots down, support 25895 then 24897–24925, weekly reversal 26255, resistance 26784–26847.
Overall State
- Short-Term: Bearish
- Intermediate-Term: Bearish
- Long-Term: Bullish
Conclusion
All six instruments show correlated downside pivot structures and price below MSFG/WSFG F0 levels, contrasting with YSFG positions above F0 and bullish weekly long-term ratings. Intermediate weakness predominates, although weekly ES/EMD and daily FDAX remain neutral. Daily long-term ratings diverge: ES/NQ bearish, YM/EMD/RTY neutral, FDAX bullish. FDAX retains stronger benchmark alignment despite recent short signals; RTY remains below its 55-week benchmark, while NQ has broken its 200-day benchmark. Listed pivot lows define immediate support references; reversal thresholds and overhead benchmarks define resistance within the broader annual advance.
Note: Intra-day counter-trend pullbacks or retracements may occur, HTF is context for informational usage and market structure. Glossary: Session Fib Grids periods of YSFG:’Yearly’, MSFG:’Monthly’, WSFG:’Weekly’
For full details visit: AlphaWebTrader Technicals
SPY Weekly View
Overall Rating
- Short-Term: Bearish
- Intermediate-Term: Bullish
- Long-Term: Bullish.
Key Insights Summary
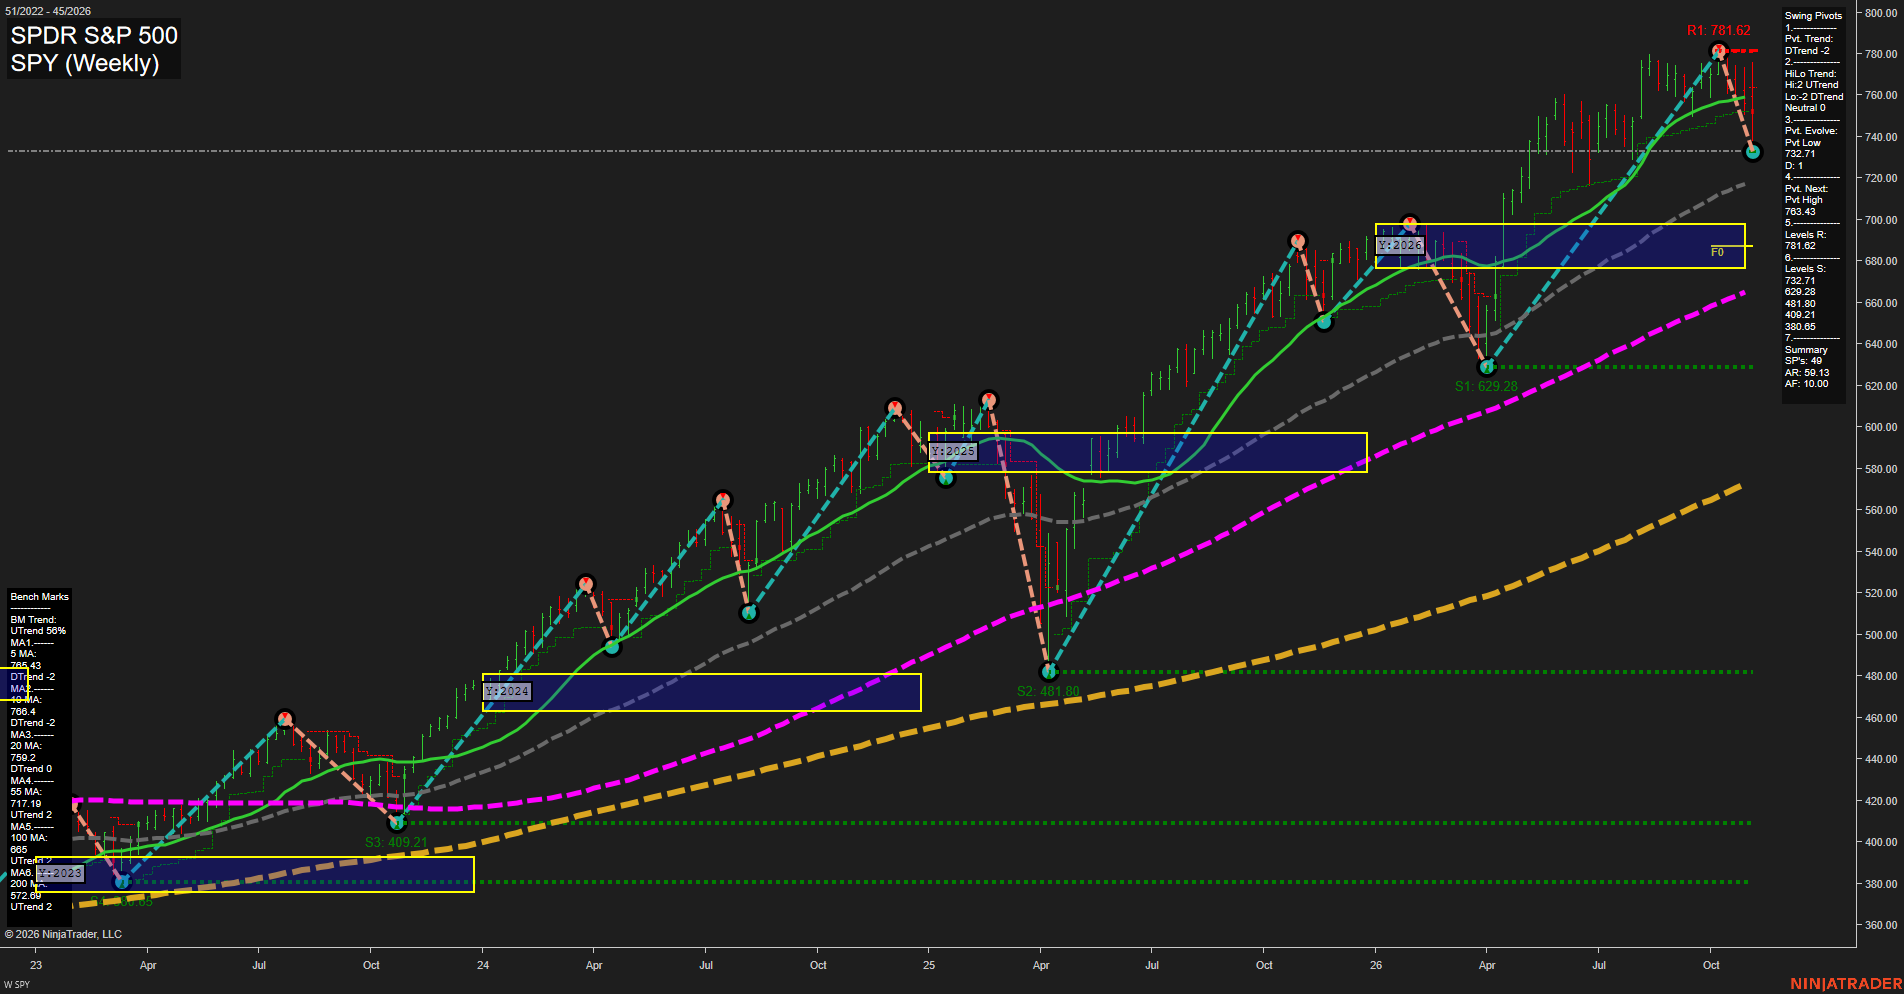
For an equity-index futures swing perspective, the weekly structure reflects a sharp counter-trend selloff from the 781.62 pivot high into a new 732.71 pivot low. Short-term momentum is bearish because price is beneath the declining 5-, 10-, and 20-week benchmarks, while the next confirmed upside pivot threshold is 763.43. The larger structure remains constructive: the intermediate HiLo trend is still upward, price remains above the rising 55-, 100-, and 200-week averages, and the 2026 yearly fib grid remains below price. This creates a split trend condition, with near-term downside volatility and lower-high behavior occurring inside a broader higher-low advance.
View charts on: AlphaWebTrader HTF Charts
ES Weekly View
Overall Rating
- Short-Term: Bearish
- Intermediate-Term: Bearish
- Long-Term: Bullish.
Key Insights Summary
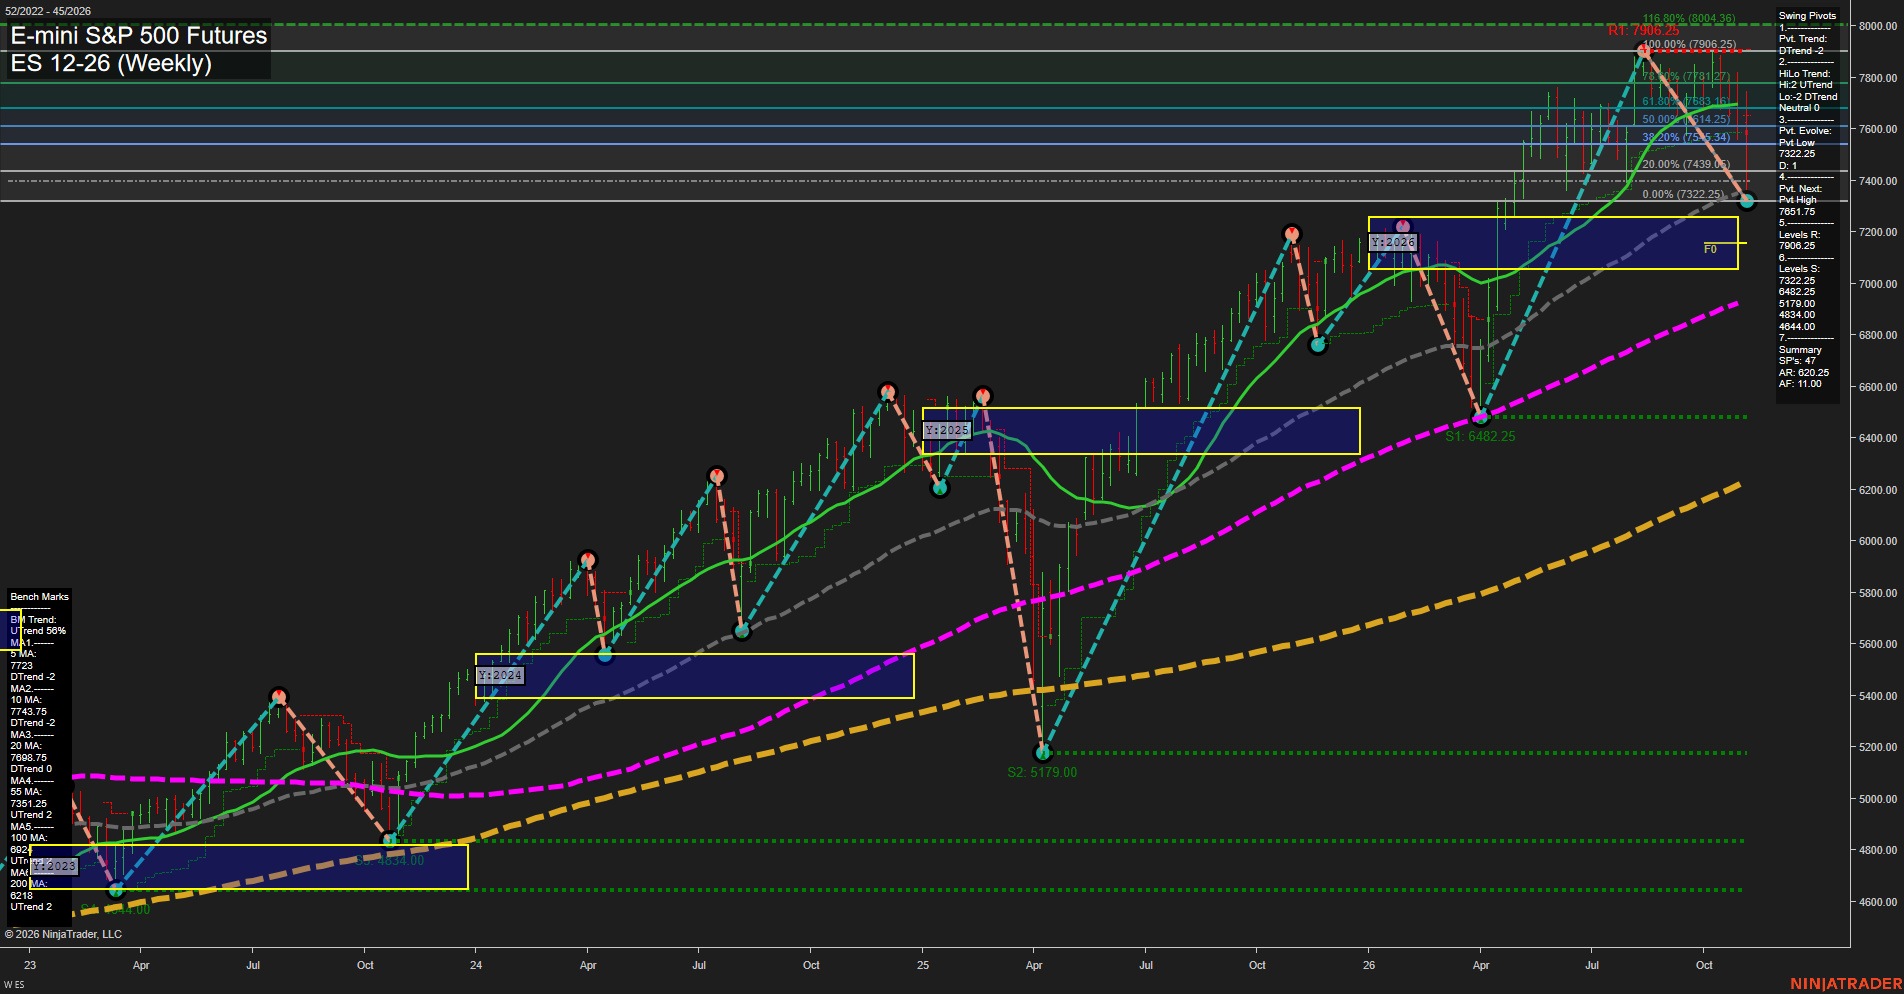
The weekly structure reflects a sharp counter-trend decline within a still-intact long-term advance. Price is below the weekly and monthly Fib-grid centers and beneath the declining 5-, 10-, and 20-period benchmarks, confirming fast short-term downside momentum. The 7322.25 pivot-low area is the immediate structural support, while 7593.75 through 7906.25 defines the overhead recovery and resistance zone. Intermediate structure has weakened from prior highs, although the higher-order pivot trend, 55-period average, and rising 100- and 200-period averages preserve the broader bullish trend context.
View charts on: AlphaWebTrader HTF Charts
QQQ Weekly View
Overall Rating
- Short-Term: Bearish
- Intermediate-Term: Neutral
- Long-Term: Bullish.
Key Insights Summary
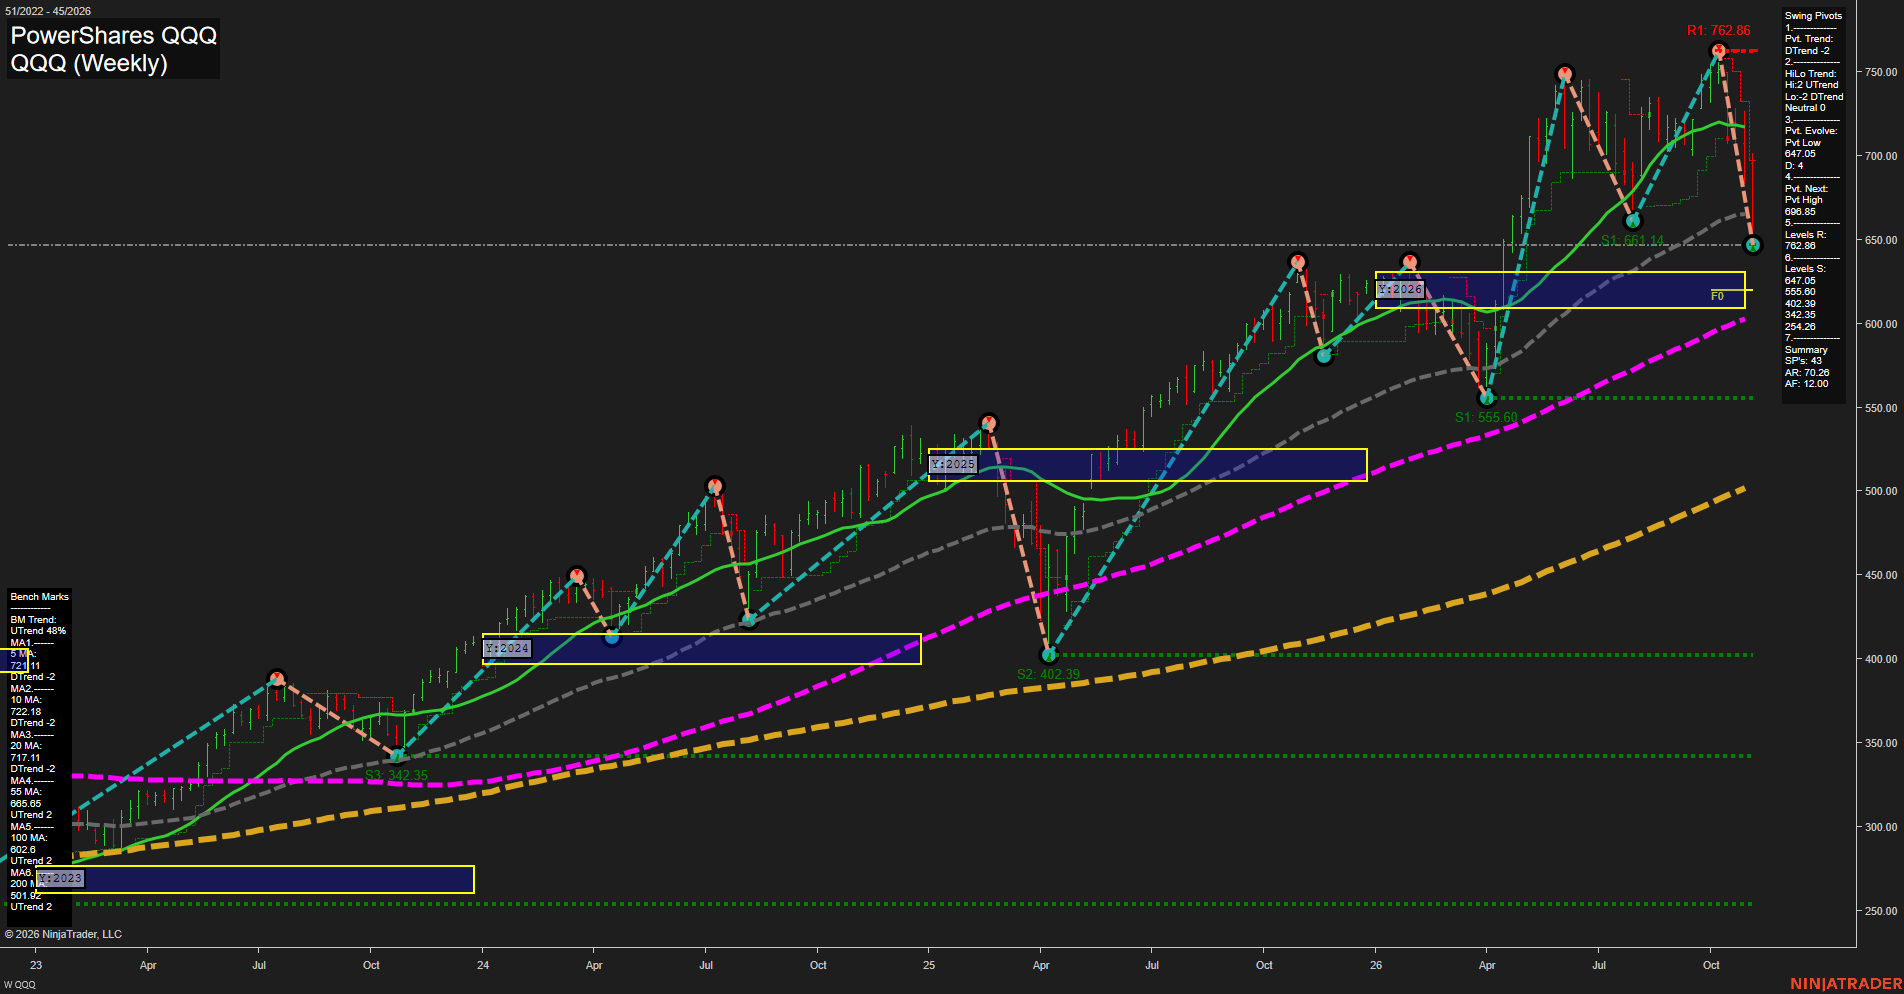
QQQ is undergoing a fast, large-range weekly pullback from the 762.86 pivot high, with price now below the 5-, 10-, 20-, and 55-week benchmarks. From a futures swing-trader perspective, this resembles a sharp NQ-led countertrend liquidation within a still-positive longer-term structure: the intermediate HiLo trend remains upward and price remains above the rising 100- and 200-week benchmarks. The active 647.05 pivot low is the immediate structural reference, while 698.85 is the next upside pivot-reversal threshold; the current decline has shifted near-term market character from trend continuation to high-volatility retracement.
View charts on: AlphaWebTrader HTF Charts
NQ Weekly View
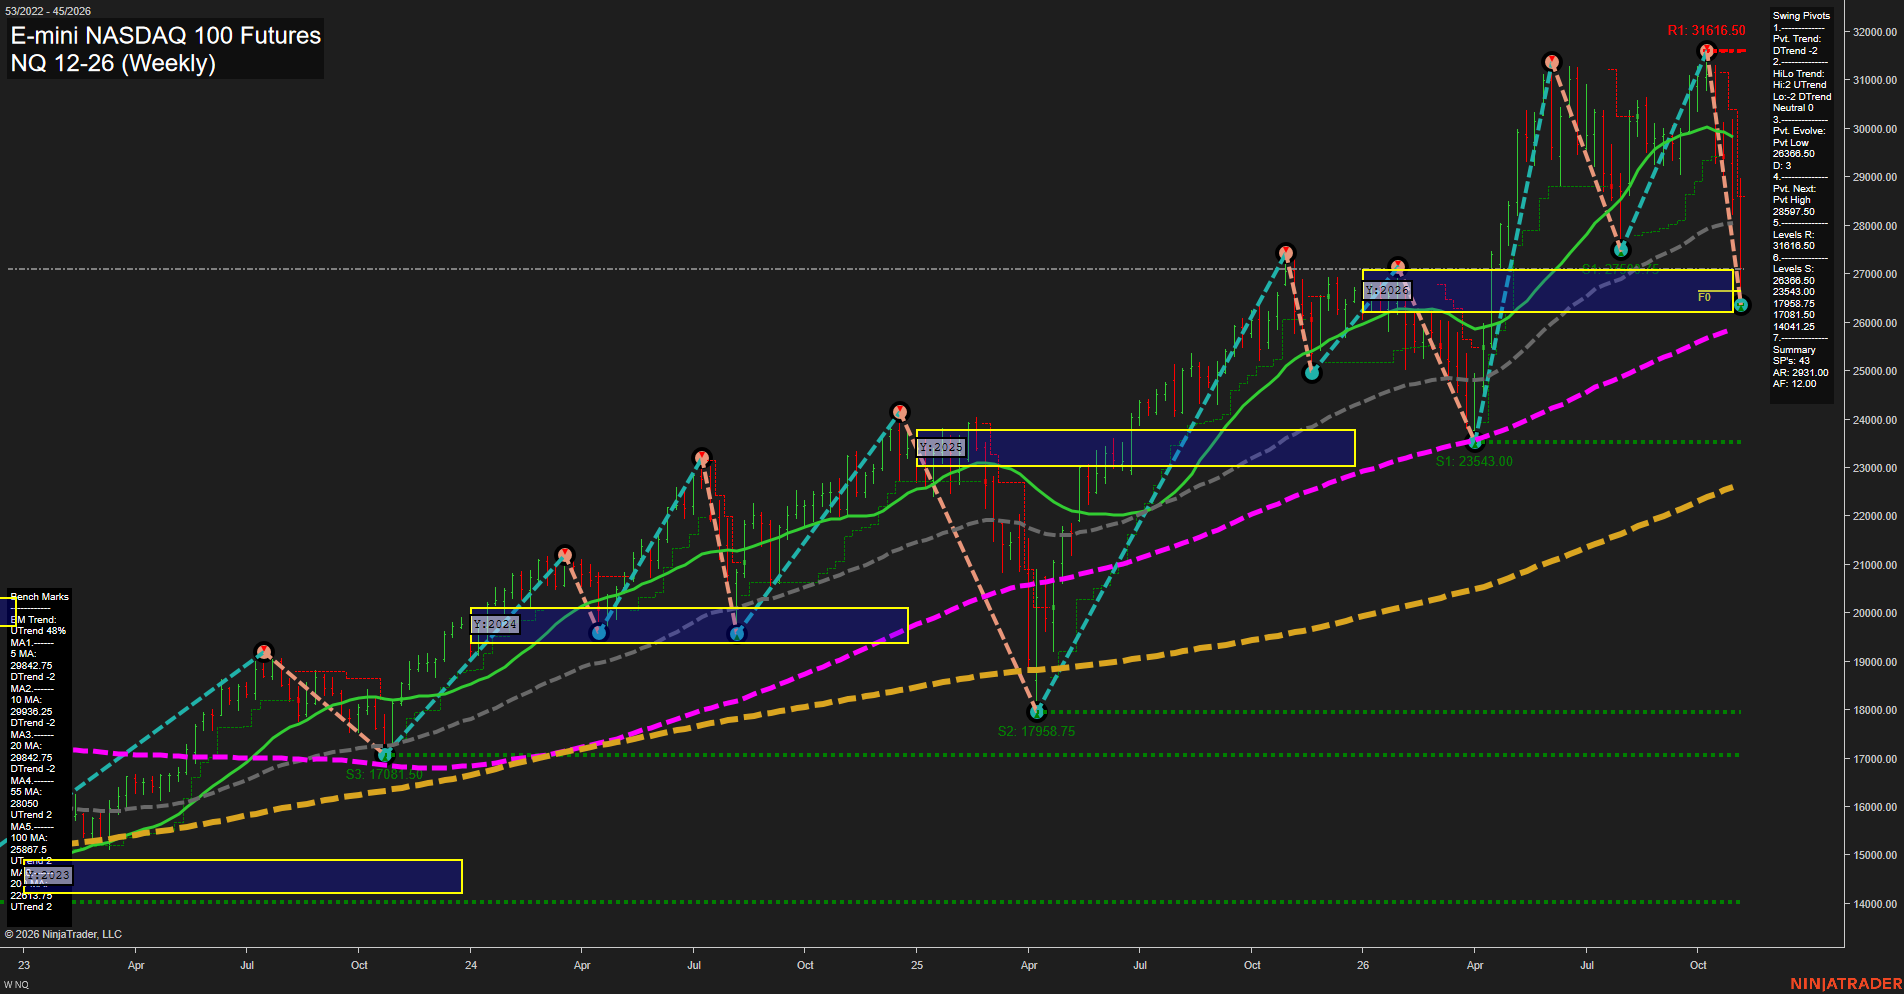
Overall Rating
- Short-Term: Bearish
- Intermediate-Term: Bearish
- Long-Term: Bullish.
Key Insights Summary
The weekly structure reflects a sharp countertrend selloff within a still-positive yearly trend. Price has fallen below the weekly and monthly F0% levels and sits beneath the declining 5-, 10-, and 20-week benchmarks, confirming strong short-term downside momentum and a bearish swing-pivot trend. The 26368.50 developing pivot low is the immediate structural reference, while 28597.50 marks the pivot-reversal threshold and the nearby 55-week benchmark. The broader advance remains intact because price remains above the rising 100- and 200-week benchmarks and the yearly grid remains positive; however, the current sequence is characterized by lower highs, accelerated downside bars, and a retracement from the 31616.50 swing-high resistance area.
View charts on: AlphaWebTrader HTF Charts
USO Weekly View
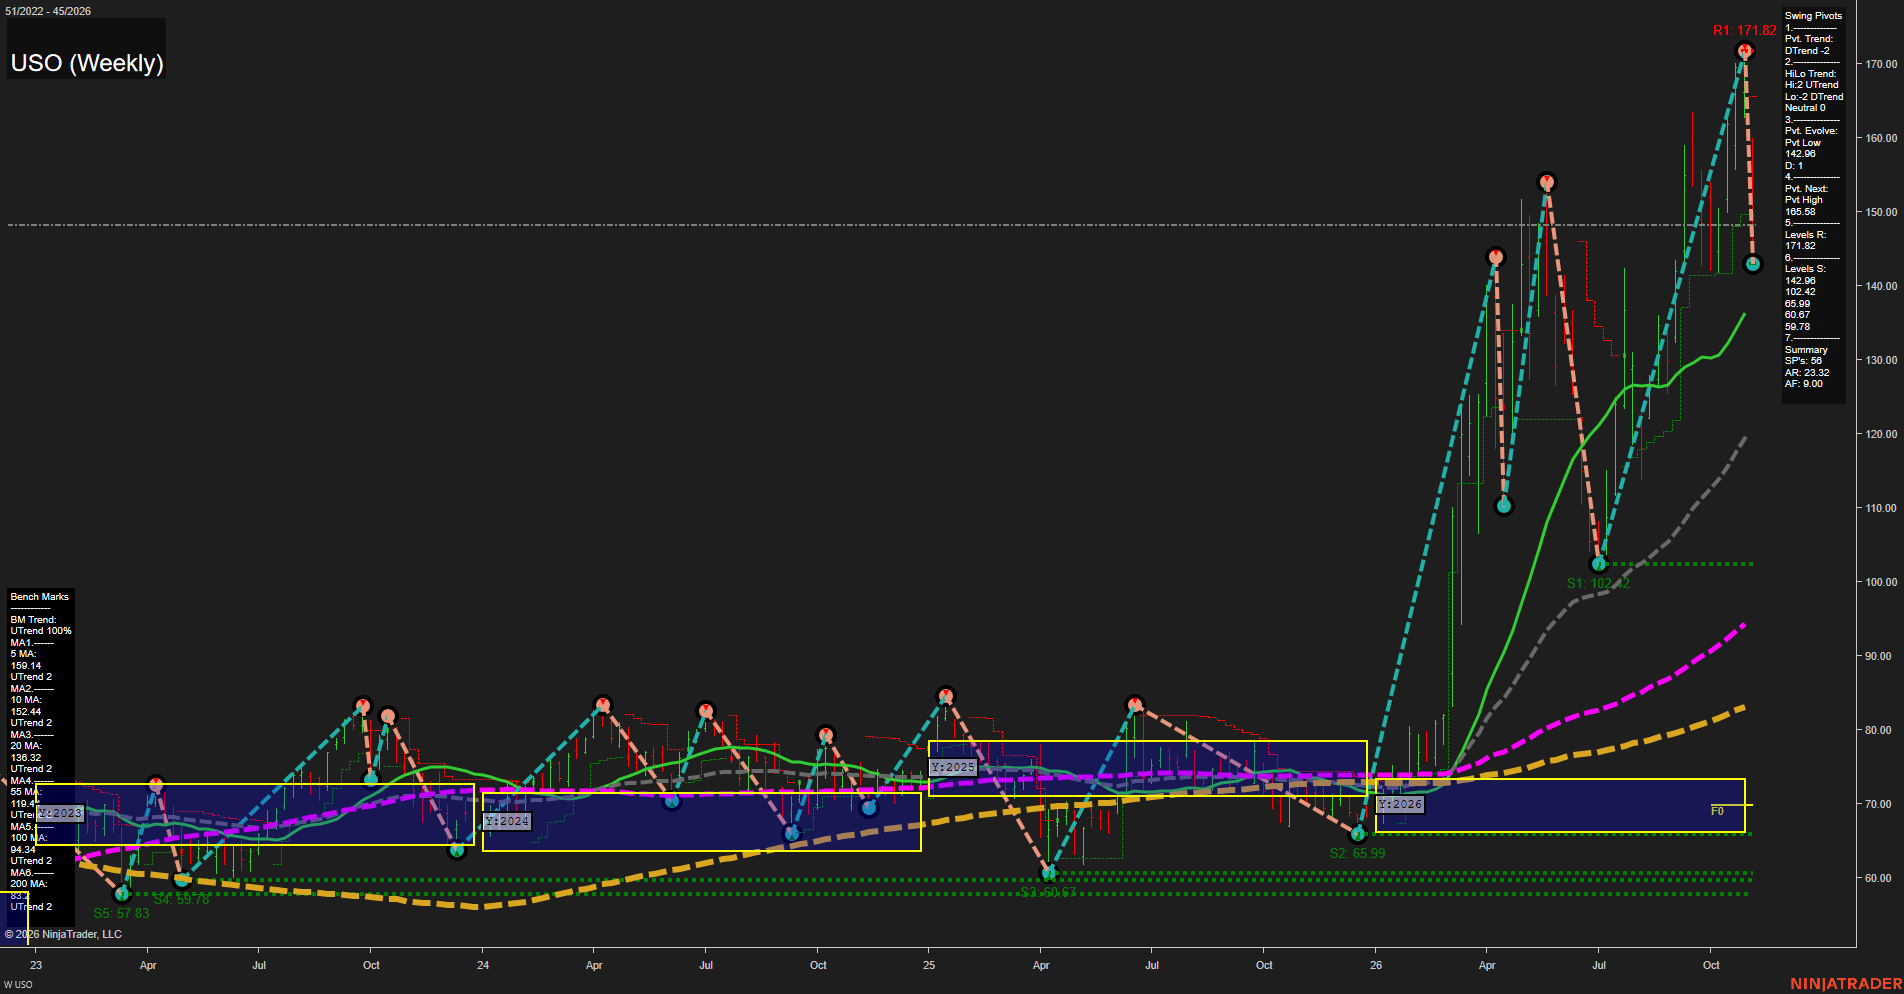
Overall Rating
- Short-Term: Bearish
- Intermediate-Term: Bullish
- Long-Term: Bullish.
Key Insights Summary
USO remains in a powerful higher-timeframe expansion, with price substantially above the rising 20, 55, 100, and 200-week benchmarks and far above the 2026 yearly F0 area. From a futures swing-trader perspective, the immediate structure is a fast, volatile pullback after rejection from the 171.82 pivot high. The short-term pivot trend is DTrend while price remains below the 152.44 and 159.14 short benchmarks; 142.96 is the nearby structural support defining the current retracement. The intermediate trend remains constructive through higher-level benchmark alignment and the UTrend HiLo condition, while 165.58 and 171.82 define the overhead pivot-resistance zone.
View charts on: AlphaWebTrader HTF Charts
CL Weekly View
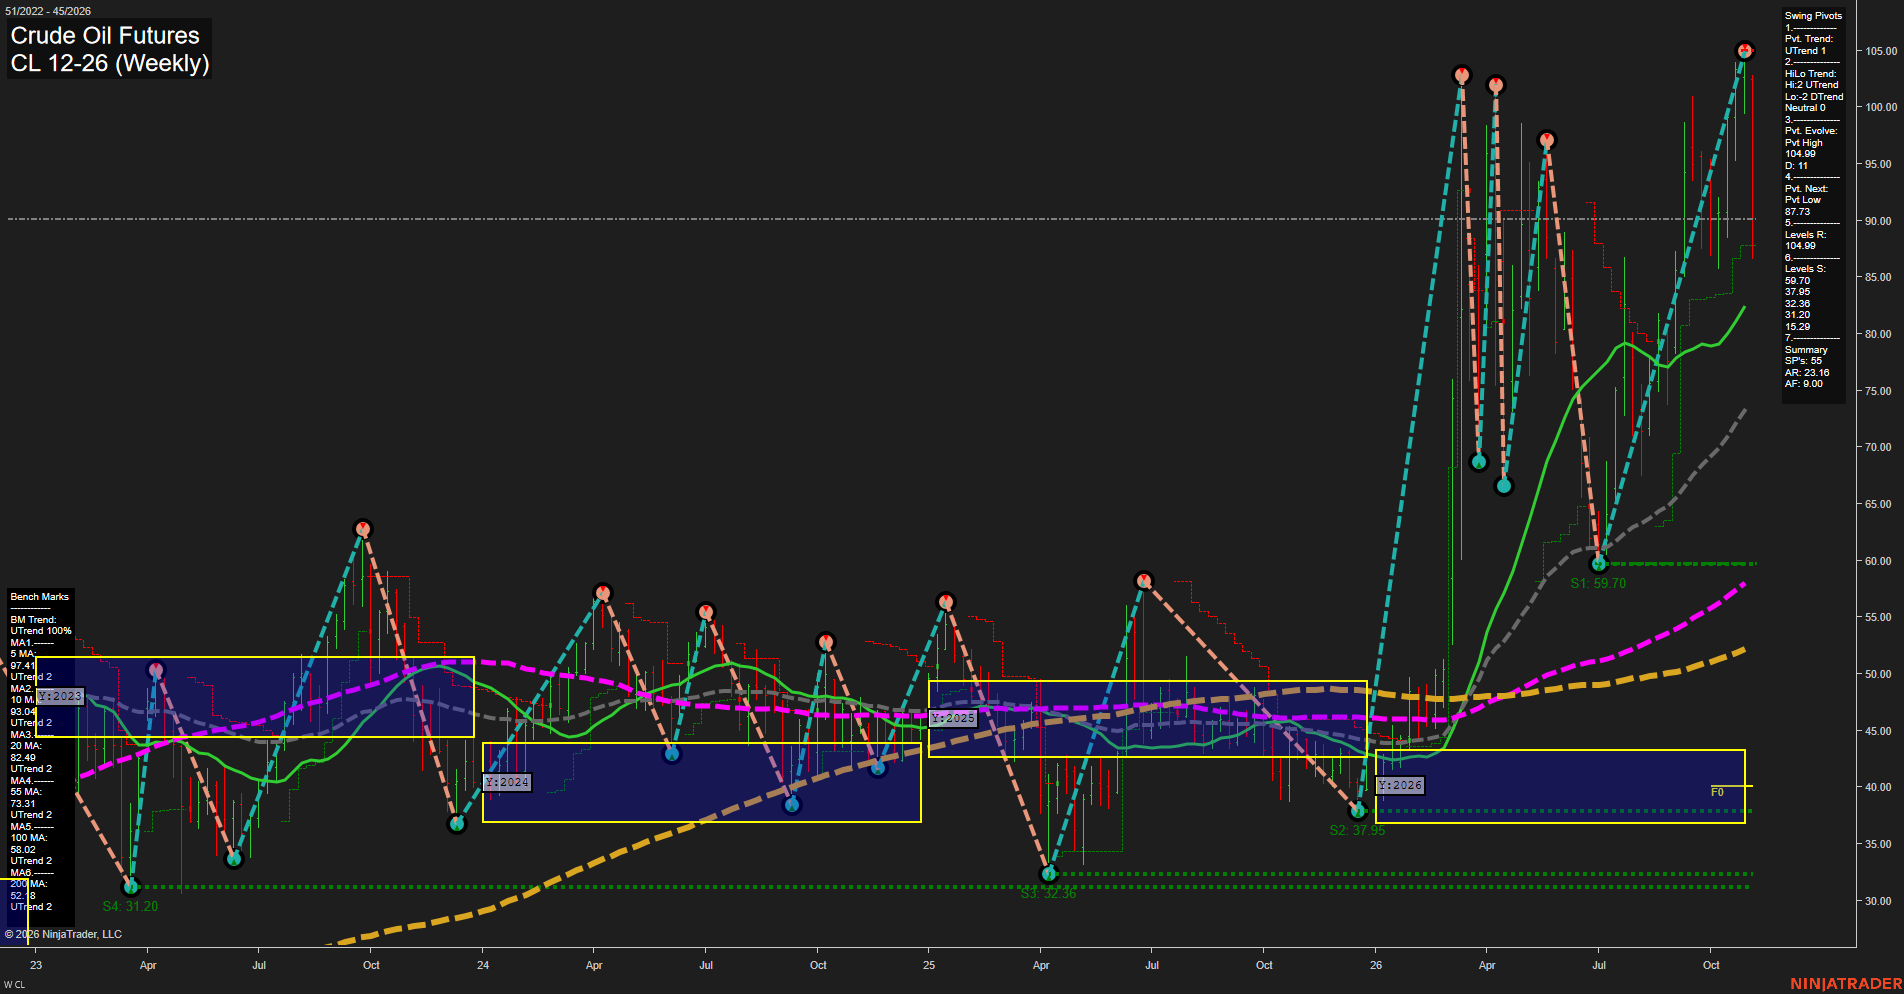
Overall Rating
- Short-Term: Bullish
- Intermediate-Term: Bullish
- Long-Term: Bullish.
Key Insights Summary
Crude oil is in an explosive weekly upswing, with large-range bars driving price to the 105.00 area and above every rising benchmark. The pivot structure remains in a short-term UTrend and the intermediate HiLo sequence is also upward, with 104.89 becoming the active pivot-high resistance area. The sharp advance is extended relative to the weekly and monthly fib-grid readings, which remain below their F0% references and retain Down trends, creating a notable countertrend condition versus the broader yearly Up trend. The 87.73 pivot-low reversal level is the key structural reference beneath the current rally, while 59.70 remains the major higher-level support from the prior base. The market’s dominant technical theme is a high-volatility upside continuation following a powerful recovery from the 2026 lows.
View charts on: AlphaWebTrader HTF Charts
GLD Weekly View
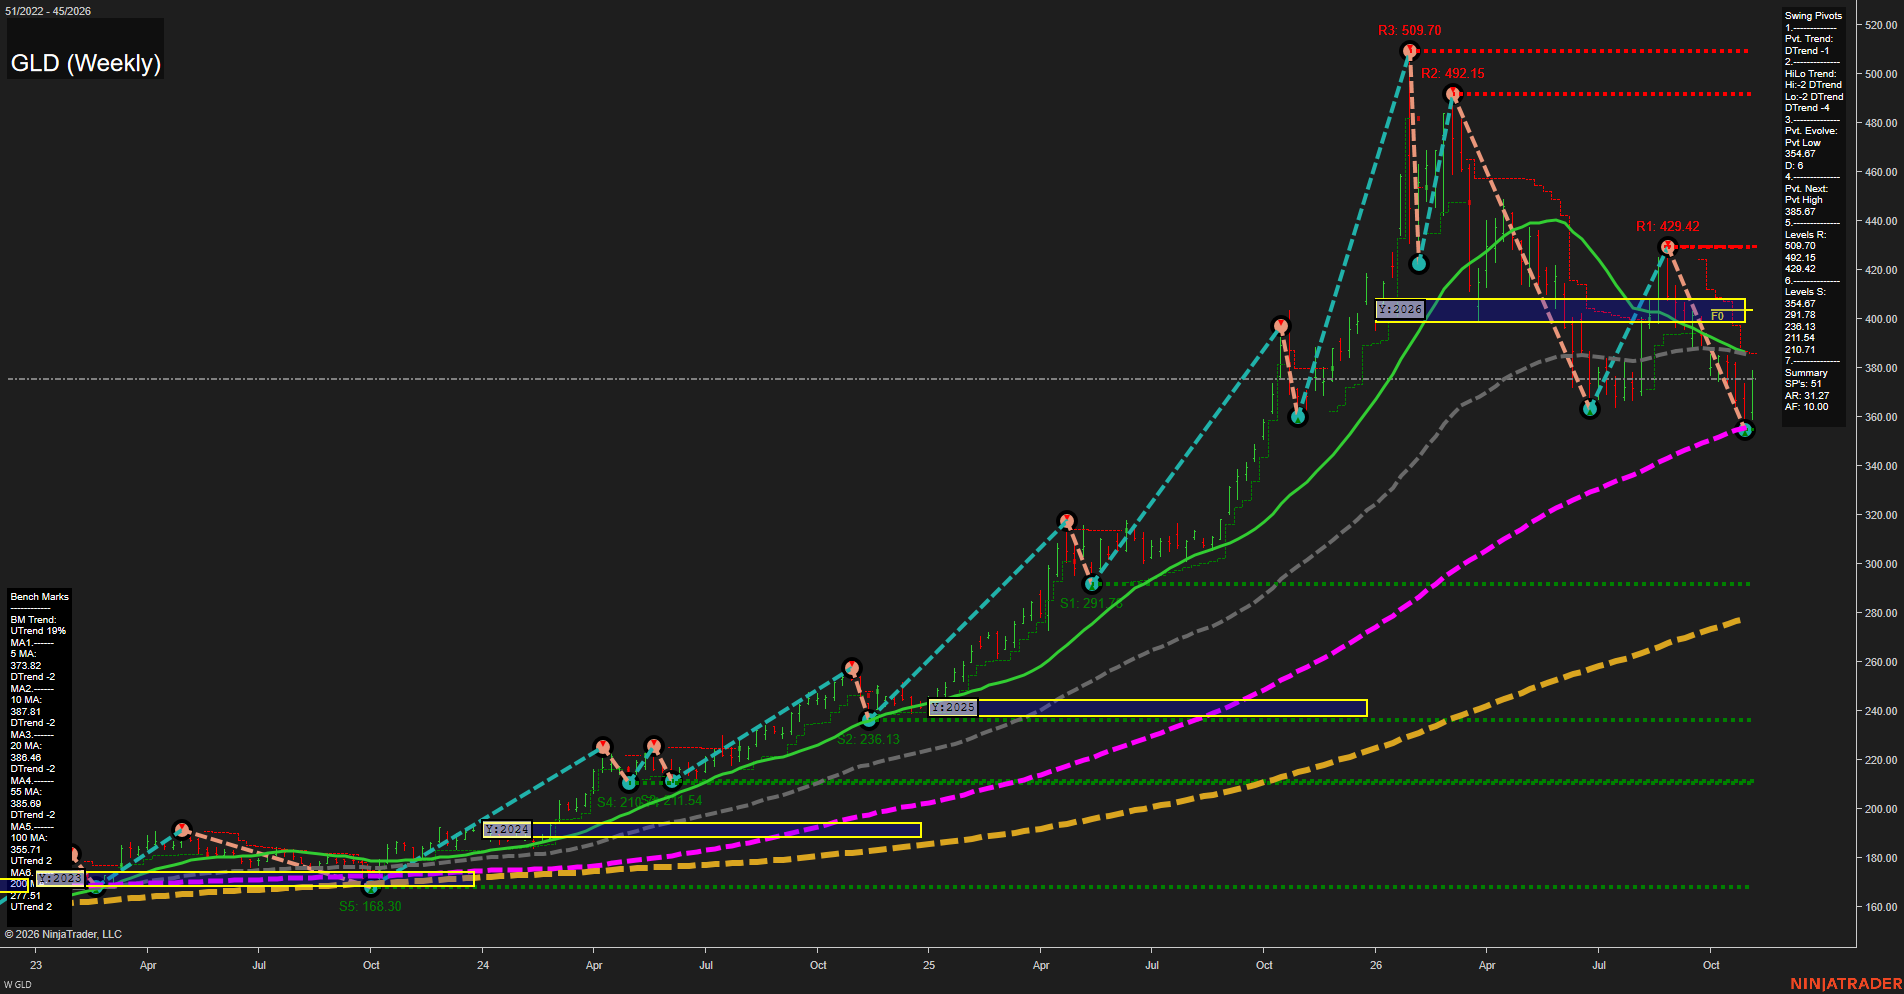
Overall Rating
- Short-Term: Bearish
- Intermediate-Term: Bearish
- Long-Term: Bullish.
Key Insights Summary
GLD is in a sharp weekly corrective downswing from the 429.42 pivot high, with a sequence of lower highs and lower lows confirming bearish short- and intermediate-term pivot structure. The 354.67 pivot low is the immediate structural reference beneath the market, while 385.67 is the reversal threshold required to establish the next short-term pivot high. Price is below the declining 10-, 20-, and 55-week benchmarks, reflecting persistent downside momentum; however, it remains above the rising 200-week benchmark, preserving the broader long-term bull-cycle structure despite the current high-volatility retracement.
View charts on: AlphaWebTrader HTF Charts
GC Weekly View
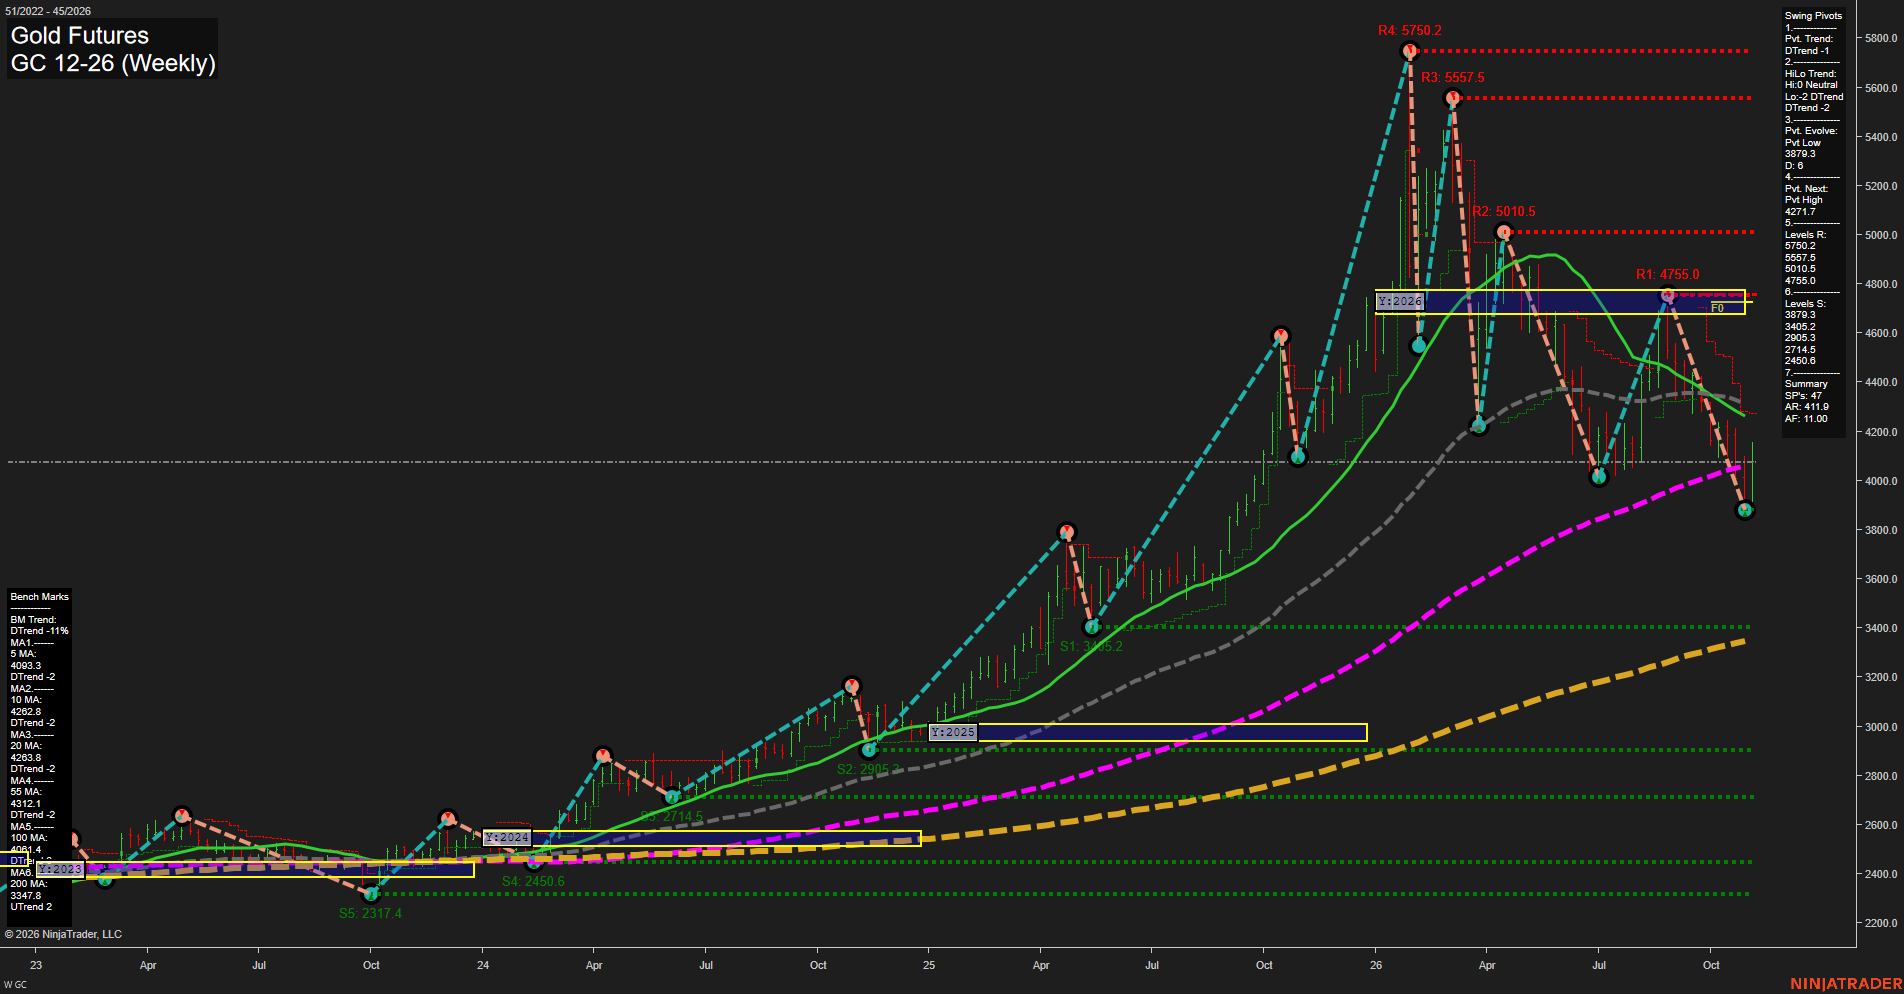
Overall Rating
- Short-Term: Bearish
- Intermediate-Term: Bearish
- Long-Term: Bullish.
Key Insights Summary
Gold is rebounding from the 3879.3 swing low, supported by recent weekly and monthly Fib-grid strength and the November long signals. However, the active pivot sequence remains a short-term DTrend, with price still below the declining 5-, 10-, 20-, and 55-week benchmarks. The 4755.0 to 5010.5 resistance zone defines the major recovery threshold, while 3879.3 remains the nearest structural support. Long-term structure remains constructive above rising 100- and 200-week averages, although the 2026 yearly grid remains in a counter-trend down phase below its F0% zone.
View charts on: AlphaWebTrader HTF Charts
ZB Weekly View
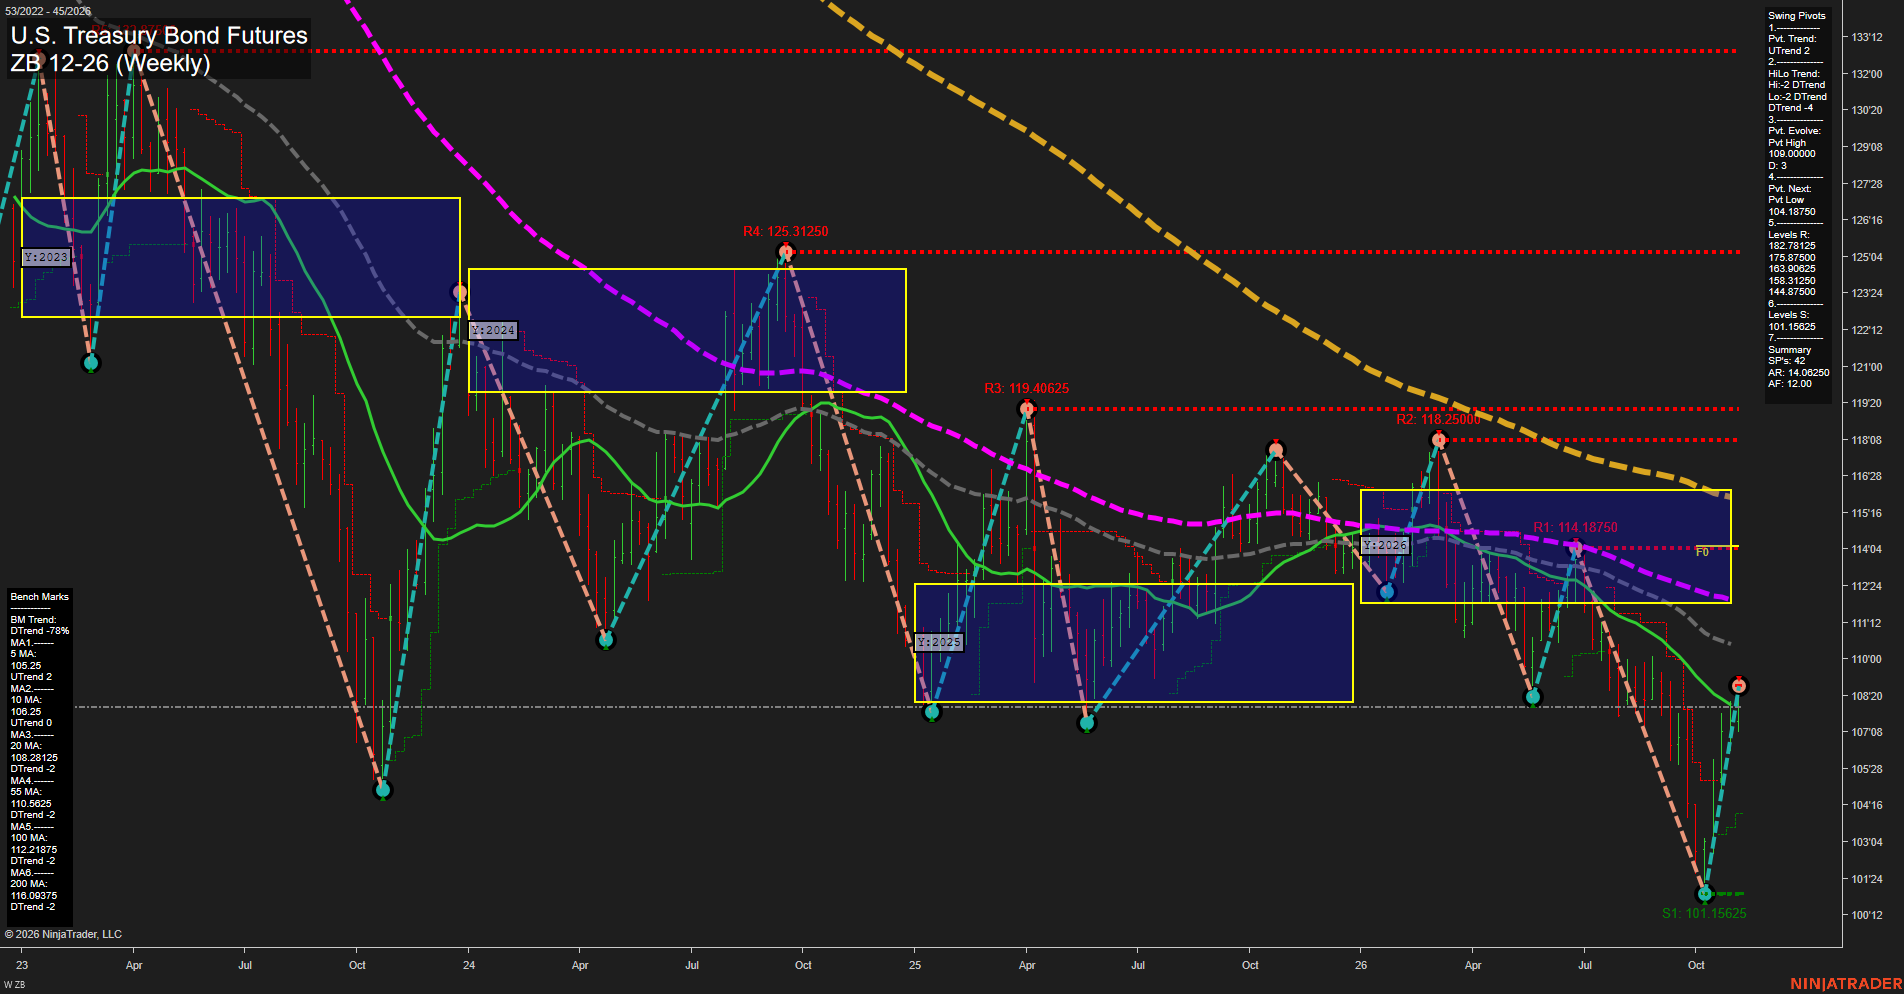
Overall Rating
- Short-Term: Bullish
- Intermediate-Term: Neutral
- Long-Term: Bearish.
Key Insights Summary
ZB has produced a sharp weekly recovery from the 101.15625 swing-low area, with price above the weekly and monthly F0% references and short-term pivots turning higher. The rebound has lifted price above the rising 5- and 10-week benchmarks and has restored fast upside momentum. The intermediate structure remains mixed because the HiLo pivot sequence is still down and price is testing the declining 20-week average near 108.28125. The broader yearly structure remains bearish, with price below the falling 55-, 100-, and 200-week benchmarks; the rally is therefore a strong countertrend recovery within a longer-term downtrend. The 104.18750 pivot-next level defines the current swing structure, while the 110.56250 to 114.18750 area represents the first meaningful overhead technical zone.
View charts on: AlphaWebTrader HTF Charts
Index ETFs
Negative confluence: average WOC% -3.14% from the week open; WNC% -2.46% versus the prior weekly close. All five index ETFs fell on both measures; DIA was most resilient and QQQ weakest on each. SPY and QQQ recorded fresh ATR-median bearish crossovers despite rising longer-term moving averages.