Stock futures rise ahead of Wednesday housing data at 8:30/10:00 ET, Treasury auctions at 11:30/13:00 ET and FOMC minutes at 14:00 ET; trends stay bearish.
Fundamentals: Stock futures rose on Nvidia’s earnings beat ahead of Wednesday’s housing data: permits and starts at 8:30 ET and pending sales at 10:00 ET. Treasury supply includes a $75 billion 17-week bill auction at 11:30 ET and a $16 billion 20-year bond auction at 13:00 ET, followed by FOMC minutes at 14:00 ET. Fed speeches round out the agenda. AI shares rebounded, while Nvidia’s leadership transition, reported SEC scrutiny and escalating U.S.–Iran attacks remained risks.
Technicals: U.S. stock index futures enter the session with bearish near- and medium-term readings after sharp selloffs. The S&P 500 and Nasdaq are below all six daily benchmarks, while the Dow and Russell 2000 test nearby lows. Longer-term weekly uptrends remain intact despite the correction. Germany's DAX also shows near-term weakness, but its medium- and far-term structures remain bullish.
Pre-Market Trading 360° view Market Radar of: holidays, earnings, eco-news, market-news summary, news sentiment, prior session major ETFs, MAG7, Higher Time Frame Analysis Indices Futures Summary, and E-mini S&P500, Nasdaq 100, NYMEX Crude, Gold Futures Daily Chart analysis.
As of: November 18, 2026 07:15 CT
EcoNews Radar U.S. Events
| Date | Impact | Event, Prev, Forecast, Actual | Info |
|---|---|---|---|
| 2026-11-18 Wednesday 07:30 | Medium | Fed's Waller speech Prev: — Forecast: — Actual: — | Public remarks can clarify views on inflation, employment and monetary policy; index futures traders monitor them for signals that could influence interest-rate expectations and equity valuations. |
| 2026-11-18 Wednesday 08:30 | Medium | Building Permits (MoM) Prev: 1.40M Forecast: 1.38M Actual: — | Tracks authorizations for residential construction, offering a forward-looking gauge of housing activity. Traders monitor it for clues about rate-sensitive demand and the economic growth outlook. |
| 2026-11-18 Wednesday 08:30 | Medium | Housing Starts (MoM) Prev: 1.22M Forecast: 1.27M Actual: — | Measures the initiation of residential construction projects. Traders watch it for evidence of housing investment momentum and potential implications for broader growth and construction-related earnings. |
| 2026-11-18 Wednesday 10:00 | Medium | Pending Home Sales (MoM) Prev: -7.3 Forecast: -2 Actual: — | Tracks signed contracts for existing-home purchases, providing an early indication of completed sales. Traders monitor it to assess housing demand and household sensitivity to financing costs. |
| 2026-11-18 Wednesday 10:30 | Low | EIA Crude Oil Stocks Change Prev: 4.66M Forecast: 0.40M Actual: — | Measures weekly changes in commercial crude inventories. Traders watch it for petroleum supply-demand signals that can affect energy shares and inflation expectations. |
| 2026-11-18 Wednesday 11:30 | Medium | 17-Week Bill Auction · $75B Prev: — Forecast: — Actual: — | Reveals demand and clearing yields for short-term government borrowing. Traders monitor the results for signals about money-market conditions and front-end interest rates. |
| 2026-11-18 Wednesday 12:15 | Medium | Fed's Daly speech Prev: — Forecast: — Actual: — | Public remarks provide insight into policymakers’ economic assessments and policy preferences. Traders monitor them for potential changes in the expected interest-rate path. |
| 2026-11-18 Wednesday 13:00 | High | 20-Year Bond Auction · $16B Prev: 5.46% Forecast: — Actual: — | Tests investor demand for long-duration government debt. Traders monitor yields and bidding strength because long-term financing costs influence equity discount rates and broader financial conditions. |
| 2026-11-18 Wednesday 13:35 | Medium | Fed's Barr speech Prev: — Forecast: — Actual: — | Public remarks may address economic conditions, monetary policy or financial stability. Traders monitor relevant comments for implications for rate expectations and financial-sector risk. |
| 2026-11-18 Wednesday 14:00 | High | FOMC Minutes Prev: — Forecast: — Actual: — | Details policymakers’ discussions, economic assessments and policy considerations from the latest meeting. Traders examine areas of agreement and disagreement for clues about the future interest-rate path. |
| 2026-11-18 Wednesday 14:30 | Medium | Fed's Williams speech Prev: — Forecast: — Actual: — | Public remarks can offer insight into the economic outlook and policy considerations. Traders monitor them for signals relevant to interest-rate expectations and equity discount rates. |
| 2026-11-18 Wednesday 16:15 | Medium | Fed's Kashkari speech Prev: — Forecast: — Actual: — | Public remarks may clarify assessments of inflation, employment and policy restraint. Traders watch for information that could alter expectations for future monetary policy. |
| 2026-11-19 Thursday 08:30 | Medium | Philadelphia Fed Manufacturing Survey Prev: 20.9 Forecast: 20.6 Actual: — | Surveys regional manufacturers about business conditions, including orders and employment. Traders monitor it as a timely indicator of industrial momentum and potential cost pressures. |
| 2026-11-19 Thursday 08:30 | Medium | Initial Jobless Claims Prev: 200K Forecast: 196K Actual: — | Counts new applications for unemployment benefits, providing a timely gauge of layoffs. Traders monitor labor-market strength for implications for growth, earnings and monetary policy. |
| 2026-11-19 Thursday 11:30 | Medium | 4-Week Bill Auction · $115B Prev: 3.955% Forecast: — Actual: — | Shows investor demand and the clearing yield for very short-term government debt. Traders monitor the outcome for context on cash-market conditions and near-term funding rates. |
| 2026-11-19 Thursday 11:30 | Medium | 8-Week Bill Auction · $110B Prev: — Forecast: — Actual: — | Measures demand and pricing for short-term Treasury financing. Traders watch the outcome for indications of liquidity conditions and the level of short-term market interest rates. |
| 2026-11-19 Thursday 12:30 | Medium | Fed's Goolsbee speech Prev: — Forecast: — Actual: — | Public remarks offer insight into policymakers’ views on growth, inflation and employment. Traders monitor them for potential implications for the expected policy-rate path. |
| 2026-11-19 Thursday 13:00 | High | 10-Year TIPS Auction · $19B Prev: 2.653% Forecast: — Actual: — | Reveals demand and clearing real yields for inflation-protected government debt. Traders monitor real borrowing costs because they influence equity valuations and help contextualize market inflation compensation. |
| 2026-11-19 Thursday 14:15 | Medium | Fed's Barr speech Prev: — Forecast: — Actual: — | Public remarks may cover monetary policy, economic conditions or financial stability. Traders monitor relevant comments for changes in rate expectations or assessments of financial-system risks. |
| 2026-11-19 Thursday 18:30 | Medium | Fed's Paulson speech Prev: — Forecast: — Actual: — | Public remarks can reveal views on the economy and monetary policy. Traders monitor relevant comments for clues about future interest rates and the policy outlook. |
| 2026-11-20 Friday 08:25 | Medium | Fed's Waller speech Prev: — Forecast: — Actual: — | Public remarks may refine views on economic conditions and the policy outlook. Traders watch for signals that could influence expected interest rates and equity valuations. |
| 2026-11-20 Friday 10:00 | Medium | Michigan Consumer Sentiment Index Prev: 51 Forecast: 52 Actual: — | Gauges households’ assessments of their finances and the broader economy. Traders monitor confidence for clues about consumer demand and the outlook for corporate revenues. |
| 2026-11-20 Friday 10:00 | Medium | UoM 1-year Consumer Inflation Expectations Prev: 4.3 Forecast: 4.3 Actual: — | Measures households’ anticipated price increases over the coming year. Traders monitor it for signs of near-term inflation psychology that may influence monetary-policy expectations. |
| 2026-11-20 Friday 10:00 | Medium | Michigan Consumer Expectations Index Prev: 50.9 Forecast: 50.9 Actual: — | Gauges households’ outlook for personal finances, business conditions and employment. Traders watch it for forward-looking signals about spending confidence and economic growth. |
| 2026-11-20 Friday 10:00 | Medium | UoM 5-year Consumer Inflation Expectation Prev: 3.4 Forecast: 3.4 Actual: — | Measures households’ longer-term inflation outlook. Traders monitor whether expectations remain anchored, an important consideration for monetary policy and longer-term interest rates. |
| 2026-11-20 Friday 12:15 | Medium | Fed's Cook speech Prev: — Forecast: — Actual: — | Public remarks can illuminate assessments of inflation, employment and financial conditions. Traders monitor them for implications for monetary-policy expectations and equity discount rates. |
Summary: The calendar centers on U.S. monetary-policy signals, Treasury financing and indicators of economic demand and inflation expectations.
Conclusion: The supplied high-impact releases are concentrated in policy deliberations and longer-duration Treasury auctions.
NYSE Session Open Gap Radar
Session gaps compare the predicted opening price with the prior session’s close to predict the upcoming session’s opening gap pattern.
| Instrument | Gap | Prior Close | Predicted Open | Gap % |
|---|---|---|---|---|
| QQQ | ▼ IGU | 656.95 | 661.21 | ▲ +0.65% |
| SPY | ▼ IGU | 732.44 | 733.92 | ▲ +0.20% |
| TLT | ▼ IGU | 79.55 | 79.60 | ▲ +0.06% |
| DIA | ▲ IGD | 507.31 | 506.85 | ▼ -0.09% |
| IJH | ▲ IGD | 71.75 | 71.63 | ▼ -0.17% |
| IWM | ▲ IGD | 269.05 | 268.21 | ▼ -0.31% |
| USO | ▲ IGD | 140.24 | 139.77 | ▼ -0.34% |
| GLD | ▼ OGD | 352.48 | 345.18 | ▼ -2.07% |
Before the session opens, the table shows the predicted opening price and gap. Once the session opens, it uses the recorded opening price.
Glossary: IGU — Inside Gap Up: above the prior close, within the prior session’s range. IGD — Inside Gap Down: below the prior close, within that range. OGU — Outside Gap Up: above the prior session’s high. OGD — Outside Gap Down: below the prior session’s low.
As of: 2026-11-18 07:15 CT. Predicted gaps are best estimates as of publication and may change before the regular-session open, particularly when the session is still some time away.
Market News Summary:
U.S. stock futures rose as Nvidia’s results supported AI shares, while leadership uncertainty, higher rates and U.S.–Iran attacks remained in focus.
Primary Drivers & Risks:
- Primary Driver: Nvidia earnings beat and strong revenue outlook
- Primary Risk: Nvidia leadership uncertainty and regulatory scrutiny
Tone:
Positive equity sentiment alongside company-specific, monetary-policy and geopolitical risks.
Data, Market and System
Geopolitical:
- American warplanes struck an Iranian missile launch site on Qeshm Island late Tuesday as U.S.–Iran retaliatory attacks intensified.
- Malaysia said data centers must comply with U.S. AI chip rules.
Gold / Metals:
- Gold faced selling pressure from dollar strength, elevated rates and weakening Chinese demand, with $3,500 identified as support despite record October ETF holdings.
Fed / Financials:
- Fed coverage pointed to another rate increase in December while describing the subsequent policy path as unclear.
- A Fed minutes release was identified as a near-term market event.
- The average conforming 30-year fixed mortgage rate rose to 7.35% from 7.21% last week, while refinance demand was down 54% year over year.
Macro / Other:
- J.P. Morgan projected developed-market fiscal deficits at their highest level since World War II outside recessions.
- Luxury-goods coverage described a return to sales growth in 2026 alongside a fragile outlook.
- Upcoming FICO, Costco and Ford updates were highlighted as sources of information on consumer credit, spending and the auto industry.
Conclusion:
Nvidia’s earnings beat and revenue guidance drove the premarket rebound in AI-related shares and supported U.S. stock futures. Its leadership transition and reported SEC scrutiny remained central counterweights.
Higher mortgage rates and December Fed tightening coverage added monetary-policy concerns. Escalating U.S.–Iran attacks supplied a separate geopolitical risk, while gold remained under pressure from the dollar and elevated rates.
Market News Sentiment
Sentiment Bias shows the balance of positive and negative news coverage sampled from 2026-11-17 08:16 to 2026-11-18 08:06 ET, covering stocks, energy and gold.
▼ Market news
- Bias
- ▼ -7.54%
- Articles
- 305
- Positive
- ▲ 24.92%
- Neutral
- — 42.62%
- Negative
- ▼ 32.46%
▼ GLD / Gold
- Bias
- ▼ -55.56%
- Articles
- 18
- Positive
- ▲ 11.11%
- Neutral
- — 22.22%
- Negative
- ▼ 66.67%
Sentiment Summary: Gold coverage was 67% negative, with dollar strength, elevated yields and expectations of further Fed tightening dominating November 17–18 reports ahead of the October Fed meeting minutes. October retail sales, released November 17, rose 0.2%, while core sales increased 0.6%; gold traded near session lows after the release. Record October ETF holdings and healthy Indian demand provided counterweights, while falling Treasury yields supported rebound attempts on November 17 without reversing the negative coverage balance.
Conclusion: For indices futures, the main cross-market context is persistent rate pressure alongside slowing headline consumer-spending growth.
▼ USO / Oil
- Bias
- ▼ -66.67%
- Articles
- 6
- Positive
- — 0.00%
- Neutral
- — 33.33%
- Negative
- ▼ 66.67%
Sentiment Summary: Oil coverage was 67% negative and 33% neutral, with no positive articles, as November 17 reports emphasized rising U.S. crude inventories and the IEA’s surplus forecast; early November 18 coverage reported further price declines amid global surplus expectations. Middle East tensions, tanker attack risks and threats to regional shipments provided the main counterweight, supporting a reported rebound on November 17 but failing to outweigh supply concerns in subsequent coverage.
Conclusion: The main market context was oil weakness driven by surplus concerns, with shipping disruptions remaining a countervailing supply risk.
Glossary: Sentiment Bias = (positive articles − negative articles) ÷ total articles × 100. It ranges from −100% negative to +100% positive. A reading near zero indicates little directional bias. Neutral articles reduce the score’s strength. ▲ positive; ▼ negative; — balanced. These readings describe news coverage, not market-price direction.
Market Technical Analysis
Analysis of VIX volatility, prior-session major ETFs and mega-cap tech stocks, and real-time futures snapshots and higher-time-frame analysis.
VIX — Market Fear Gauge Daily
| Level | Open | High | MaxVix | Low | MinVix | DNC% | DOC% | VR | MaxVR | MinVR |
|---|---|---|---|---|---|---|---|---|---|---|
| 25.45 | 23.02 | 27.73 | 28.36 | 22.39 | 16.21 | +11.09% | +10.56% | 10.92 | 56.57 | -6.27 |
VIX rose 10.56% from the session's opening level. VIX rose 11.09% versus the previous session close. Expected volatility rose from the period open. VIX is 76.0% up the recent 15-session range (16.21–28.36), in the 70–80% band.
VR: ATN Volatility Ratio (VR): 10.92 – Stocks fell while expected volatility rose. VR is in the lower part of its preceding 15-session VR range (-6.27 to 56.57), in the 20–30% band. VR rose 4.75 points from the previous session, a small shift relative to that range.
Range lookback: preceding 15 completed sessions.
Major ETFs and Mega Cap Tech Stocks
- U.S. stock futures traded higher Wednesday morning after Nvidia’s outlook helped halt a multiday technology selloff.
- Nvidia reported third-quarter revenue of $115.84 billion, up 103% and above the $109.3 billion consensus, with data-center revenue reaching $107.6 billion.
- Nvidia guided fourth-quarter revenue to $130 billion, plus or minus 3%, excluding data-center compute revenue from China.
- Premarket gains extended across AI infrastructure shares, with CoreWeave rising more than 4%, Nebius more than 6% and Iren more than 5%.
- Nvidia named finance chief Colette Kress interim leader following Jensen Huang’s departure, while reports described a permanent-CEO search and an SEC probe.
- Nvidia’s financing of neocloud customers and questions about buybacks featured alongside its earnings coverage.
- The S&P 500 had recorded four consecutive losses, while Apple remained the only Magnificent Seven stock near a record.
ETF, Mag7, and Cross-Market ETF prior day Insights
Overall Tone
The November 17, 2026 daily session was risk-off, with broad equity losses from the open and versus the prior close, while bonds offered limited divergence.
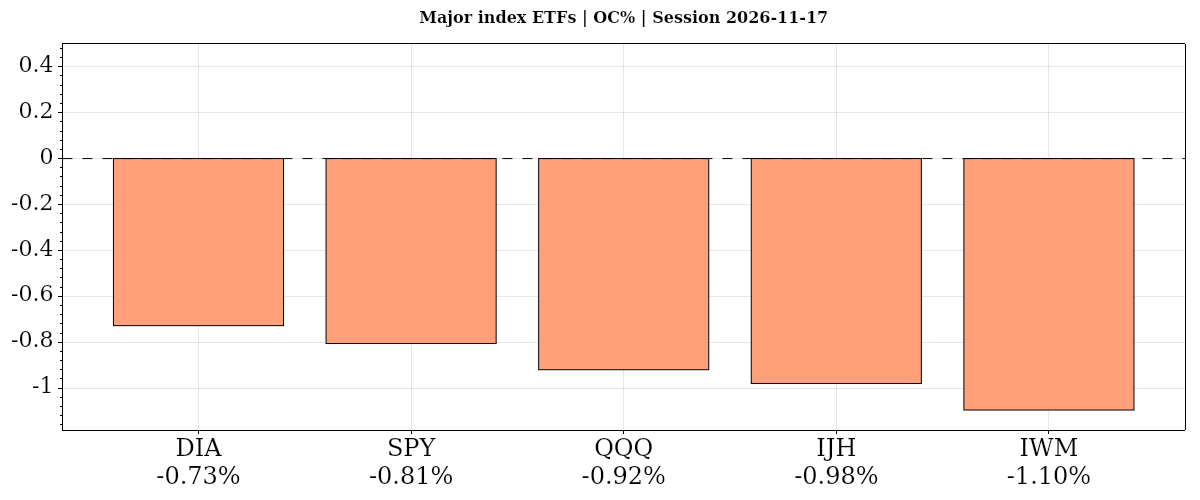
| Instrument | Bias | Date | DNC% | DOC% | O | H | L | C | VWAP | Vol |
|---|---|---|---|---|---|---|---|---|---|---|
| ▼ DIA | ▼ ▼ ▼ | 2026-11-17 | ▼ -1.62% | ▼ -0.73% | 511.03 | 514.27 | 505.29 | 507.31 | ▼ 509.02 | 3,776,995 |
| ▼ SPY | ▼ ▼ ▲ | 2026-11-17 | ▼ -1.01% | ▼ -0.81% | 738.39 | 739.76 | 727.00 | 732.44 | ▲ 731.96 | 68,604,858 |
| ▼ QQQ | ▼ ▼ ▲ | 2026-11-17 | ▼ -0.73% | ▼ -0.92% | 663.05 | 663.36 | 646.64 | 656.95 | ▲ 654.89 | 51,215,685 |
| ▼ IJH | ▼ ▼ ▼ | 2026-11-17 | ▼ -1.31% | ▼ -0.98% | 72.46 | 72.85 | 71.50 | 71.75 | ▼ 72.00 | 9,420,156 |
| ▼ IWM | ▼ ▼ ▼ | 2026-11-17 | ▼ -1.43% | ▼ -1.10% | 272.03 | 273.05 | 267.87 | 269.05 | ▼ 269.96 | 28,269,425 |
| AVG/Sum | — | — | -1.22% | -0.91% | — | — | — | — | — | 161,287,119 |
Index ETFs
Negative confluence: average DOC% -0.91% from the open and DNC% -1.22% versus the prior close. All five index ETFs fell on both comparisons: DIA lost least from the open but most versus the prior close, while QQQ showed greatest prior-close resilience and IWM lagged from the open. SPY’s decline featured above-average range and volume.
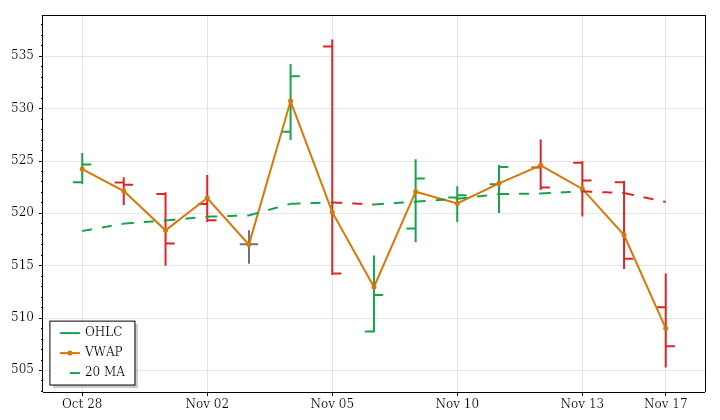
DIA · D:2026-11-17 NC% ▼ -1.62% OC% ▼ -0.73%
DIA – Dow Jones Technicals Summary
DIA's completed November 17 daily session fell to 507.31, losing 1.62% versus the prior close and 0.73% from the open. An unfilled opening gap down accounted for part of the loss, followed by further intraday weakness. The lower high, lower low and close beneath the previous day's low reinforced the bearish result, while finishing below session VWAP showed that the close also lagged the day's volume-weighted trading level.
Near-term averages were falling above price. Intermediate- and far-term averages still rose slightly, but price had fallen below both, leaving those horizons mixed rather than securely bullish. The second consecutive large-range session fit the prior fifteen sessions' expanding-range pattern. Volume was close to, but below, average amid a declining volume trend. A fresh bearish ATR-median crossover reinforced weakness; a PSAR bullish reversal would require a next-session high above 523.2189.
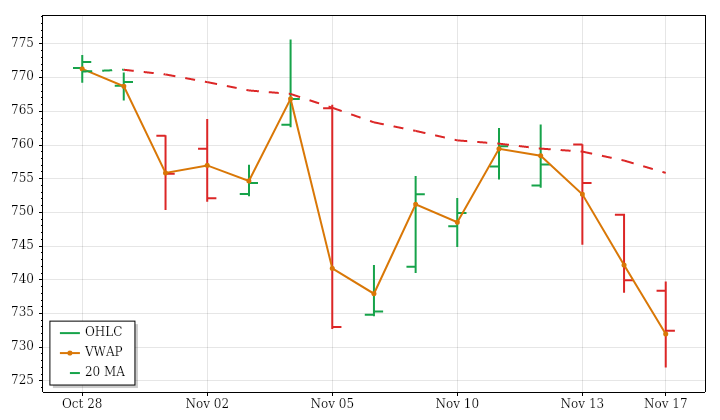
SPY · D:2026-11-17 NC% ▼ -1.01% OC% ▼ -0.81%
SPY – S&P 500 Technicals Summary
SPY's completed November 17 daily session dropped to 732.44, losing 1.01% from the prior close and 0.81% from the open. The opening gap down remained unfilled, and price formed a lower high and lower low before closing beneath the previous day's low. The finish was slightly above session VWAP, a modest intraday distinction within an otherwise negative daily result.
Near- and intermediate-term averages were falling above price. The far-term average remained rising, but price was below it, leaving the longer horizon mixed rather than fully bearish. This was the third consecutive large-range session, consistent with expanding ranges over the prior fifteen sessions. Volume was about 32% above average, also matching increasing participation across that window. PSAR and ATR-median remained bearish; a next-session high above 760.9051 would be required for a PSAR bullish reversal.
S&P 500 News and Fundamentals
The S&P 500 traded below its 200-day moving average on November 17 as semiconductor selling and weakness in the artificial-intelligence trade pressured the index ahead of Nvidia’s earnings. The Federal Reserve’s next interest-rate decision is scheduled for December 9.
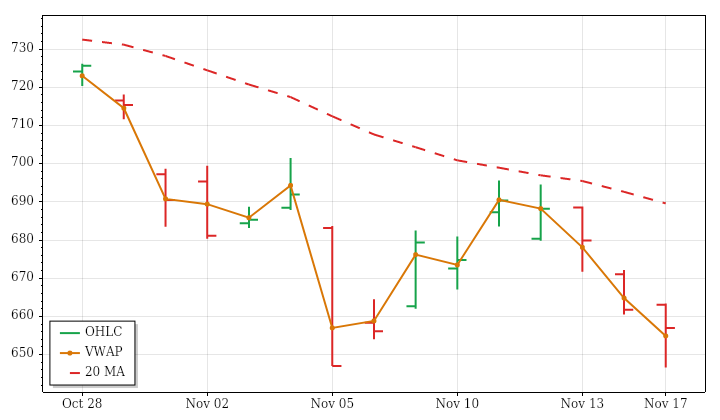
QQQ · D:2026-11-17 NC% ▼ -0.73% OC% ▼ -0.92%
QQQ – Nasdaq 100 Technicals Summary
QQQ's completed November 17 daily session fell to 656.95, down 0.73% from the prior close and 0.92% from the open. The opening gap up was filled, followed by a lower high and lower low and a close below the previous day's low. Finishing above session VWAP offered a limited intraday counterpoint, not a reversal of the day's negative price action.
Near-, intermediate- and far-term averages were all falling above price, placing the latest decline in alignment with the broader downward structure. The prior fifteen sessions likewise showed a falling price trend with substantial intervening fluctuation. The day's above-average range matched expanding ranges across that window, whereas volume remained slightly below average alongside a gently declining volume trend. ATR-median remained bearish and PSAR was in a short state; a next-session high above 695.57 would trigger a PSAR bullish reversal.
IJH · D:2026-11-17 NC% ▼ -1.31% OC% ▼ -0.98%
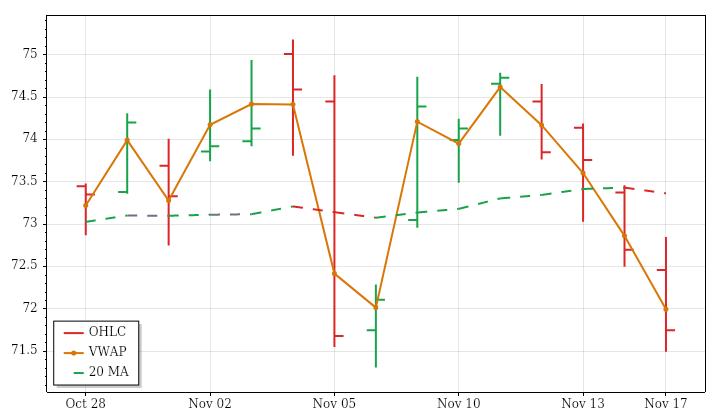
IJH – Mid Cap Technicals Summary
IJH's completed November 17 daily session closed at 71.75, down 1.31% from the prior close and 0.98% from the open. The opening gap down was filled, but that recovery gave way to a finish beneath the previous day's low and session VWAP. A lower high and lower low further distinguished the session from a simple gap-driven decline.
Price was below all three trend benchmarks. The near-term average still rose and the far-term average was almost flat but rising, leaving those horizons mixed; the intermediate-term structure was already bearish. The prior fifteen sessions had made almost no directional progress despite a slightly positive fitted price trend. Above-average range and volume matched expanding ranges and increasing participation across that window. ATR-median crossed bearish, while a next-session high above 74.7899 would be needed for a PSAR bullish reversal.
IWM · D:2026-11-17 NC% ▼ -1.43% OC% ▼ -1.10%
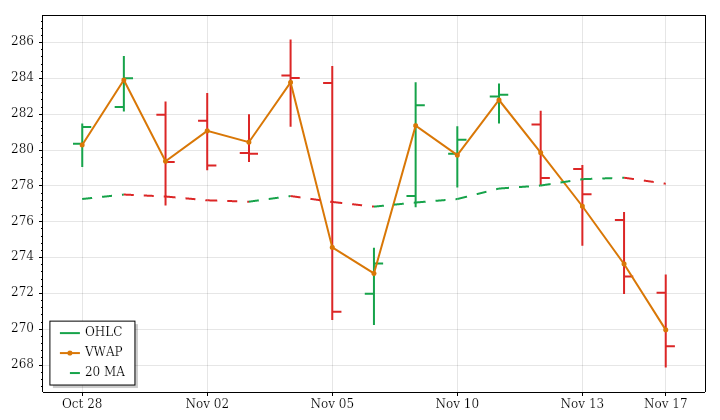
IWM – Small Cap Technicals Summary
IWM's completed November 17 daily session dropped to 269.05, losing 1.43% versus the prior close and 1.10% from the open. Its opening gap down was recovered during two-way trading, but price ultimately closed below the previous day's low. The lower high and lower low and finish below session VWAP reinforced the day's negative direction rather than suggesting that the gap recovery had changed the setup.
Near-, intermediate- and far-term averages were all falling above price, aligning the latest decline with the broader trend structure. The prior fifteen sessions also trended lower, though substantial back-and-forth movement limited net progress. Range was above average and volume about 15% above average, consistent with expanding ranges and rising participation in the lookback. PSAR and ATR-median remained bearish; a next-session high above 279.8277 would conditionally reverse PSAR upward.
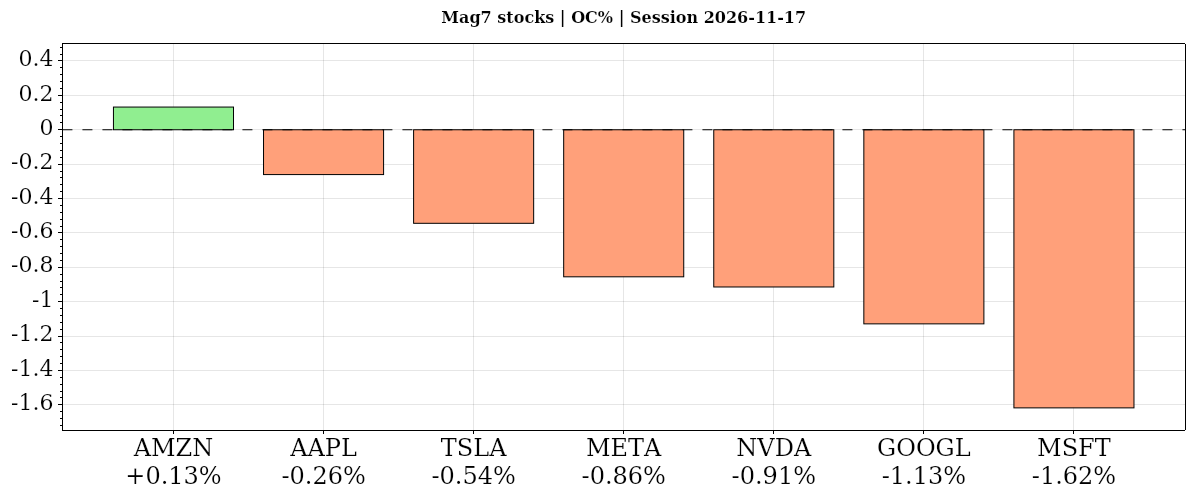
| Instrument | Bias | Date | DNC% | DOC% | O | H | L | C | VWAP | Vol |
|---|---|---|---|---|---|---|---|---|---|---|
| ▲ AMZN | ▲ ▲ ▲ | 2026-11-17 | ▲ +0.05% | ▲ +0.13% | 257.55 | 259.90 | 254.00 | 257.89 | ▲ 257.12 | 36,616,292 |
| ▼ AAPL | ▼ ▼ ▲ | 2026-11-17 | ▼ -0.25% | ▼ -0.26% | 352.83 | 355.36 | 349.67 | 351.91 | ▲ 351.84 | 36,298,480 |
| ▼ TSLA | ▲ ▼ ▲ | 2026-11-17 | ▲ +0.10% | ▼ -0.54% | 382.19 | 382.84 | 374.13 | 380.11 | ▲ 379.76 | 21,967,510 |
| ▼ META | ▼ ▼ ▼ | 2026-11-17 | ▼ -1.20% | ▼ -0.86% | 624.21 | 627.48 | 613.51 | 618.87 | ▼ 620.05 | 12,640,686 |
| ▼ NVDA | ▼ ▼ ▲ | 2026-11-17 | ▼ -0.44% | ▼ -0.91% | 156.90 | 158.19 | 150.33 | 155.46 | ▲ 154.00 | 358,937,347 |
| ▼ GOOGL | ▼ ▼ ▼ | 2026-11-17 | ▼ -1.24% | ▼ -1.13% | 283.40 | 284.09 | 278.46 | 280.20 | ▼ 280.79 | 31,326,193 |
| ▼ MSFT | ▼ ▼ ▲ | 2026-11-17 | ▼ -2.27% | ▼ -1.62% | 514.57 | 515.64 | 496.51 | 506.24 | ▲ 504.94 | 27,298,296 |
| AVG/Sum | — | — | -0.75% | -0.74% | — | — | — | — | — | 525,084,804 |
Mag7 Stocks
Negative confluence: average DOC% -0.74% from the open and DNC% -0.75% versus the prior close. Amazon alone gained from the open, while Microsoft lagged on both comparisons; Tesla’s small prior-close gain contrasted with its open-to-close loss. Nvidia’s decline remained aligned with downtrends across moving-average horizons despite closing above VWAP.
AMZN · D:2026-11-17 NC% ▲ +0.05% OC% ▲ +0.13%
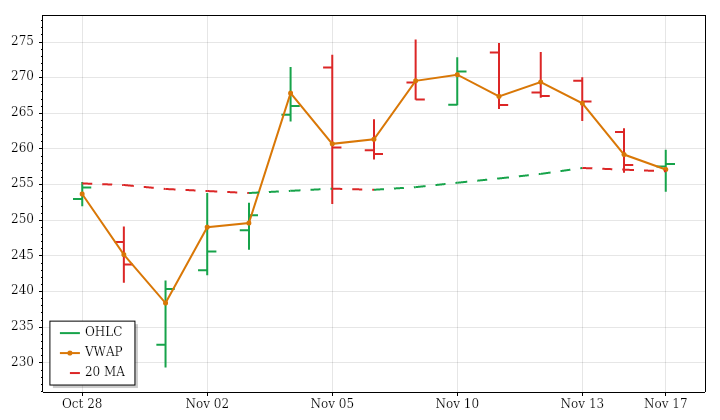
AMZN – Amazon Technicals Summary
AMZN's completed November 17 daily session ended at 257.89, gaining 0.05% from the prior close and 0.13% from the open after recovering its opening gap down. The small advance occurred within two-way trading, with a lower high and lower low and a close inside the previous day's range. Finishing above session VWAP provided a constructive intraday distinction, but price made little net progress.
The broader structure remained divided. Price was below its rising near-term average but above rising intermediate- and far-term averages, leaving short-term positioning weaker than the longer-term trend. The prior fifteen sessions showed an upward price trend with limited directional efficiency. Below-average range and volume matched contracting ranges and declining volume across that window. PSAR had turned bearish despite the positive close; only a next-session high above 274.273 would trigger its bullish reversal.
Amazon News and Fundamentals
ULA said preliminary data suggested its Vulcan rocket’s first stage underperformed shortly after liftoff on Sunday, preventing 40 Amazon Leo satellites from reaching orbit.
AAPL · D:2026-11-17 NC% ▼ -0.25% OC% ▼ -0.26%
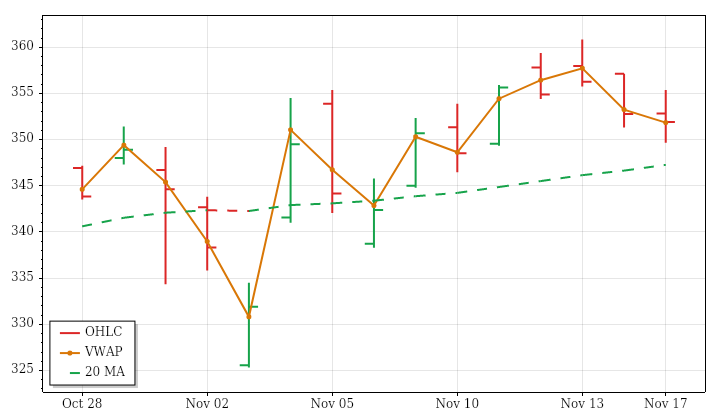
AAPL – Apple Technicals Summary
AAPL's completed November 17 daily session slipped to 351.91, down 0.25% from the prior close and 0.26% from the open. Trading crossed both sides of the open, produced a lower high and lower low, and ended inside the previous day's range. The close remained marginally above session VWAP, tempering the weakness without changing the day's negative result.
The pullback left price below a rising near-term average, creating mixed short-term positioning rather than a fully aligned decline. Intermediate- and far-term averages remained rising beneath price, consistent with the upward price trend over the prior fifteen sessions, although progress was choppy. Both the day's range and volume were below average, matching lookback contraction and declining participation. PSAR remained bullish, but a next-session low below 349.67 would conditionally trigger a bearish reversal.
Apple News and Fundamentals
Apple experienced service outages on November 17 and was working to restore services after an internal update caused disruption. Separately, Apple will stand trial in Paris in June 2027 over allegations that it organized the planned obsolescence of several iPhone models by preventing repairs outside official outlets, a source close to the case told AFP.
TSLA · D:2026-11-17 NC% ▲ +0.10% OC% ▼ -0.54%
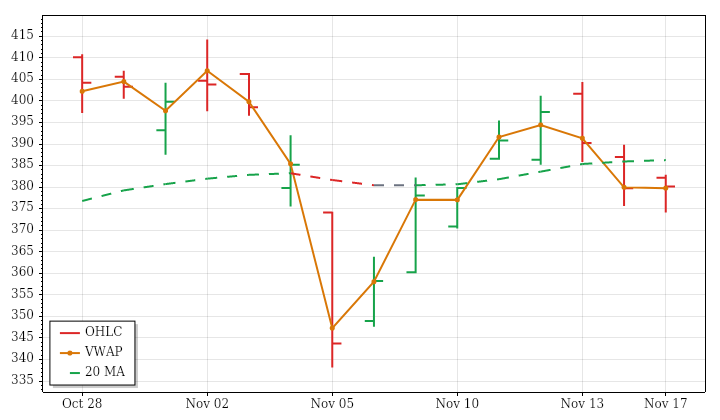
TSLA – Tesla Technicals Summary
TSLA's completed November 17 daily session ended at 380.11, up 0.10% from the prior close but down 0.54% from the open. That distinction matters: the opening gap up was filled, and the small daily gain did not represent an intraday advance. Price formed a lower high and lower low, stayed inside the previous day's range and finished marginally above session VWAP.
The near-term average was falling above price. Intermediate-term positioning was mixed, with price just below a rising average, while price remained above a falling far-term average. The prior fifteen sessions also showed a downward but highly uneven price trend. Range and volume were well below average; the narrow session contrasted with lookback range expansion, while light participation matched declining volume. PSAR and ATR-median were bullish, but a next-session low below 363.3715 would conditionally reverse PSAR downward.
Tesla News and Fundamentals
Tesla plans to invest €3 billion, approximately $3.3 billion, to expand its Grünheide Gigafactory in Germany with a facility designed to produce up to 1 million Cybercabs annually. Elon Musk also criticized the Cybercab’s $299 fee as too high. Separately, Tesla was reported to be sold out of Megapacks and considering a large Texas solar plant.
META · D:2026-11-17 NC% ▼ -1.20% OC% ▼ -0.86%
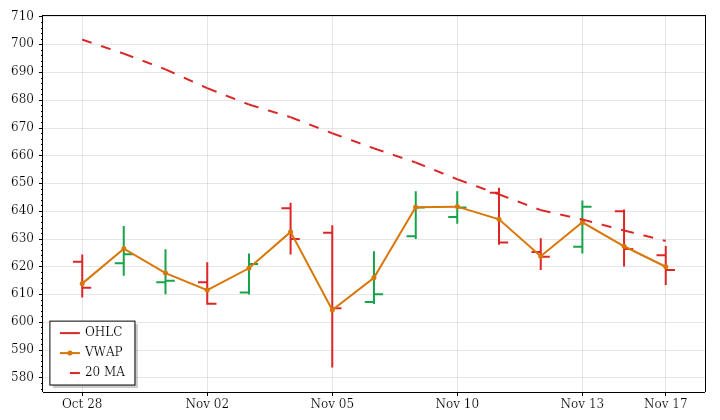
META – Meta Platforms Technicals Summary
META's completed November 17 daily session fell to 618.87, down 1.20% from the prior close and 0.86% from the open. An early recovery filled the opening gap down, but price still formed a lower high and lower low and closed beneath the previous day's low. The finish below session VWAP added to the weak daily picture.
Near- and intermediate-term averages were falling above price. The far-term average remained slightly rising, but price was below it, leaving that horizon mixed. Although the prior fifteen sessions had a positive fitted price trend, extremely low directional efficiency showed little sustained net progress. The day's range was below average despite lookback expansion, and volume was only about 56% of average amid declining participation. ATR-median remained bullish against bearish PSAR; a next-session high above 648.4499 would trigger PSAR's bullish reversal.
Meta News and Fundamentals
Meta is testing Direct, a standalone messaging app housing Instagram’s direct messages. The app is initially launching in Turkey and Thailand and can be used with or without an Instagram account.
NVDA · D:2026-11-17 NC% ▼ -0.44% OC% ▼ -0.91%
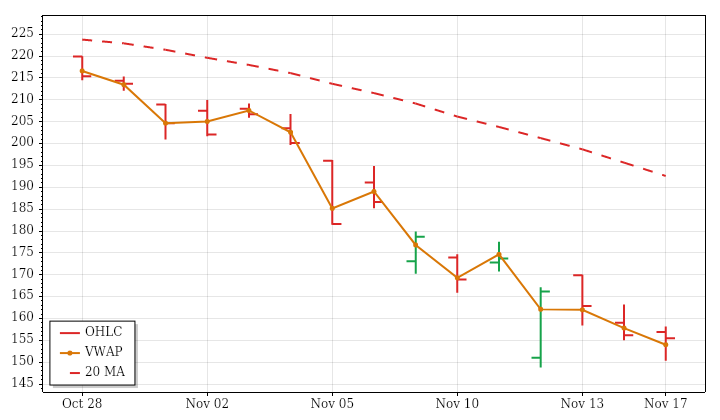
NVDA – Nvidia Technicals Summary
NVDA's completed November 17 daily session closed at 155.46, down 0.44% versus the prior close and 0.91% from the open. The opening gap up was erased, and the session produced a lower high and lower low while finishing inside the previous day's range. Price nevertheless closed above session VWAP, providing an intraday contrast to the negative open-to-close result.
Near-, intermediate- and far-term averages were all falling above price, aligning the broader structure with the steep downward price trend over the prior fifteen sessions. That lookback showed relatively persistent directional movement alongside expanding ranges and increasing volume. The latest range was slightly below average, but volume was about 36% above average, maintaining elevated participation despite less range. PSAR and ATR-median stayed bearish; a next-session high above 165.76 would conditionally trigger a PSAR bullish reversal.
Nvidia News and Fundamentals
Nvidia reported third-quarter revenue of $115.84 billion, exceeding analysts’ $109.10 billion estimate, in Colette Kress’s first earnings report as interim CEO following Jensen Huang’s resignation last week. Its quarterly revenue forecast reached $130 billion, and its fiscal 2028 sales-growth forecast rose to 75% from 70%. Nvidia also disclosed private-company stakes worth $65.5 billion, up from $22 billion in January, reflecting new investments and valuation increases.
GOOGL · D:2026-11-17 NC% ▼ -1.24% OC% ▼ -1.13%
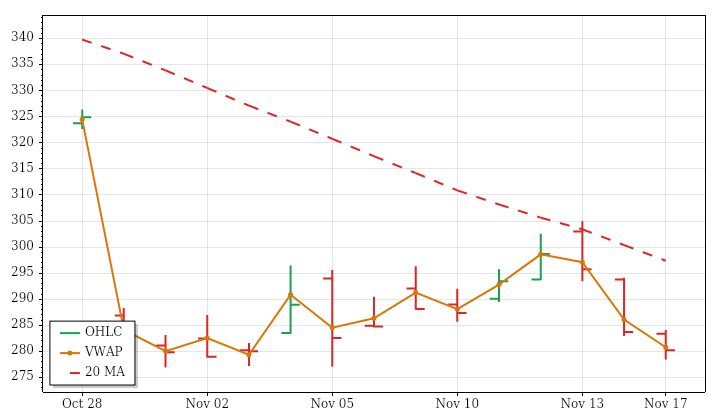
GOOGL – Alphabet Technicals Summary
GOOGL's completed November 17 daily session declined to 280.20, down 1.24% versus the prior close and 1.13% from the open. The small opening gap down was filled, but the recovery did not hold. A lower high and lower low accompanied a close beneath the previous day's low and session VWAP, tying the negative daily result to a weaker underlying price structure.
Near-, intermediate- and far-term averages were all falling above price, so there was no trend conflict across those horizons. The prior fifteen sessions also showed a downward price trend, although movement was not consistently one-directional. The latest range was below average despite expanding ranges over that lookback; volume was also below average, consistent with declining participation. ATR-median registered a bearish crossover. A next-session high above 304.9699 would conditionally trigger a PSAR bullish reversal.
MSFT · D:2026-11-17 NC% ▼ -2.27% OC% ▼ -1.62%
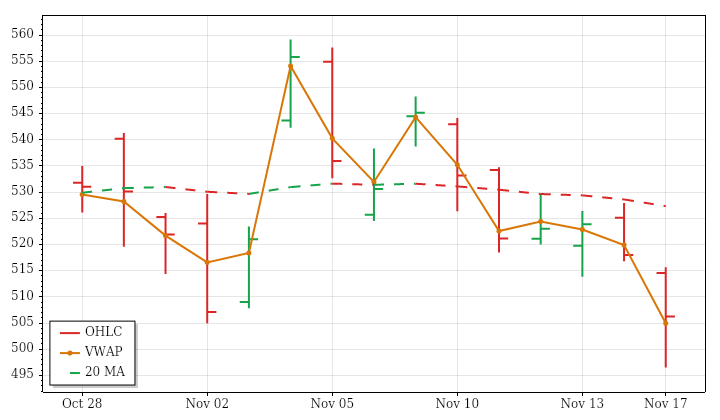
MSFT – Microsoft Technicals Summary
MSFT's completed November 17 daily session declined to 506.24, losing 2.27% from the prior close and 1.62% from the open. The opening gap down remained unfilled, and a lower high and lower low accompanied a close beneath the previous day's low. Nevertheless, the close finished above session VWAP, an intraday offset that did not erase the substantial daily loss.
Price was below rising near- and intermediate-term averages, leaving those horizons mixed, while the far-term uptrend remained intact beneath price. This separated immediate weakness from the still-rising longer-term structure. The day's above-average range ran against contracting ranges over the prior fifteen sessions. Volume was below average, consistent with the lookback's declining participation. PSAR and ATR-median were bearish; a next-session high above 553.8648 would be required to trigger a PSAR bullish reversal.
Microsoft News and Fundamentals
Microsoft is making voluntary exit offers to engineers for the first time while increasing AI investment, with plans to spend $50 billion on AI capital expenditure this quarter. On November 17, Baseten announced a partnership bringing open-model inference to Microsoft Foundry in public preview, with Azure customers billed through existing Microsoft agreements. Atlan also announced a collaboration extending lineage and governance capabilities across data inside and beyond Microsoft Fabric, alongside the OneLake catalog.
| Instrument | Bias | Date | DNC% | DOC% | O | H | L | C | VWAP | Vol |
|---|---|---|---|---|---|---|---|---|---|---|
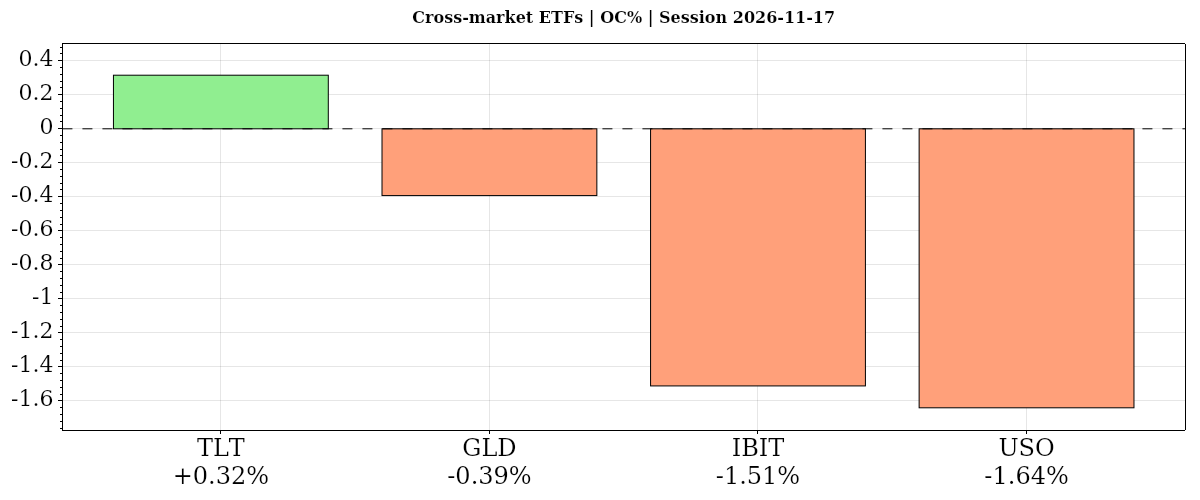
| ▲ TLT | ▲ ▲ ▼ | 2026-11-17 | ▲ +0.21% | ▲ +0.32% | 79.30 | 79.77 | 79.23 | 79.55 | ▼ 79.58 | 33,256,090 |
| ▼ GLD | ▼ ▼ ▼ | 2026-11-17 | ▼ -0.13% | ▼ -0.39% | 353.87 | 356.53 | 352.00 | 352.48 | ▼ 354.14 | 7,822,304 |
| ▼ IBIT | ▼ ▼ ▼ | 2026-11-17 | ▼ -1.77% | ▼ -1.51% | 36.70 | 37.01 | 35.78 | 36.14 | ▼ 36.23 | 47,093,322 |
| ▼ USO | ▲ ▼ ▼ | 2026-11-17 | ▲ +0.15% | ▼ -1.64% | 142.58 | 142.74 | 139.56 | 140.24 | ▼ 141.15 | 2,980,458 |
| AVG/Sum | — | — | -0.38% | -0.81% | — | — | — | — | — | 91,152,174 |
Cross-Market ETFs
Negative confluence: average DOC% -0.81% from the open and DNC% -0.39% versus the prior close. Bonds alone rose from the open, diverging from equities; oil lagged intraday despite finishing slightly above the prior close, while bitcoin had the largest prior-close loss. Gold slipped within aligned downtrends.
TLT · D:2026-11-17 NC% ▲ +0.21% OC% ▲ +0.32%
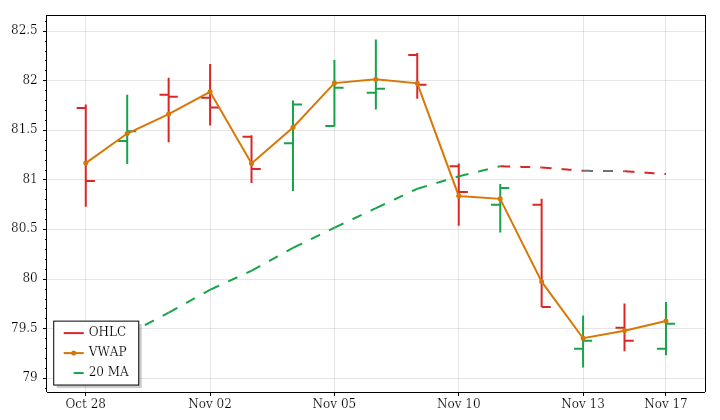
TLT – Long-Term Treasury Bonds Technicals Summary
TLT's completed November 17 daily session advanced to 79.55, gaining 0.21% versus the prior close and 0.32% from the open. Price recovered its opening gap down and formed an outside bar, but the close remained inside the previous day's range. It also finished slightly below session VWAP, limiting the strength suggested by the positive daily return.
The gain ran against falling near- and far-term averages above price. The intermediate-term average was rising, but price remained below it, leaving that horizon mixed rather than bullish. The prior fifteen sessions showed a downward price trend, so the latest advance did not establish a broader change. Range was below average, matching lookback contraction; slightly below-average volume contrasted with an increasing volume trend. Both trend indicators remained bearish, and only a next-session high above 80.7141 would trigger PSAR's bullish reversal.
GLD · D:2026-11-17 NC% ▼ -0.13% OC% ▼ -0.39%
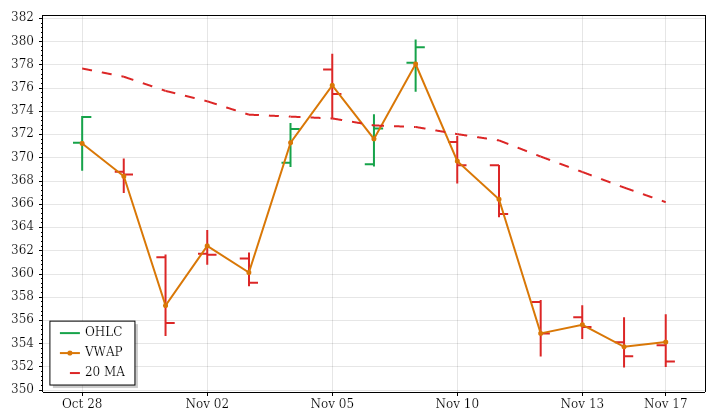
GLD – Gold Technicals Summary
GLD's completed November 17 daily session closed at 352.48, down 0.13% from the prior close and 0.39% from the open. The opening gain was erased, and price finished near the session low and below VWAP. Although the day produced a higher high and higher low, the close stayed inside the previous day's range, so that upward shift in the daily extremes did not translate into a positive finish.
Near-, intermediate- and far-term averages were all falling above price, aligning the session's weakness with the broader downward structure. The close was only 0.15% above the supplied annual low. Range was slightly above average despite lookback contraction, while below-average volume contrasted with increasing volume over the prior fifteen sessions. PSAR and ATR-median remained bearish; a next-session high above 374.9223 would be required for a PSAR bullish reversal.
Gold News and Fundamentals
Gold traded around 14-month lows on November 17, with dollar strength and expectations of higher interest rates weighing on prices. U.S. October retail sales rose 0.2%, matching expectations and slowing from September’s 0.8% increase. Separately, the World Gold Council reported healthy Indian festive-period demand as lower October prices supported jewelry purchases. Indian gold ETFs recorded a fifth consecutive month of net inflows, while imports rebounded from September’s lows.
IBIT · D:2026-11-17 NC% ▼ -1.77% OC% ▼ -1.51%
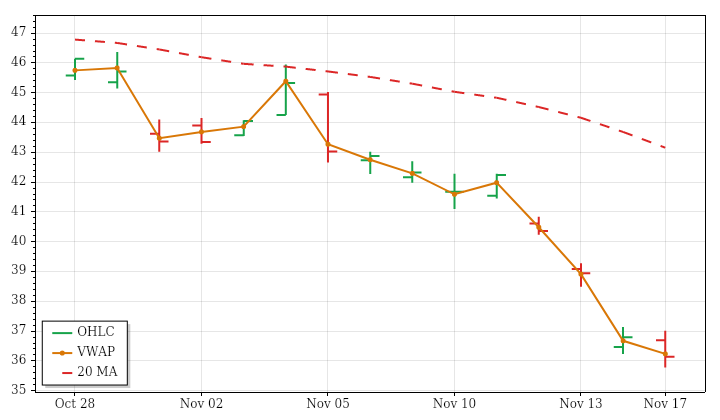
IBIT – Bitcoin Technicals Summary
IBIT's completed November 17 daily session fell to 36.14, losing 1.77% from the prior close and 1.51% from the open. Price filled its opening gap down but subsequently finished below the previous day's low. A lower high and lower low, together with a close below session VWAP, kept the day's technical story firmly negative despite trading on both sides of the open.
Near- and intermediate-term averages were falling above price, matching the sustained downward price trend over the prior fifteen sessions. The far-term average was still edging higher, but price stood below it, leaving that horizon mixed rather than aligned with the shorter-term decline. The day's above-average range contrasted with lookback contraction, while volume was approximately average despite a rising volume trend. Both trend indicators remained bearish; a PSAR bullish reversal would require a next-session high above 39.78.
USO · D:2026-11-17 NC% ▲ +0.15% OC% ▼ -1.64%
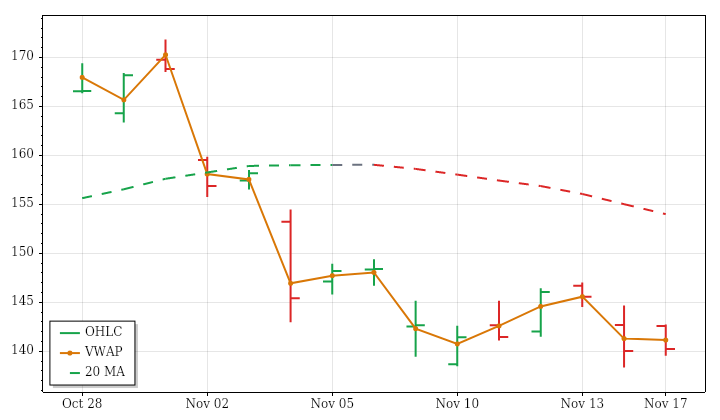
USO – Oil Technicals Summary
USO's completed November 17 daily session closed at 140.24, up 0.15% versus the prior close but down 1.64% from the open. The opening gap up was fully erased, leaving a small daily gain despite substantial intraday deterioration. An inside bar ended near its low and below session VWAP, keeping the latest price action weaker than the prior-close return alone suggests.
The near-term average was falling above price, while the intermediate-term average still rose slightly above it, producing mixed intermediate positioning. Price remained above a rising far-term average, so shorter-term weakness continued within a longer-term uptrend. The prior fifteen sessions showed a pronounced downward price trend with expanding ranges and declining volume. The latest range and volume were both below average. PSAR and ATR-median remained bearish; a next-session high above 145.288 would conditionally trigger a PSAR bullish reversal.
Oil News and Fundamentals
Oil edged lower as rising U.S. crude inventories and prospects of a global supply surplus outweighed Middle East security concerns. Recovering Middle Eastern exports added to supply pressure. Tanker-attack risks offered some support earlier in the day, but rising supply and the International Energy Agency’s surplus forecast limited gains.
Glossary: Instrument — ticker symbol; hover for the instrument or company name; Date — session date. DNC% — prior-session close to this session’s close; DOC% — daily session open-to-close percentage change. O — open; H — high; L — low; C — close, all for the table’s daily or weekly session; VWAP — volume-weighted average price; its arrow shows whether the close is above or below VWAP. Vol — period trading volume.
Bias — three directional readings, in order: DNC%, DOC%, then VWAP. ▲ positive/above; ▼ negative/below; — neutral or unavailable. Matching arrows show alignment; opposing arrows show mixed conditions. AVG/Sum — simple average of percentage changes and sum of reported volumes.
Futures Session Fib Grid Analysis – Snapshot
Session Fib Grids normalise market positioning as percentages, making direction and alignment comparable across different asset types.
Latest available snapshot for each instrument; Time(CT) shows the individual update date and time.
| Instrument | Bias | Time(CT) | YSFG | MSFG | WSFG | RSFG | SFG | TSI |
|---|---|---|---|---|---|---|---|---|
| ▼ ES | ▲ ▼ ▼ ▼ ▲ ▼ | 2026-11-18 07:18:23 | ▲ +21 | ▼ -88 | ▼ -70 | ▼ -3 | ▲ +2 | ▼ -237 |
| ▼ NQ | ▲ ▼ ▼ ▼ ▲ ▼ | 2026-11-18 07:18:21 | ▲ +13 | ▼ -56 | ▼ -43 | ▼ -2 | ▲ +1 | ▼ -63 |
| ▼ YM | ▲ ▼ ▼ ▼ ▲ ▼ | 2026-11-18 07:18:18 | ▲ +10 | ▼ -56 | ▼ -90 | ▼ -68 | ▲ +4 | ▼ -57 |
| ▼ EMD | ▲ ▼ ▼ ▼ ▲ ▼ | 2026-11-18 07:14:00 | ▲ +18 | ▼ -55 | ▼ -89 | ▼ -76 | ▲ +11 | ▼ -344 |
| ▼ RTY | ▲ ▼ ▼ ▼ ▲ ▼ | 2026-11-18 07:18:16 | ▲ +16 | ▼ -87 | ▼ -86 | ▼ -11 | ▲ +10 | ▼ -131 |
| ▼ FDAX | ▲ ▲ ▼ ▼ ▼ ▼ | 2026-11-18 07:18:21 | ▲ +28 | ▲ +5 | ▼ -86 | ▼ -28 | ▼ -3 | ▼ -104 |
| ▼ NKD | ▲ ▼ ▼ ▼ ▲ ▼ | 2026-11-18 07:18:16 | ▲ +101 | ▼ -46 | ▼ -42 | ▼ -6 | ▲ +1 | ▼ -21 |
| Instrument | Bias | Time(CT) | YSFG | MSFG | WSFG | RSFG | SFG | TSI |
|---|---|---|---|---|---|---|---|---|
| ▼ BTC | ▼ ▼ ▼ ▼ ▼ ▼ | 2026-11-18 07:17:31 | ▼ -96 | ▼ -97 | ▼ -11 | ▼ -47 | ▼ -3 | ▼ -120 |
| ▲ GC | ▼ ▼ ▼ ▲ ▲ ▼ | 2026-11-18 07:18:24 | ▼ -194 | ▼ -29 | ▼ -40 | ▲ +15 | ▲ +35 | ▼ -248 |
| ▼ CL | ▲ ▼ ▼ ▼ ▼ ▼ | 2026-11-18 07:18:23 | ▲ +141 | ▼ -99 | ▼ -38 | ▼ -53 | ▼ -9 | ▼ -16 |
| ▼ 6E | ▼ ▼ ▼ ▼ ▲ ▲ | 2026-11-18 07:18:20 | ▼ -76 | ▼ -79 | ▼ -40 | ▼ -32 | ▲ +11 | ▲ +17 |
| ▲ ZB | ▼ ▼ ▲ ▲ ▲ ▼ | 2026-11-18 07:16:48 | ▼ -41 | ▼ -42 | ▲ +13 | ▲ +20 | ▲ +10 | ▼ -16 |
Glossary: YSFG — yearly; MSFG — monthly; WSFG — weekly; RSFG — regular trading hours (RTH); SFG — the current session, including pre-market or other sessions. TSI indicates trend strength and power.
Bias shows trend alignment across these six readings. The arrows follow the column order: YSFG, MSFG, WSFG, RSFG, SFG and TSI. Matching arrows show alignment; opposing arrows show mixed conditions.
Futures Higher Time Frame Analysis
Summary of the current state of US Indices Futures based on higher time-frame (HTF) technical analysis as of: 2026-11-18 07:15 -06:00 CT.
US Indices Futures
- ES YSFG bullish, MSFG/WSFG bearish, below all daily benchmarks, rising weekly long-term benchmarks, evolving support 7308.00, weekly reversal threshold 7583.25, resistance 7674.75.
- NQ YSFG bullish, MSFG/WSFG bearish, below all daily benchmarks, rising weekly long-term benchmarks, support 26366.50, daily reversal threshold 27034.50, resistance 28697.00.
- YM YSFG bullish, MSFG/WSFG bearish, below all daily benchmarks, testing rising 55-week benchmark, support 50628–50568, daily reversal threshold 52442, resistance 52850.
- EMD YSFG bullish, MSFG/WSFG bearish, below all daily and 55-week benchmarks, evolving daily pivot 3577.8, support 3560.7/3332.6, resistance 3750.3, weekly reversal threshold 3773.1.
- RTY YSFG bullish, MSFG/WSFG bearish, below all daily benchmarks and 55-week benchmark, support 2694.4–2696.4, daily reversal threshold 2817.2, resistance 2862.2/2888.7.
- FDAX YSFG/MSFG bullish, WSFG bearish, above all weekly benchmarks and daily 55/100/200 benchmarks, evolving support 26032, lower support 25943–25887/25695, resistance 27084.
Overall State
- Short-Term: Bearish
- Intermediate-Term: Bearish
- Long-Term: Bullish
Conclusion
ES, NQ, YM, EMD and RTY show correlated bearish WSFG/MSFG readings, recent short signals and price below all daily MA benchmarks. Their lower swing structures and tests of pivot support contrast with bullish YSFG readings and rising 100- and 200-week benchmarks. Long-term bullish classification reflects weekly structure; daily far-term ratings remain bearish across these five contracts. FDAX shows relative structural strength, retaining bullish monthly and yearly grids and price above all weekly benchmarks despite its bearish weekly grid and recent short signals. No confirmed broad recovery is established.
Note: Intra-day counter-trend pullbacks or retracements may occur, HTF is context for informational usage and market structure. Glossary: Session Fib Grids periods of YSFG:’Yearly’, MSFG:’Monthly’, WSFG:’Weekly’
For full details visit: AlphaWebTrader Technicals
SPY Daily View
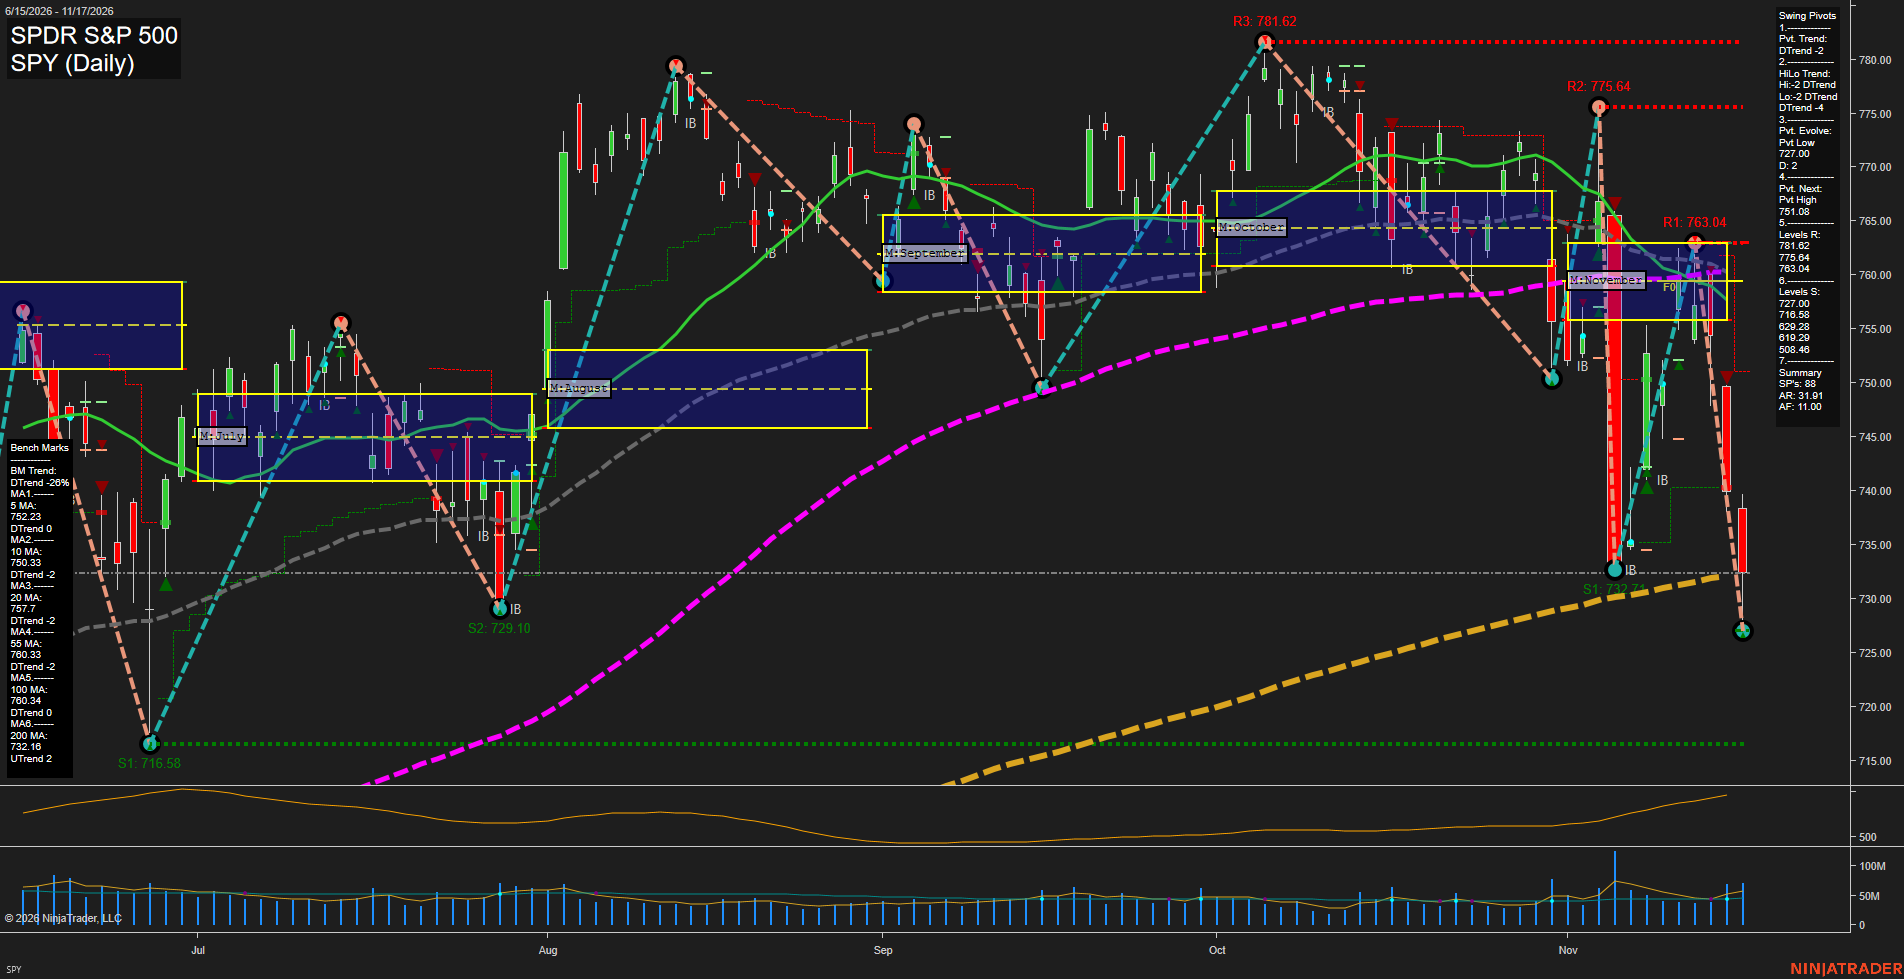
Overall Rating
- Near-Term: Bearish
- Medium-Term: Bearish
- Far-Term: Neutral.
Key Insights Summary
From a futures swing trader’s perspective, SPY shows an accelerating bearish downswing rather than an orderly pullback. The rebound toward 763.04 failed below the preceding 775.64 and 781.62 highs, reinforcing the lower-high structure. The subsequent decline broke the earlier November low near 732.71 and established an evolving low at 727.00. Large downside candles, rising ATR, and increased recent volume indicate expanding volatility. Price is below the November monthly balance zone and the 5-, 10-, 20-, 55-, and 100-day benchmarks, supporting bearish near- and medium-term ratings. The approximately 732.50 close sits near the rising 200-day benchmark at 732.16, leaving the major trend at a significant technical test rather than confirming a long-term downtrend. Weekly and yearly grids are not visible; their neutral entries indicate unavailable confirmation. The named TR120, WSFG, MSFG, and TR720 signal readings cannot be verified from this image. These are SPY reference levels, not directly transferable futures contract prices; no news or seasonal catalyst is established by the chart.
View charts on: AlphaWebTrader HTF Charts
ES Daily View
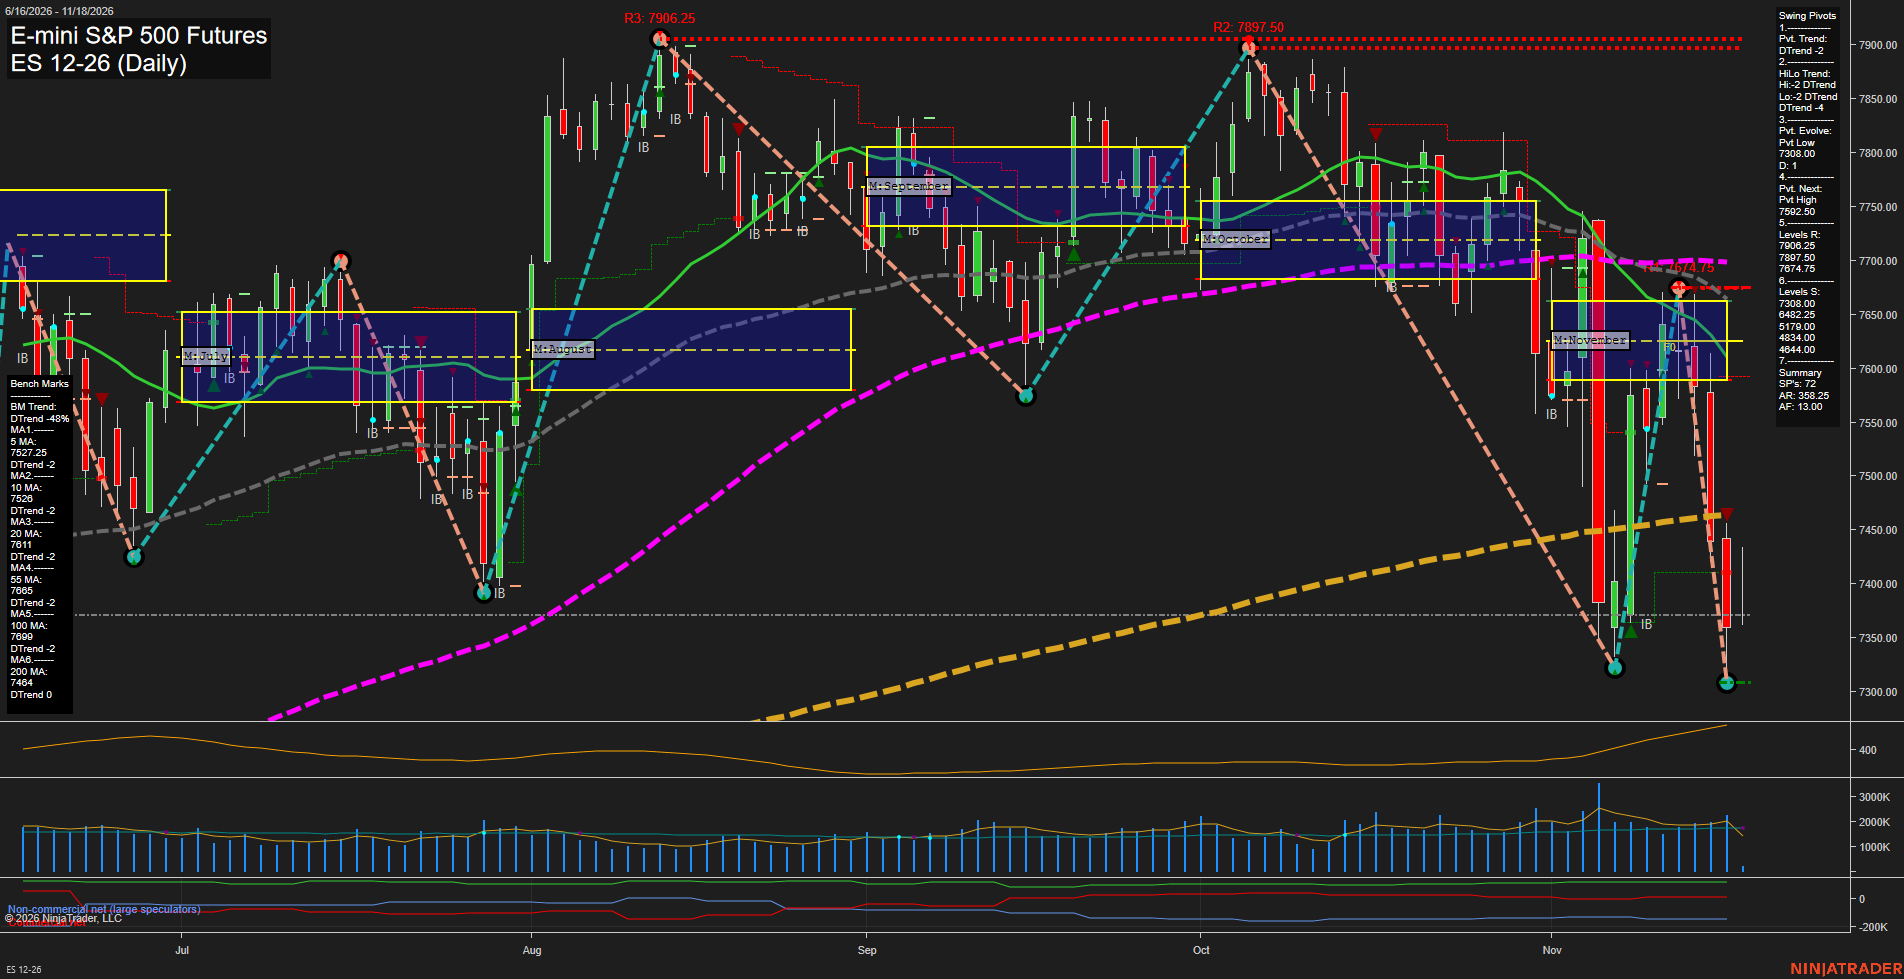
Overall Rating
- Near-Term: Bearish
- Medium-Term: Bearish
- Far-Term: Bearish.
Key Insights Summary
The swing structure remains bearish, with lower highs and lower lows confirming the weekly and monthly downside biases. The rebound to 7674.75 failed, followed by a rapid decline to the evolving 7308.00 pivot low. Price is now below all six benchmarks, including the 200-day average, while the latest small-bodied bar suggests a pause rather than a confirmed reversal. Large recent ranges and elevated ATR characterize a volatile selloff. The 7592.50 next-pivot threshold is distinct from established resistance at 7674.75. Far-term evidence is predominantly bearish, although the positive yearly grid reading shows that the broader annual advance has not been fully erased. The supplied chart does not establish a news catalyst or seasonal explanation.
View charts on: AlphaWebTrader HTF Charts
QQQ Daily View
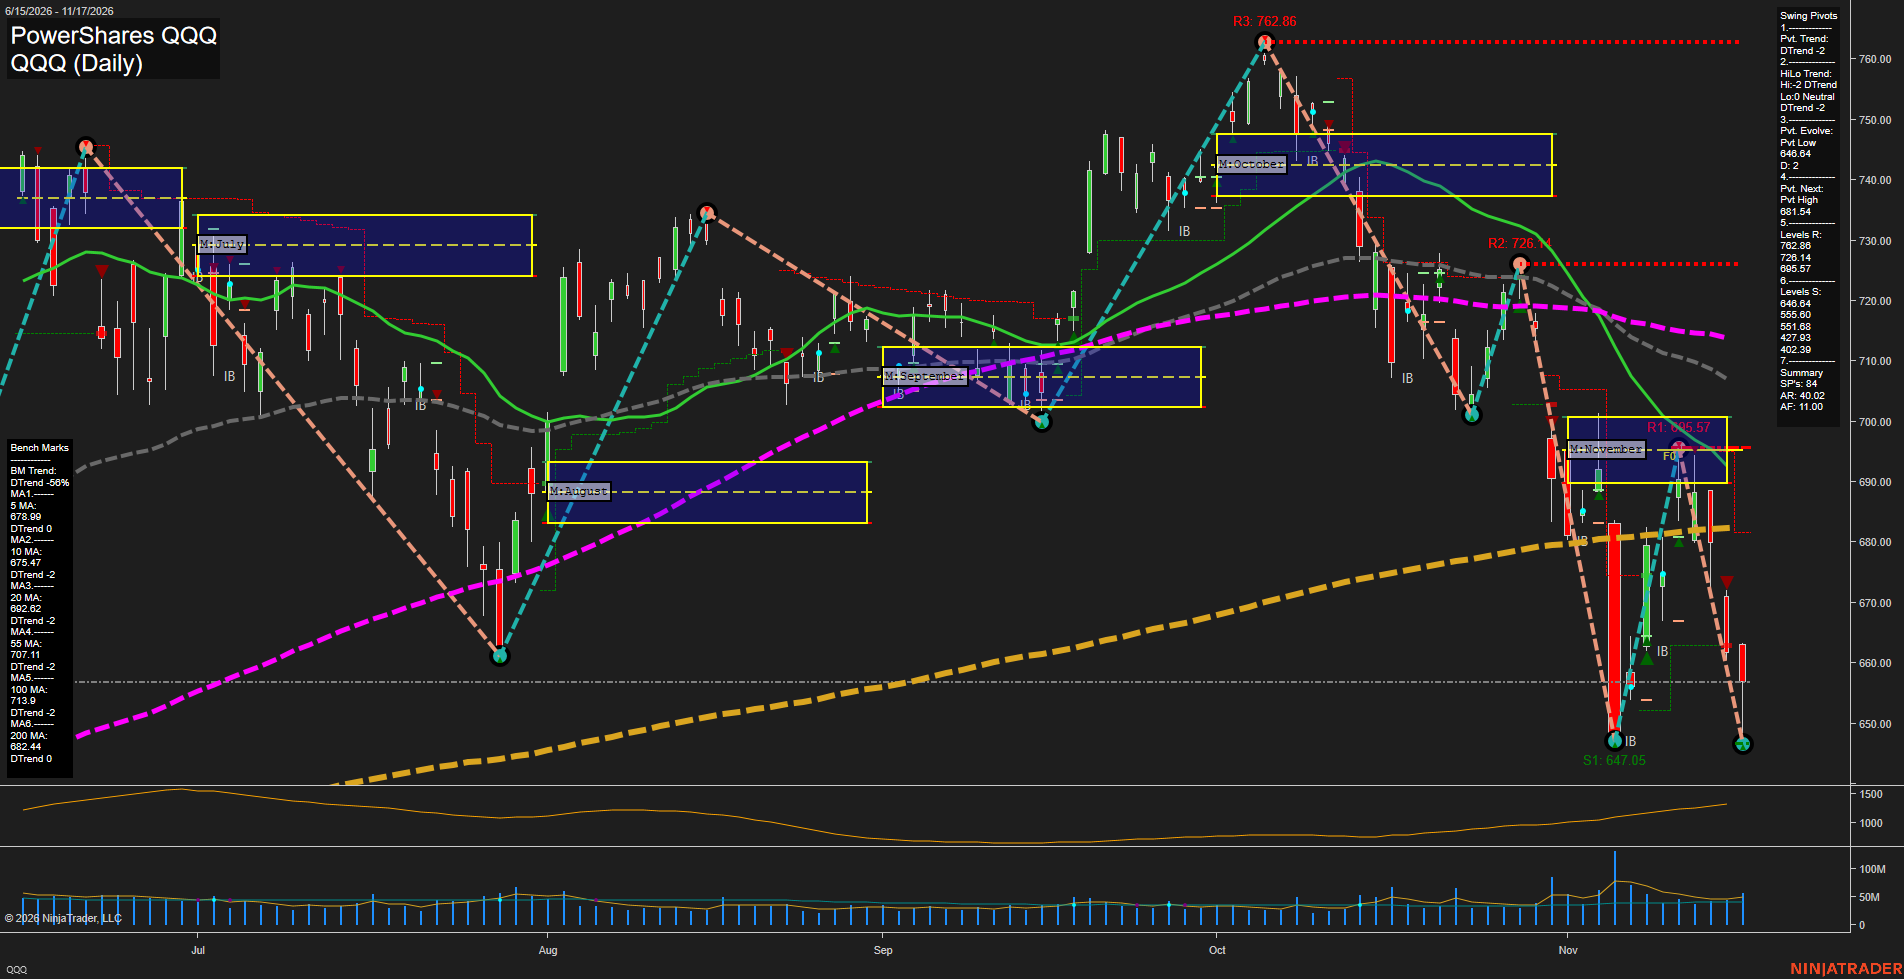
Overall Rating
- Near-Term: Bearish
- Medium-Term: Bearish
- Far-Term: Bearish.
Key Insights Summary
From a futures swing trader’s perspective, QQQ reflects bearish Nasdaq exposure across multiple time horizons; these are ETF levels, not futures contract prices. The rebound from approximately 647 to 695.57 failed near November’s monthly grid, followed by a fast decline that marginally undercut the prior swing low. Price remains beneath all six benchmarks and below the monthly neutral zone near 690–701, reinforcing the lower-high structure and bearish trend continuation. The evolving 646.64 low is the immediate structural reference; 681.54 is the summary’s next opposite-pivot reversal threshold, not a confirmed swing high. The 200-day average is still visually rising despite its summary downside classification, distinguishing deteriorating price positioning from the longer-term average’s slope. Weekly and yearly grids and named strategy signals are not visible, so their direction cannot be independently confirmed; neutral grid entries indicate unavailable evidence. News and seasonal explanations are not established by this chart.
View charts on: AlphaWebTrader HTF Charts
NQ Daily View
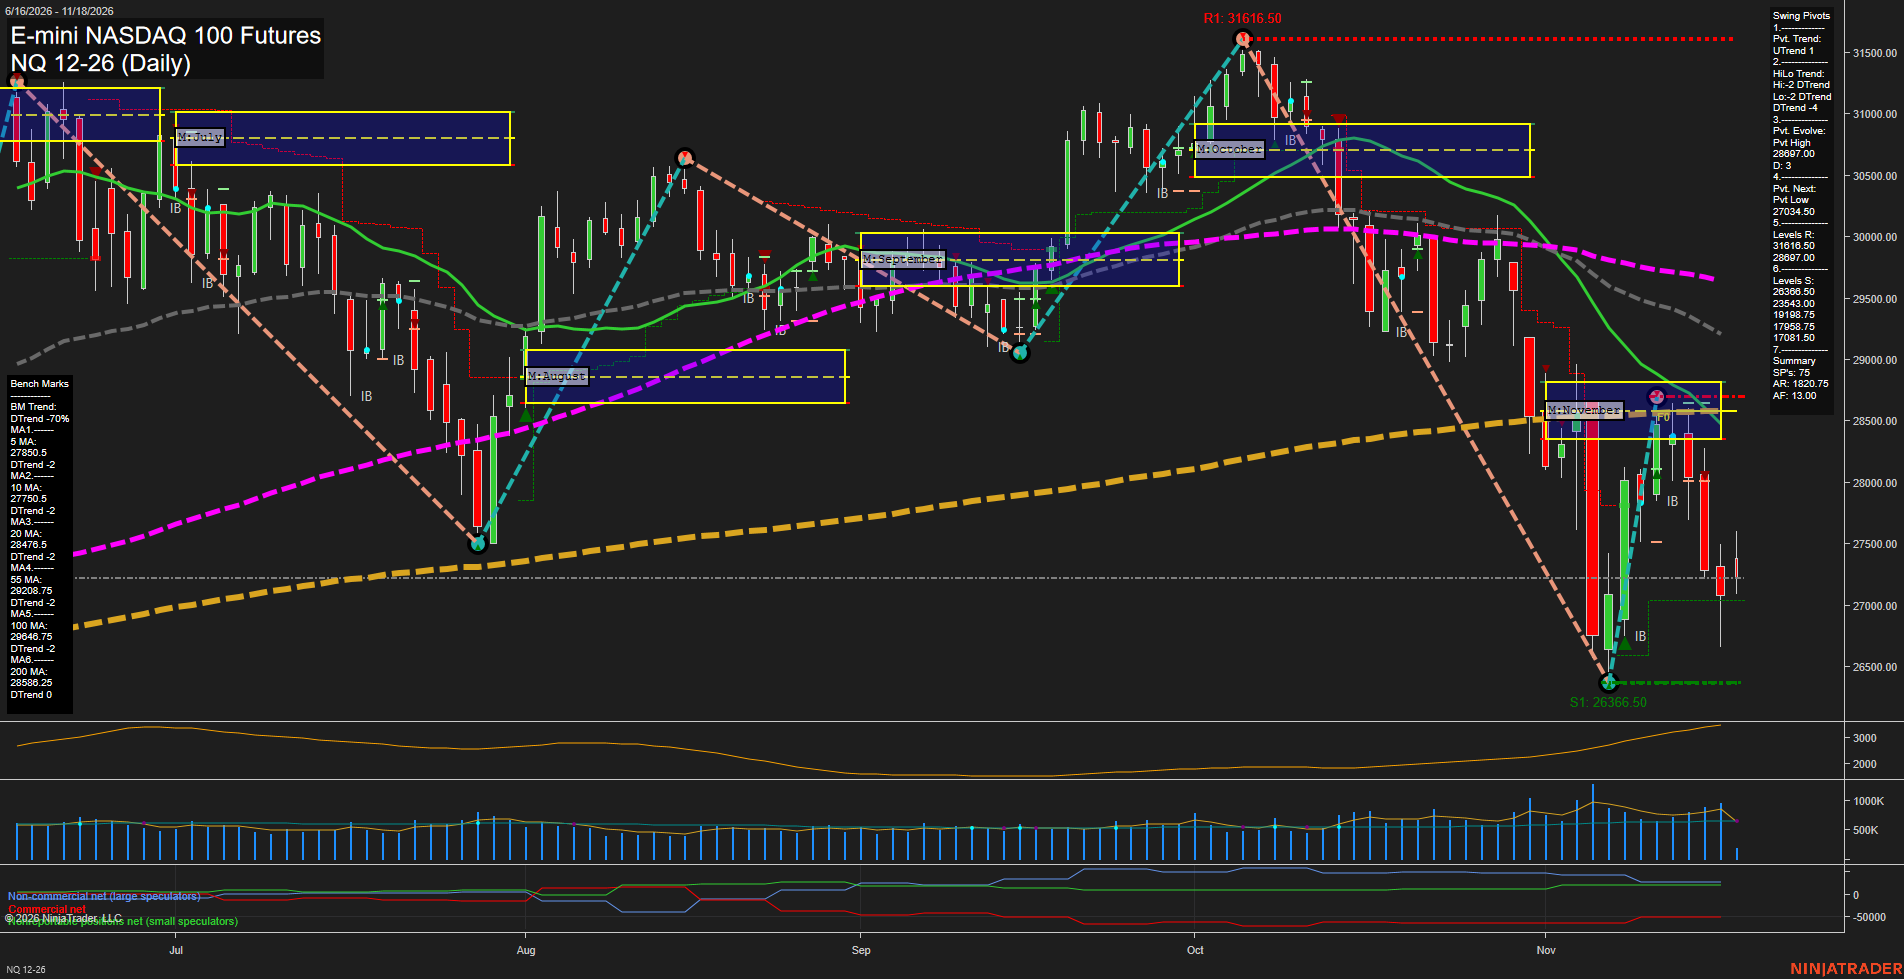
Overall Rating
- Near-Term: Bearish
- Medium-Term: Bearish
- Far-Term: Bearish.
Key Insights Summary
The swing structure favors bearish continuation following the sharp October–November selloff. The rebound from 26366.50 reached 28697.00 but failed around the November NTZ and 200-day benchmark, forming a lower high beneath October resistance. Renewed selling has returned price below all six daily benchmarks and both weekly and monthly value zones. The summary still records a near-term pivot UTrend, but this conflicts with predominantly bearish momentum and benchmark readings; 27034.50 is the listed next-pivot reversal threshold. The 26366.50 swing low remains the nearest confirmed support. Large daily ranges and elevated volatility characterize an unstable countertrend rebound rather than an established recovery. Far-term evidence is mixed because the annual grid remains positive, although both long-horizon benchmarks slope down with price below them. No news catalyst or seasonal conclusion can be established from this chart alone.
View charts on: AlphaWebTrader HTF Charts
USO Daily View
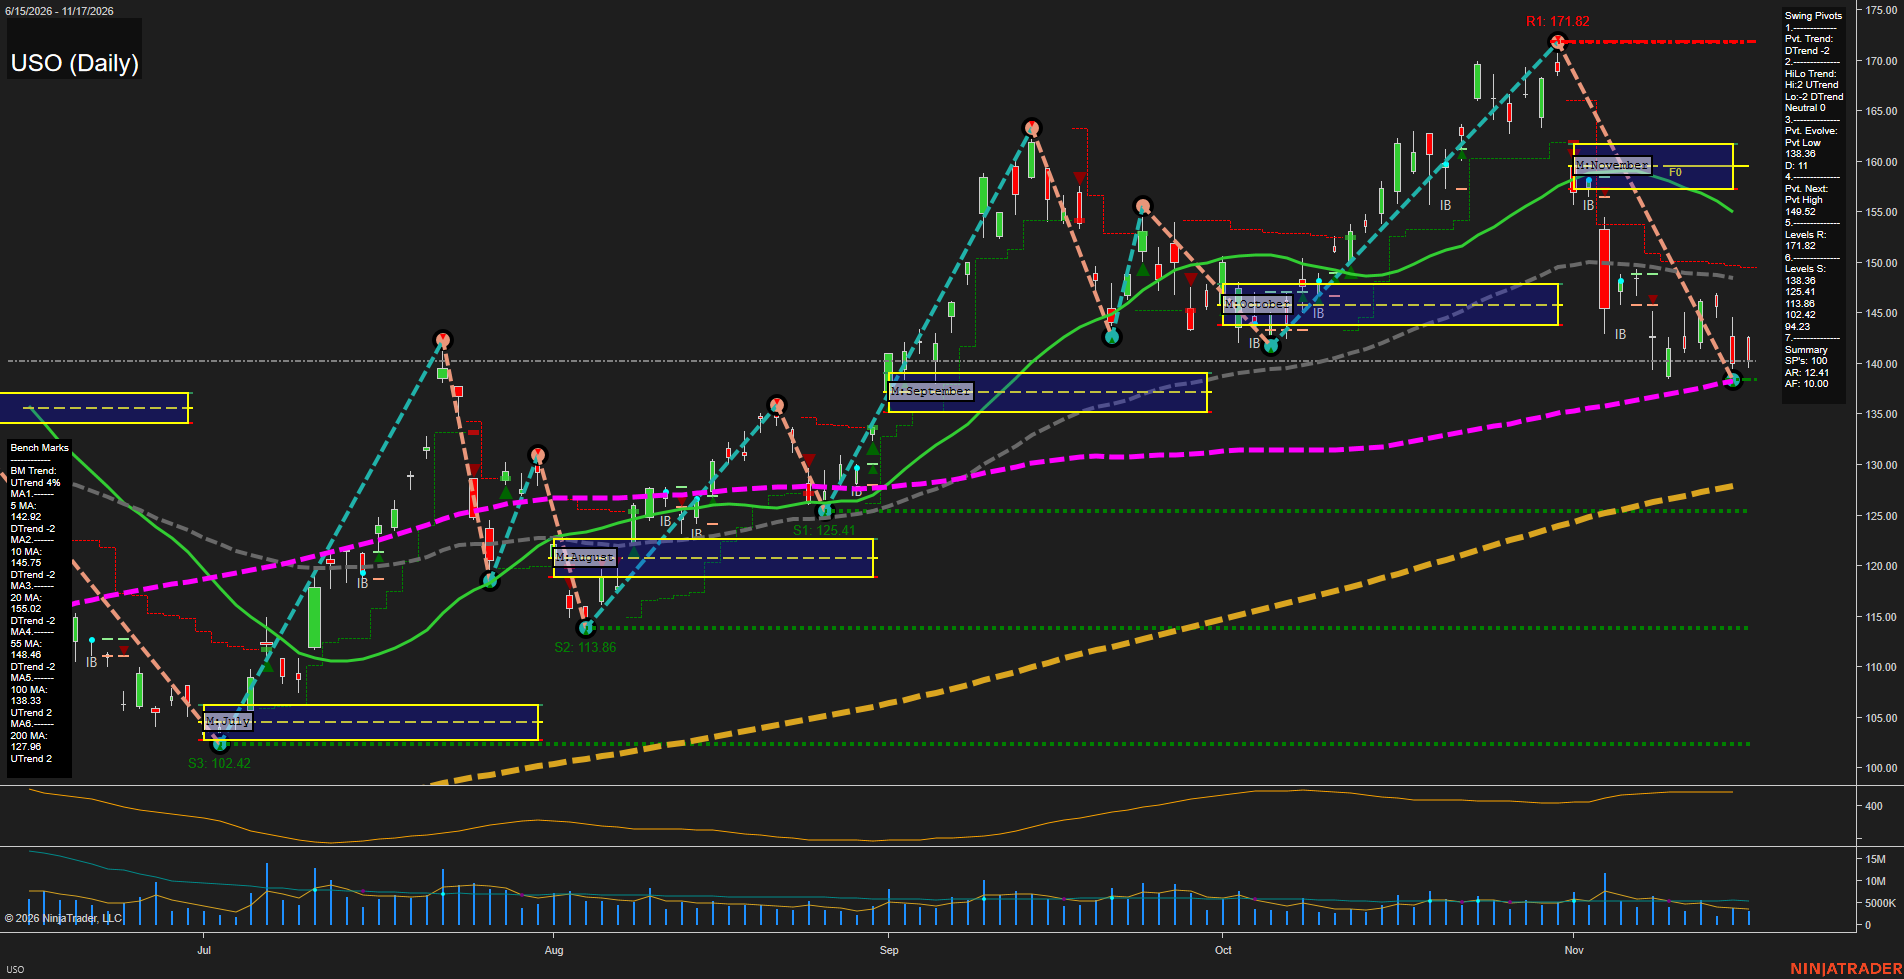
Overall Rating
- Near-Term: Bearish
- Medium-Term: Bearish
- Far-Term: Bullish.
Key Insights Summary
From a futures swing trader’s perspective, USO shows a sharp corrective downswing within a still-rising longer-term structure. The decline from 171.82 has reached a notable confluence of evolving pivot support at 138.36 and the rising 100-day benchmark at 138.33. Price remains below all four shorter benchmarks and November’s roughly 157–162 neutral zone, reinforcing bearish near- and medium-term conditions. Recent candles indicate hesitation near support rather than a confirmed reversal; the summary identifies 149.52 as the next opposite-pivot reversal threshold. The mixed higher-high/lower-low pivot structure explains the neutral medium-term HiLo reading despite the bearish current swing. Weekly and yearly grids and named signal-series readings are not visible, so their directional signals cannot be verified. USO is an oil-futures-linked fund rather than a futures contract; contract roll and fund mechanics can affect its relationship to crude futures. No news or seasonal catalyst is established by this chart alone.
View charts on: AlphaWebTrader HTF Charts
CL Daily View
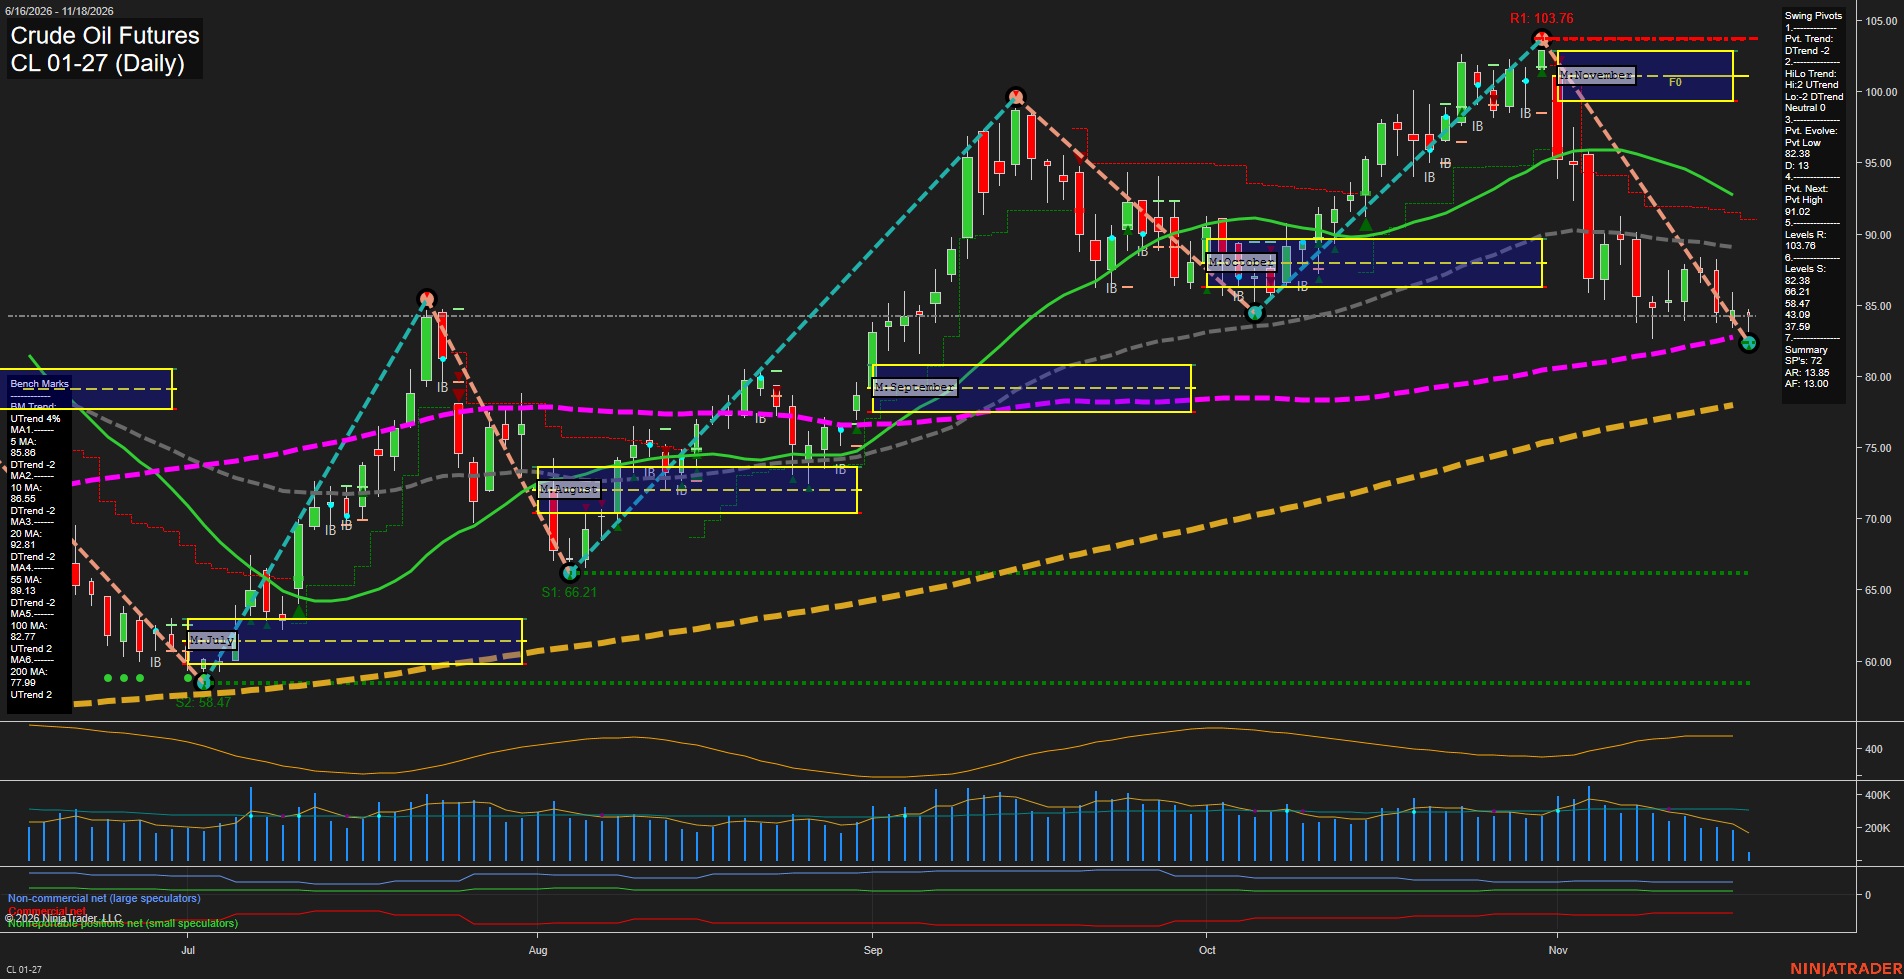
Overall Rating
- Near-Term: Bearish
- Medium-Term: Bearish
- Far-Term: Bullish.
Key Insights Summary
From a futures swing perspective, November's decline from 103.76 represents a sharp corrective downswing within a still-rising longer-term trend. Price remains below the falling 5-, 10-, 20- and 55-day benchmarks, while negative weekly and monthly grids reinforce bearish near- and medium-term conditions. Recent smaller candles indicate slowing immediate momentum rather than a confirmed reversal. The developing 82.38 pivot low and rising 100-day benchmark at 82.77 form a nearby support cluster; the next opposite-pivot threshold is 91.02. Mixed high/low pivot structure leaves the medium-term swing classification neutral despite bearish moving-average alignment. Rising 100- and 200-day benchmarks support the bullish far-term rating. The supplied short signals reference December futures, whereas this chart displays January futures, so their execution prices are not directly comparable. News and seasonal drivers cannot be established from the chart alone.
View charts on: AlphaWebTrader HTF Charts
GLD Daily View
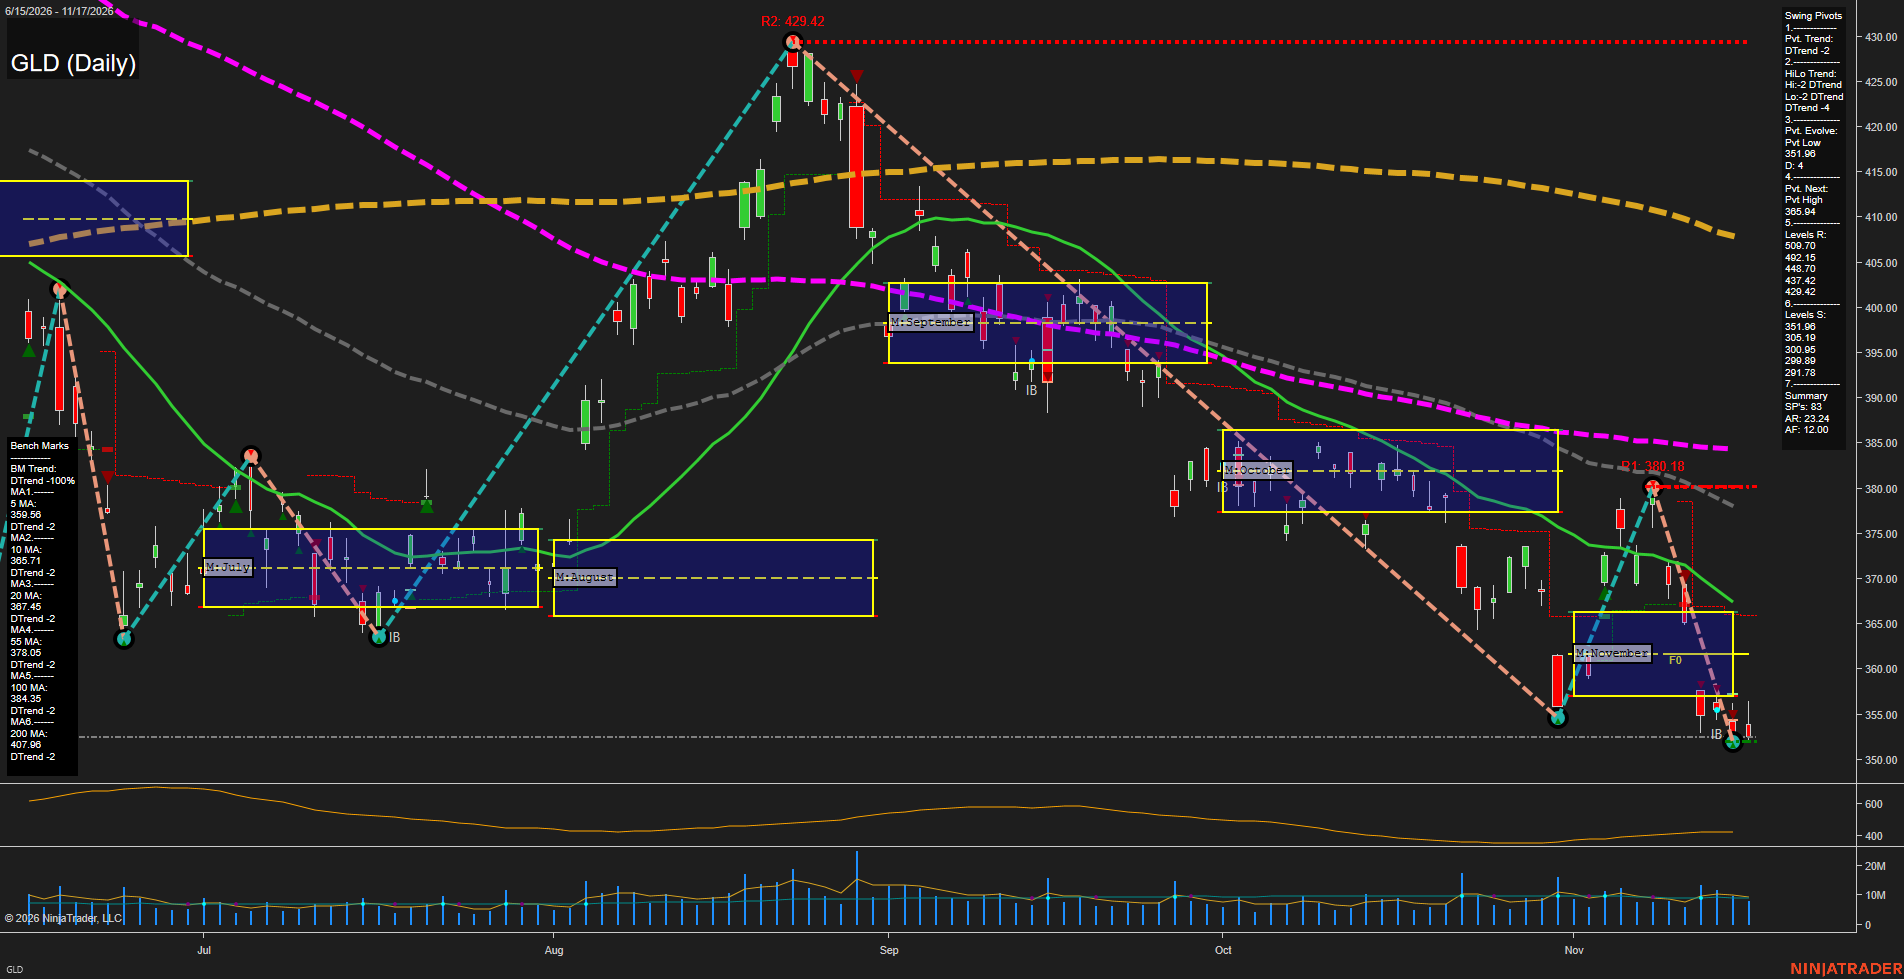
Overall Rating
- Near-Term: Bearish
- Medium-Term: Bearish
- Far-Term: Bearish.
Key Insights Summary
From a futures swing trader’s perspective, GLD shows aligned bearish structure across all three horizons. The rebound from approximately 355 to 380.18 failed, followed by a renewed decline to an evolving 351.96 pivot low. Price beneath every benchmark, with all six averages declining, characterizes the rebound as countertrend rather than a confirmed reversal. November’s breakdown beneath its approximately 357–366 neutral zone reinforces downside continuation; its center near 362 now sits overhead. Recent small candles near the lows show slowing bar expansion, but do not establish a reversal. The next opposite-pivot threshold is 365.94. The summary’s resistance list contains distant historical levels; the visible 380.18 pivot provides nearer overhead context. Weekly and yearly grids and named USAR signal readings are unavailable, so their neutral entries are placeholders rather than confirmed neutral conditions. GLD is an ETF proxy, not a gold futures contract; these prices are not futures levels. No news or seasonal catalyst is established by this chart.
View charts on: AlphaWebTrader HTF Charts
GC Daily View
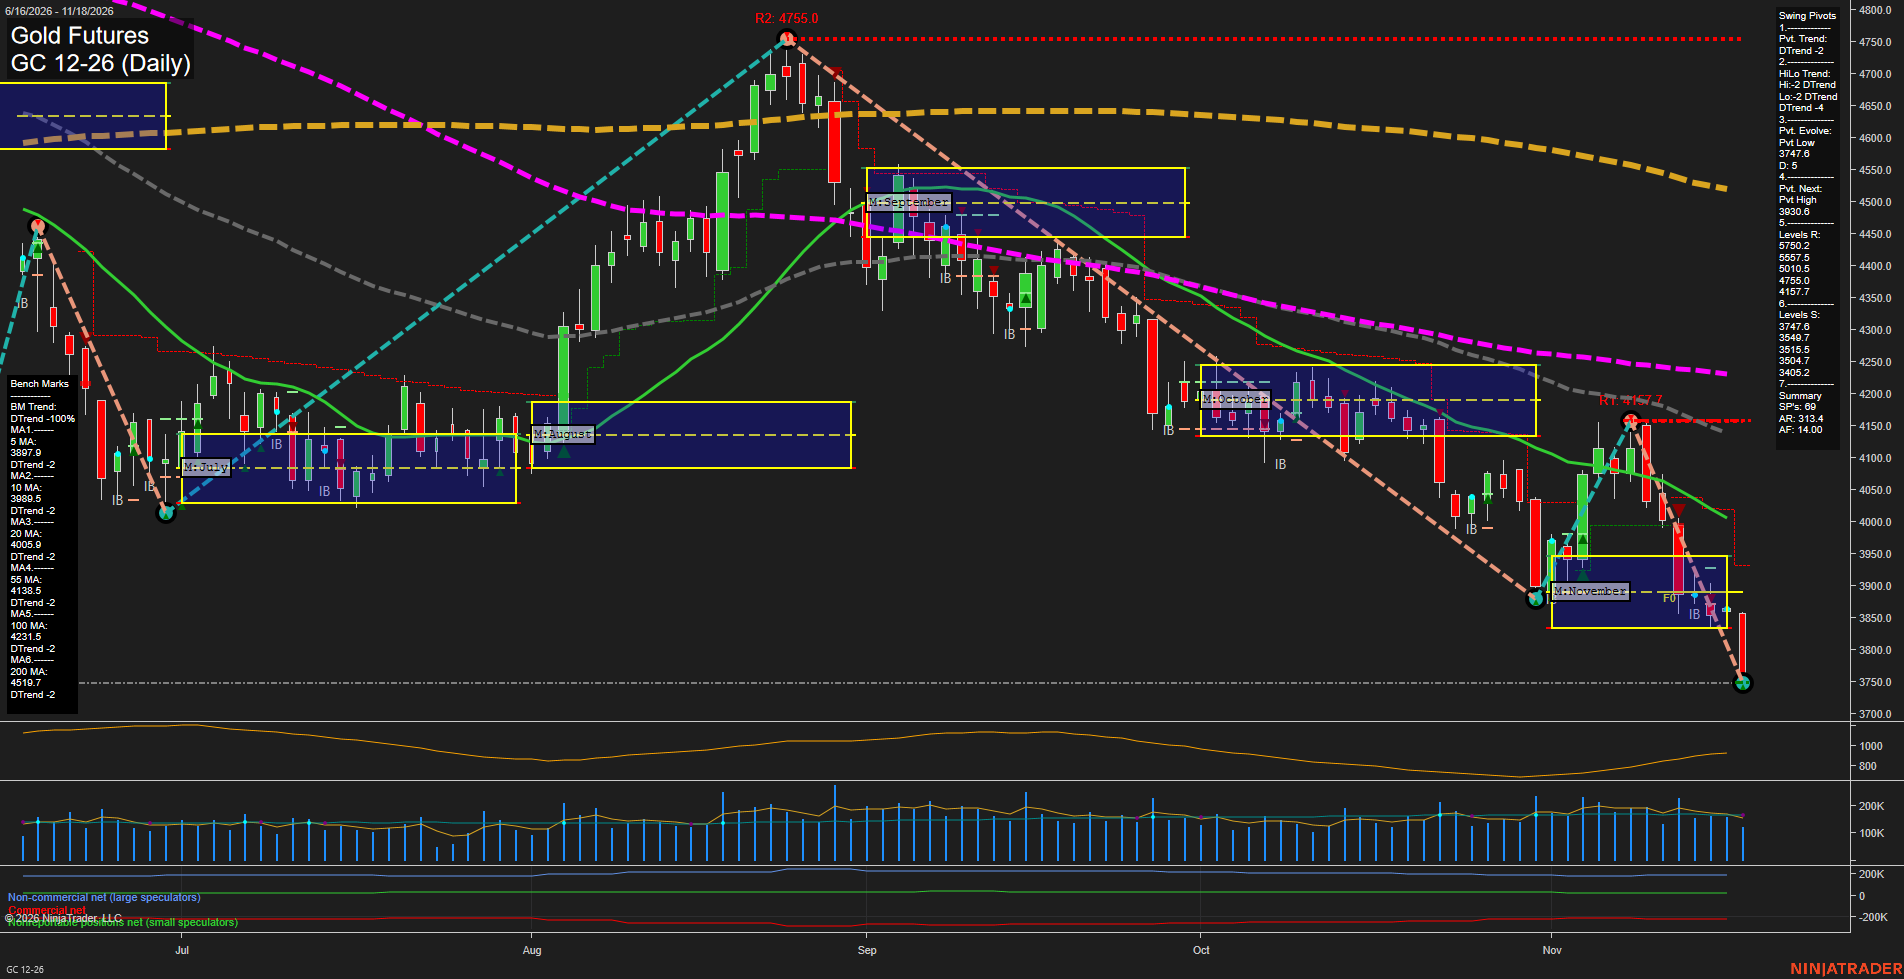
Overall Rating
- Near-Term: Bearish
- Medium-Term: Bearish
- Far-Term: Bearish.
Key Insights Summary
From a futures swing trader’s perspective, the chart shows bearish trend continuation rather than a confirmed reversal. The November rebound failed at 4157.7, establishing a lower high beneath the August peak of 4755.0. Renewed selling has broken below November’s monthly neutral zone and the previous swing low, extending the evolving pivot low to 3747.6. Large bearish bars and expanding recent ranges indicate accelerating downside momentum. Price is below all six declining benchmarks, while weekly, monthly and yearly grid readings and the supplied short signals reinforce the bearish alignment across time horizons. The current low coincides with listed support at 3747.6; subsequent listed supports begin at 3549.7. The next opposite-pivot threshold is 3930.6, distinct from a confirmed broader trend reversal. News catalysts and seasonal effects cannot be established from this chart alone.
View charts on: AlphaWebTrader HTF Charts
ZB Daily View
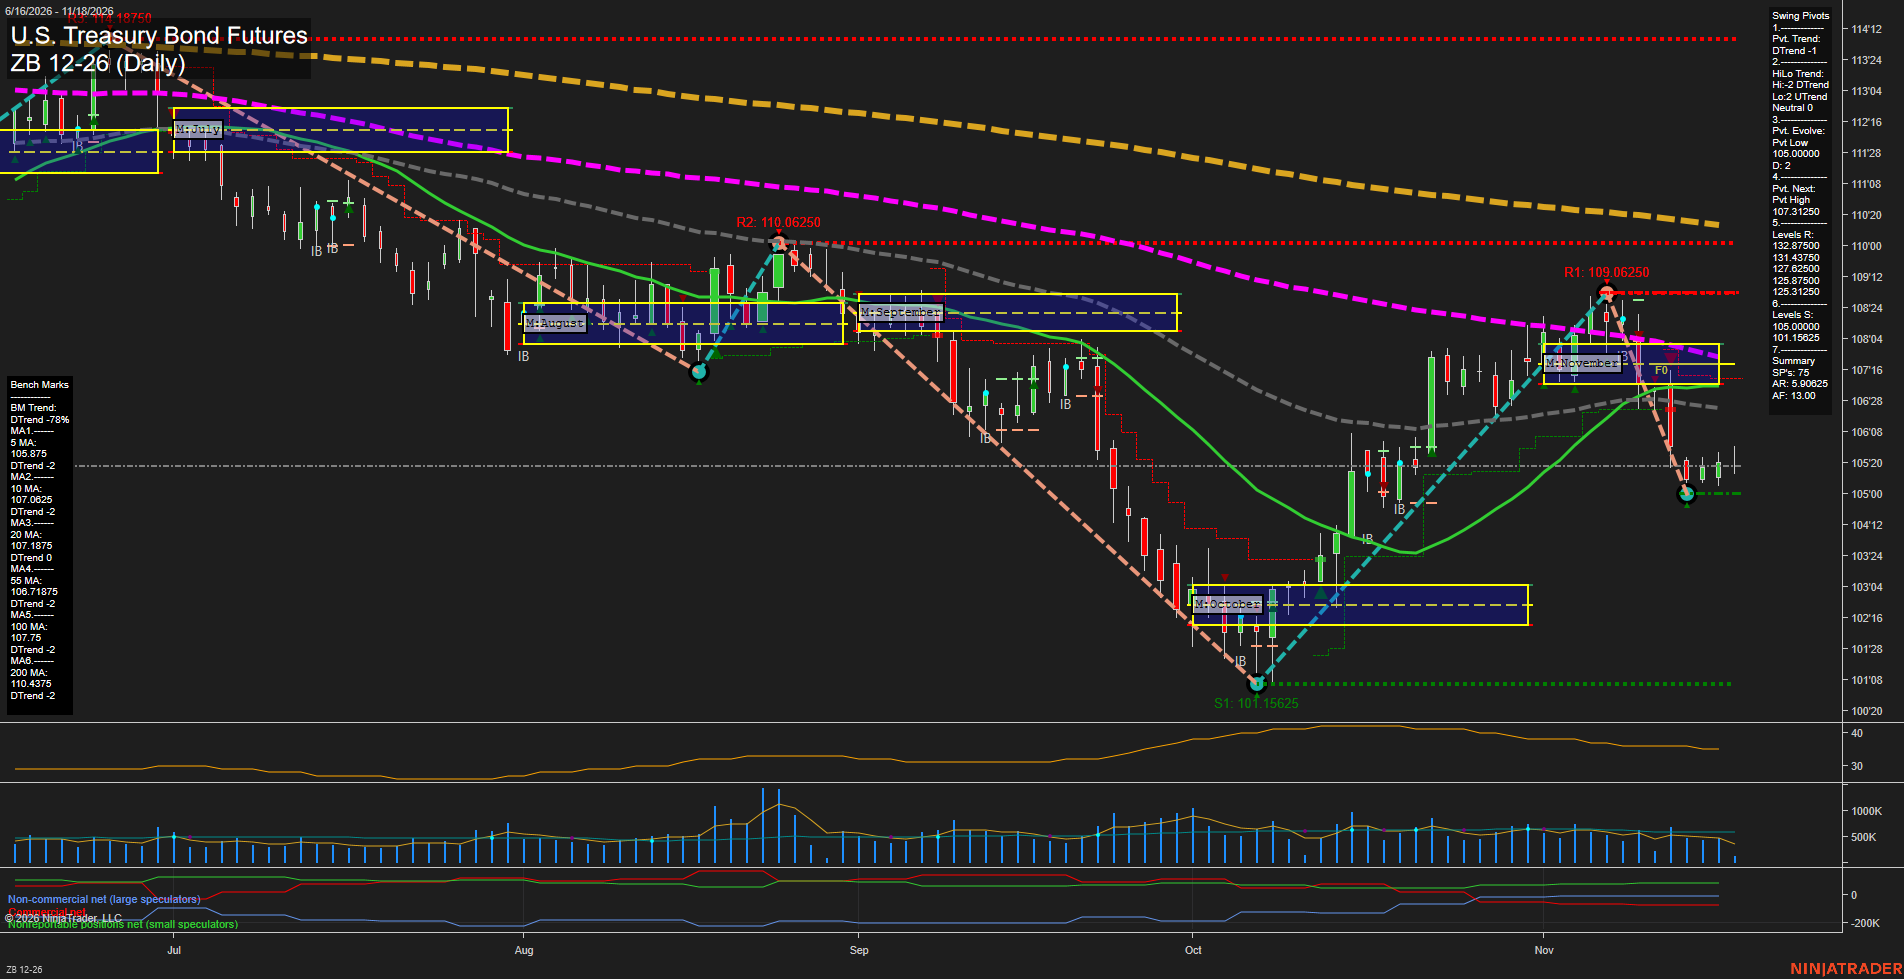
Overall Rating
- Near-Term: Bearish
- Medium-Term: Bearish
- Far-Term: Bearish.
Key Insights Summary
From a futures swing-trading perspective, small candles above the evolving 105.00000 pivot low indicate stabilization following the sharp reversal from November’s 109.06250 high, rather than a confirmed bullish reversal. Weekly grid strength is countertrend against declining monthly and yearly grids, a bearish near-term pivot trend, and price below all six benchmarks. The medium-term pivot structure is mixed, with lower highs but a higher low relative to October’s 101.15625 trough. The 106.71875–107.75 benchmark cluster represents substantial overhead resistance. Resistance values in the Swing Pivots summary are reproduced as displayed, although they differ from the visible chart annotations at 109.06250, 110.06250, and 114.18750. The four named trade-signal readings are not visible, and the chart alone does not establish news or seasonal drivers.
View charts on: AlphaWebTrader HTF Charts
Sentiment Summary: Coverage was predominantly neutral (43%), but negative reports (32%) exceeded positive ones (25%), reflecting Nvidia’s leadership uncertainty, reported SEC disclosure probe and tighter AI-chip export controls. November 17 coverage also highlighted slowing October retail sales, stronger-than-expected import inflation and hawkish Fed comments, alongside the S&P 500’s fourth consecutive decline. The main counterweight was Nvidia’s November 17 earnings beat and $130 billion quarterly revenue forecast, which supported higher Nasdaq futures and broad AI-related premarket gains on November 18.
Conclusion: The premarket rebound follows a technically weakened cash session, with the S&P 500 and Dow below their 200-day moving averages.