
Stocks closed higher as AI earnings lifted tech, though breadth stayed weak and Nasdaq futures remained corrective. Oil inventories fell; gold rebounded.
Fundamentals: Stocks closed higher as AI-related earnings revived technology demand, lifting the Nasdaq 1.05%. Weak market breadth, semiconductor support tests and concentrated AI spending tempered the gains. U.S. crude inventories fell 3.1 million barrels, far more than expected, while Gulf oil flows faced lingering supply risks. Gold rebounded as the dollar softened, although higher bond yields remained a headwind.
Technicals: Stocks and tech rose from their opens on October 21, with S&P 500 and Nasdaq-100 ETFs gaining 0.25% and 0.41%, respectively. Nasdaq futures remained corrective within a longer-term uptrend, while Dow futures showed a stronger daily recovery. The oil ETF rose 0.24% from its open but finished 0.50% below its prior close. Gold and long-term Treasury ETFs slipped from their opens but closed above their prior closes.
After Market Close daily snapshot: market news summary and sentiment, major ETFs, Magnificent 7 analysis, Indices Futures Higher Time Frame Analysis, and E-mini S&P500, Nasdaq 100, NYMEX Crude, Gold Futures Daily Chart analysis.
As of: October 21, 2026 05:00 CT
Market News Summary:
AI-related earnings supported a higher equity close, while technical weakness, concentrated AI spending and energy supply risks remained in focus.
Primary Drivers & Risks:
- Primary Driver: AI earnings revive technology stock demand
- Primary Risk: Weak breadth and concentrated AI spending
Tone:
Positive equity close with persistent technical and concentration concerns.
System News & Fundamentals
Geopolitical:
Persian Gulf oil flows in October nearly returned to pre-Iran-war levels, but traders remained concerned about the recovery’s fragility. Kuwait maintained customer deliveries largely at pre-conflict levels through alternative shipping arrangements and its tanker fleet.
Oil / Energy:
U.S. commercial crude inventories fell 3.1 million barrels, versus a consensus decline of 300,000 barrels. Kuwait reported output above 2 million barrels per day. Natural-gas prices remained low amid record domestic production and mild-weather projections.
Gold / Metals:
Gold moved higher as the dollar pulled back, although other coverage described continuing pressure and consolidation. The Royal Mint reported record silver and platinum sales and renewed gold demand despite higher prices and rising bond yields. Russia sold 6.2 tonnes of gold in September, reducing sovereign holdings to their lowest level since 2019.
Fed / Financials:
Persistent inflation and higher bond yields raised the opportunity cost of holding precious metals. The Canadian dollar held near a four-week high as investors maintained rate-hike bets. The excerpts provided no confirmed Federal Reserve policy decision.
Macro / Other:
U.S. government spending exceeded revenue by about $5.5 billion daily, and federal debt doubled over ten years. Unemployment was cited at 4.2%, near historic lows.
Conclusion:
AI-related earnings and renewed technology demand drove the reported equity advance. The Nasdaq’s 1.05% gain marked the clearest index-level outcome.
Weak breadth, semiconductor support tests and concentrated AI spending remained key counterweights. The larger-than-consensus crude inventory draw and fragile Gulf shipping recovery added energy cross-currents, while gold rebounded alongside a softer dollar.
Market News Sentiment
Market News Articles: 53
- Neutral: 56.60%
- Positive: 28.30%
- Negative: 15.09%
Sentiment Summary: Across 53 market news articles, 57% were neutral, 28% positive, and 15% negative.
Conclusion: Coverage was predominantly neutral, with positive sentiment exceeding negative sentiment by 13 percentage points.
GLD,Gold Articles: 15
- Neutral: 40.00%
- Positive: 33.33%
- Negative: 26.67%
Sentiment Summary: Across 15 GLD/Gold articles, sentiment was 40% neutral, 33% positive, and 27% negative.
Conclusion: Neutral sentiment was the largest category, and the snapshot contains no direct indices futures sentiment data.
USO,Oil Articles: 9
- Negative: 55.56%
- Positive: 44.44%
Sentiment Summary: Across 9 USO/oil articles, sentiment was 56% negative and 44% positive.
Conclusion: Oil coverage leaned negative; the snapshot provides no direct sentiment data on index futures.
Major ETFs and Mega Cap Tech Stocks
The Nasdaq Composite rose 1.05% to 26,702.86 as AI-related stocks rebounded on quarterly results. Disappointing Netflix guidance weighed on its shares. Intraday commentary flagged deteriorating S&P 500 breadth trends and lower-volume weakness, despite improvement in the share of stocks above their 200-day moving averages. The Russell 2000 tested historic support, while the VanEck Semiconductor ETF stood at critical technical support. Healthcare reached a sector record high.
AI spending concentration and valuation concerns contrasted with corporate examples of AI adoption. Korean won strength and capital repatriation pressured the KOSPI and U.S. semiconductors, with the Bank of Korea rate decision identified as a sector catalyst.
ETF, Mag7, and Cross-Market ETF Insights
Overall Tone
Daily risk appetite was positive, though gains were uneven and some assets weakened after the open.
Equity ETFs and Mag7
QQQ led the major equity ETFs, while SPY and DIA also advanced; mid- and small-cap ETFs gained versus the prior close but slipped from the open, tempering breadth. Mag7 mostly aligned with the advance: Tesla led, rising 3.41% versus the prior close and 1.32% from the open, followed by Nvidia and Apple, while Alphabet and Amazon declined. Meta rose versus the prior close but finished marginally below its open.
| Instrument | Bias | Date | NetC% | OC% | Close | Vwap | Vol |
|---|---|---|---|---|---|---|---|
| ▲ QQQ | ▲ ▲ ▲ | 2026-10-21 | ▲ +1.05% | ▲ +0.41% | 725.20 | ▲ 724.53 | 31,446,934 |
| ▲ SPY | ▲ ▲ ▲ | 2026-10-21 | ▲ +0.53% | ▲ +0.25% | 773.09 | ▲ 772.23 | 31,507,827 |
| ▲ DIA | ▲ ▲ ▲ | 2026-10-21 | ▲ +0.64% | ▲ +0.17% | 527.70 | ▲ 525.82 | 2,572,731 |
| ▼ IJH | ▲ ▼ ▼ | 2026-10-21 | ▲ +0.41% | ▼ -0.11% | 73.39 | ▼ 73.43 | 6,772,772 |
| ▼ IWM | ▲ ▼ ▼ | 2026-10-21 | ▲ +0.25% | ▼ -0.14% | 276.48 | ▼ 276.58 | 15,680,730 |
| AVG/Sum | — | — | +0.58% | +0.12% | — | — | 87,980,994 |
| Instrument | Bias | Date | NetC% | OC% | Close | Vwap | Vol |
|---|---|---|---|---|---|---|---|
| ▲ AAPL | ▲ ▲ ▲ | 2026-10-21 | ▲ +1.32% | ▲ +1.36% | 343.99 | ▲ 343.16 | 35,439,295 |
| ▲ TSLA | ▲ ▲ ▲ | 2026-10-21 | ▲ +3.41% | ▲ +1.32% | 386.47 | ▲ 385.96 | 44,067,145 |
| ▲ MSFT | ▲ ▲ ▲ | 2026-10-21 | ▲ +0.20% | ▲ +0.66% | 532.95 | ▲ 531.51 | 13,866,379 |
| ▲ NVDA | ▲ ▲ ▲ | 2026-10-21 | ▲ +2.54% | ▲ +0.46% | 221.97 | ▲ 220.82 | 86,446,983 |
| ▼ META | ▲ ▼ ▼ | 2026-10-21 | ▲ +0.47% | ▼ -0.01% | 697.52 | ▼ 703.80 | 24,447,681 |
| ▼ AMZN | ▼ ▼ ▲ | 2026-10-21 | ▼ -0.10% | ▼ -0.13% | 262.37 | ▲ 262.04 | 30,838,660 |
| ▼ GOOGL | ▼ ▼ ▲ | 2026-10-21 | ▼ -1.62% | ▼ -0.66% | 334.76 | ▲ 333.54 | 28,533,222 |
| AVG/Sum | — | — | +0.89% | +0.43% | — | — | 263,639,365 |
Cross-Market ETFs
Bitcoin ETF IBIT outpaced the equity benchmarks, gaining 2.42% versus the prior close and 1.03% from the open. Treasury bond ETF TLT and gold ETF GLD posted modest prior-close gains but slipped during the session, diverging from the major equity ETFs’ open-to-close advances. Oil ETF USO fell 0.50% versus the prior close despite rising 0.24% from the open.
| Instrument | Bias | Date | NetC% | OC% | Close | Vwap | Vol |
|---|---|---|---|---|---|---|---|
| ▲ IBIT | ▲ ▲ ▲ | 2026-10-21 | ▲ +2.42% | ▲ +1.03% | 47.84 | ▲ 47.72 | 49,817,406 |
| ▲ USO | ▼ ▲ ▲ | 2026-10-21 | ▼ -0.50% | ▲ +0.24% | 159.80 | ▲ 159.25 | 5,781,391 |
| ▼ GLD | ▲ ▼ ▲ | 2026-10-21 | ▲ +0.34% | ▼ -0.06% | 378.95 | ▲ 378.45 | 6,904,153 |
| ▼ TLT | ▲ ▼ ▲ | 2026-10-21 | ▲ +0.14% | ▼ -0.09% | 80.24 | ▲ 80.21 | 35,893,642 |
| AVG/Sum | — | — | +0.60% | +0.28% | — | — | 98,396,592 |
VIX — Market Fear Gauge Daily
| Level | Open | High | Low | NetC% | OC% | VR |
|---|---|---|---|---|---|---|
| 16.68 | 17.08 | 17.46 | 16.51 | -3.64% | -2.34% | 6.93 |
VIX fell 2.34% from the session's opening level. VIX fell 3.64% versus the previous session close. Expected volatility eased from the period open.
VR: Stocks up; volatility down. Volatility moved more in percentage terms.
Futures Session Fib Grid Analysis – realtime
Session Fib Grids normalise market positioning as percentages, making direction and alignment comparable across different asset types.
| Instrument | Bias | Time(CT) | YSFG | MSFG | WSFG | RSFG | SFG | TSI |
|---|---|---|---|---|---|---|---|---|
| ▲ ES | ▲ ▲ ▲ ▲ ▲ ▲ | 2026-10-21 15:59:58 | ▲ +63 | ▲ +19 | ▲ +77 | ▲ +27 | ▲ +27 | ▲ +51 |
| ▲ NQ | ▲ ▼ ▲ ▲ ▲ ▲ | 2026-10-21 15:59:59 | ▲ +77 | ▼ -41 | ▲ +67 | ▲ +26 | ▲ +26 | ▲ +53 |
| ▲ YM | ▲ ▲ ▲ ▲ ▲ ▲ | 2026-10-21 15:59:58 | ▲ +43 | ▲ +81 | ▲ +83 | ▲ +22 | ▲ +22 | ▲ +120 |
| ▼ EMD | ▲ ▲ ▲ ▼ ▼ ▼ | 2026-10-21 15:59:55 | ▲ +34 | ▲ +29 | ▲ +53 | ▼ -20 | ▼ -20 | ▼ -14 |
| ▼ RTY | ▲ ▼ ▲ ▼ ▼ ▼ | 2026-10-21 15:59:57 | ▲ +32 | ▼ -24 | ▲ +69 | ▼ -14 | ▼ -14 | ▼ -18 |
| ▲ FDAX | ▲ ▲ ▲ ▲ ▼ ▲ | 2026-10-21 14:59:57 | ▲ +19 | ▲ +51 | ▲ +1 | ▲ +73 | ▼ -18 | ▲ +43 |
| ▼ NKD | ▲ ▼ ▲ ▼ ▼ ▲ | 2026-10-21 15:59:59 | ▲ +173 | ▼ -51 | ▲ +40 | ▼ -15 | ▼ -3 | ▲ +86 |
| Instrument | Bias | Time(CT) | YSFG | MSFG | WSFG | RSFG | SFG | TSI |
|---|---|---|---|---|---|---|---|---|
| ▲ BTC | ▼ ▲ ▲ ▲ ▲ ▲ | 2026-10-21 16:17:37 | ▼ -22 | ▲ +5 | ▲ +51 | ▲ +49 | ▲ +40 | ▲ +69 |
| ▲ GC | ▼ ▼ ▼ ▲ ▲ ▲ | 2026-10-21 15:59:57 | ▼ -113 | ▼ -12 | ▼ -17 | ▲ +6 | ▲ +6 | ▲ +170 |
| ▲ CL | ▲ ▲ ▼ ▲ ▲ ▲ | 2026-10-21 15:59:59 | ▲ +176 | ▲ +58 | ▼ -16 | ▲ +9 | ▲ +7 | ▲ +18 |
| ▲ 6E | ▼ ▼ ▲ ▲ ▲ ▲ | 2026-10-21 15:59:57 | ▼ -53 | ▼ -48 | ▲ +22 | ▲ +3 | ▲ +7 | ▲ +89 |
| ▼ ZB | ▼ ▲ ▲ ▼ ▼ ▲ | 2026-10-21 15:59:29 | ▼ -39 | ▲ +75 | ▲ +4 | ▼ -9 | ▼ -7 | ▲ +57 |
Glossary: YSFG — yearly; MSFG — monthly; WSFG — weekly; RSFG — regular trading hours (RTH); SFG — the current session, including pre-market or other sessions. TSI indicates trend strength and power.
Bias shows trend alignment across these six readings. The arrows follow the column order: YSFG, MSFG, WSFG, RSFG, SFG and TSI. Matching arrows show alignment; opposing arrows show mixed conditions.
Futures Higher Time Frame Analysis
Summary of the current state of US Indices Futures based on higher time-frame (HTF) technical analysis as of: 2026-10-21: 17:00 CT.
US Indices Futures
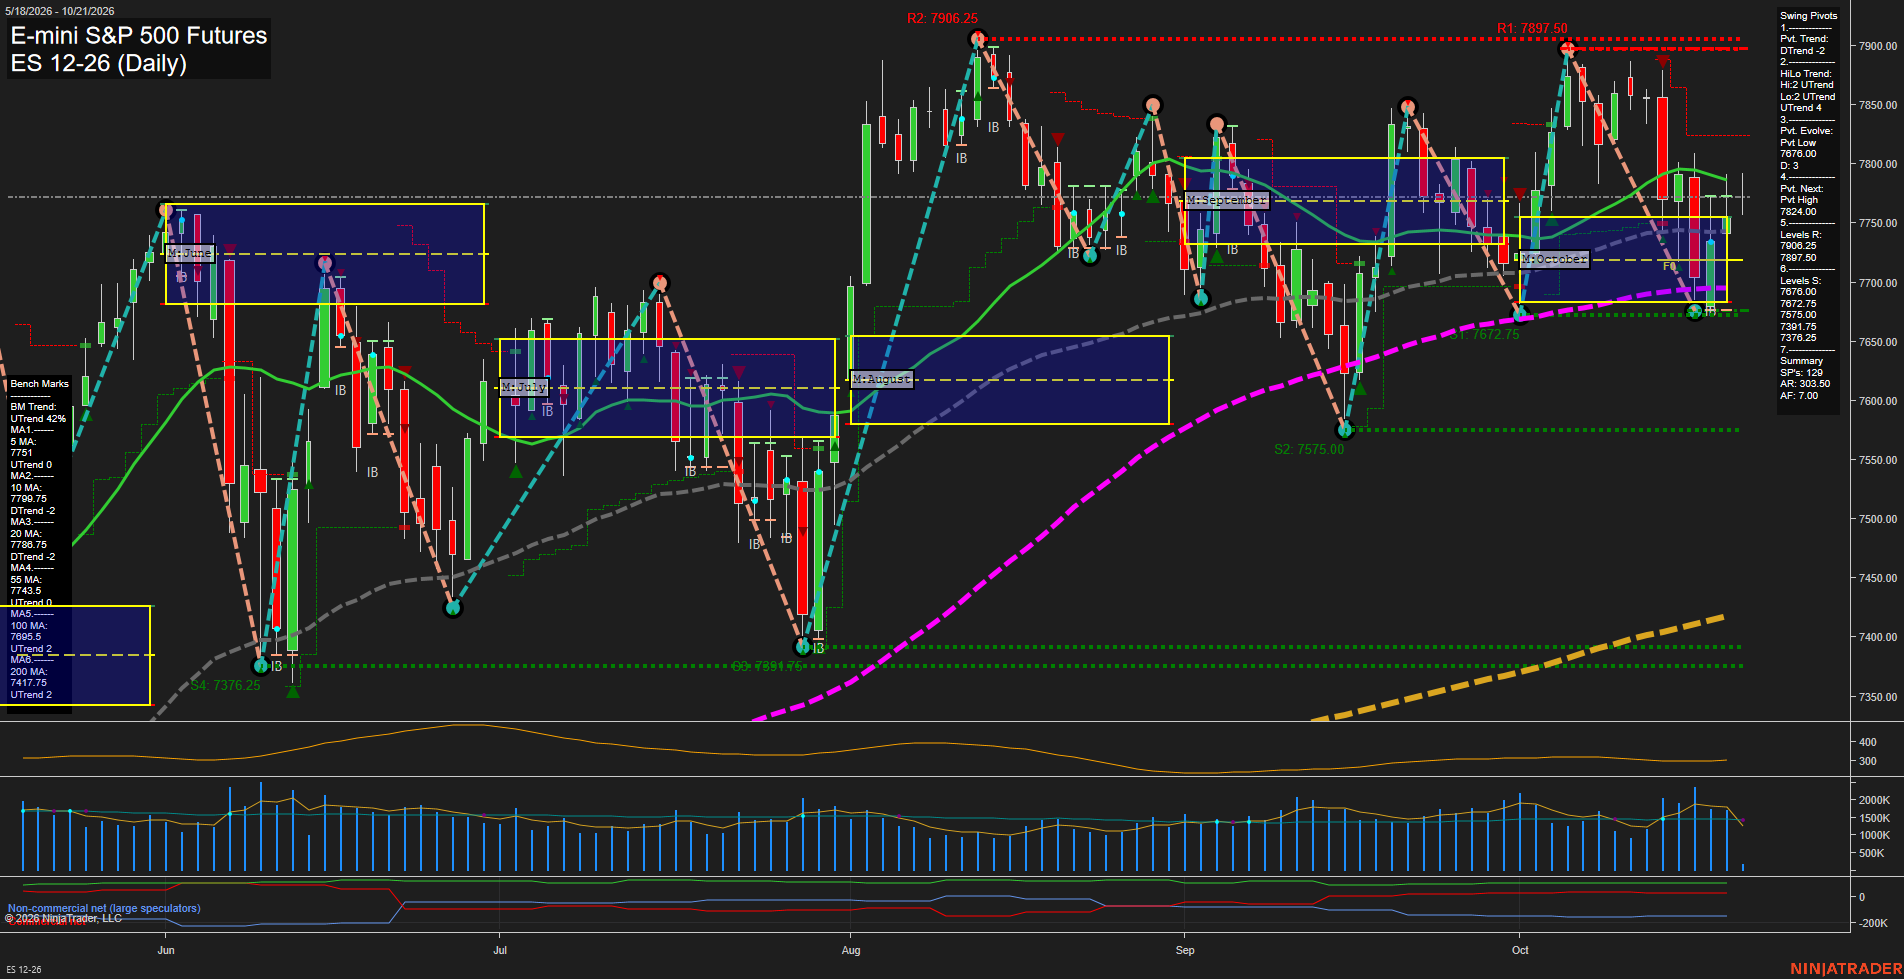
- ES YSFG/MSFG/WSFG above references, rising major benchmarks, daily DTrend versus weekly UTrend, support 7672.75–7676.00, reversal 7824.00, resistance 7897.50–7906.25.
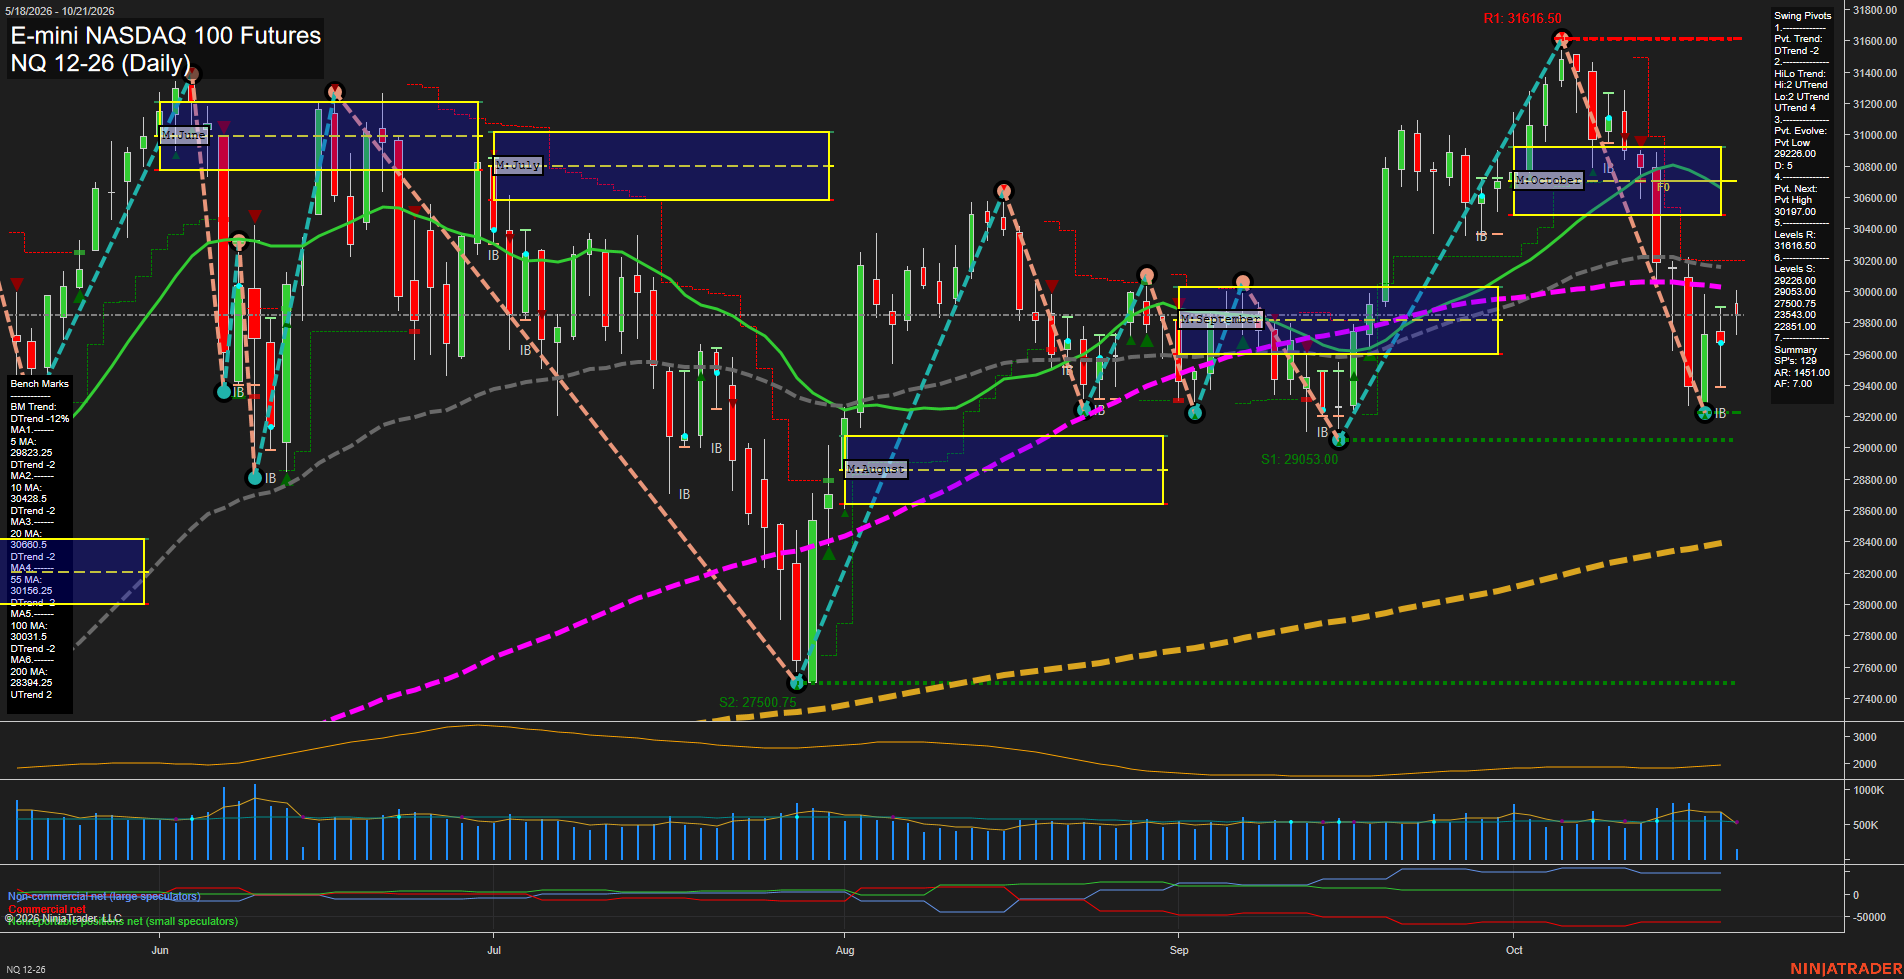
- NQ YSFG bullish, MSFG below F0%, weekly correction, declining daily 10–100 benchmarks, pivot DTrend, support 29053–29236, reversal 30197, resistance 31616.50.
- YM YSFG/MSFG/WSFG above F0%, rising long-term benchmarks, daily pivots up versus weekly DTrend, support 50859, weekly reversal 53213, resistance 54259–54294.
- EMD YSFG/MSFG above F0%, WSFG upward, daily 55/100 benchmarks declining, weekly pivot DTrend, support 3600.3, resistance 3708.7–3737.8, weekly reversal 3793.5.
- RTY YSFG bullish, daily WSFG above F0%, intermediate benchmarks declining, pivot trends down, support 2723.3–2723.8, resistance 2808.7–2815.2, weekly reversal 2888.7.
- FDAX YSFG/MSFG above F0%, WSFG below F0%, rising 200-day benchmark, pivot DTrend, support 24925/25169, resistance 25511–25686, daily reversal 25733.
Overall State
- Short-Term: Neutral
- Intermediate-Term: Neutral
- Long-Term: Bullish
Conclusion
Short-term direction is mixed: YM, EMD, and RTY show daily recoveries against weekly corrective structures, while ES, NQ, and FDAX retain daily pivot DTrends. ES and YM show stronger intermediate alignment; NQ and RTY remain intermediate-term bearish, with EMD mixed and FDAX intermediate-term bullish. Recent ES monthly-grid long and NQ short signals reflect this divergence. Yearly grids and rising long-term benchmarks maintain a shared bullish backdrop, while monthly-grid weakness distinguishes NQ. Nearby pivot thresholds and resistance clusters separate current rebounds from unresolved corrective structures.
Note: Intra-day counter-trend pullbacks or retracements may occur, HTF is context for informational usage and market structure. Glossary: Session Fib Grids periods of YSFG:’Yearly’, MSFG:’Monthly’, WSFG:’Weekly’
For full details visit: AlphaWebTrader Technicals
ES Daily View
Overall Rating
- Short-Term: Bearish
- Intermediate-Term: Bullish
- Long-Term: Bullish.
Key Insights Summary
Price is consolidating above the monthly and yearly Fib-grid center zones while the short-term pivot structure remains in a DTrend. The recent decline from the 7897.50-7906.25 resistance band produced lower short-term highs, and price is rotating around the 5-, 10-, and 20-day averages. Intermediate and long-term structure remains constructive because the HiLo trend, 55-day, 100-day, and 200-day benchmarks are rising. The 7676.00-7672.75 support cluster defines the current swing-low area, while 7824.00 is the next pivot reversal threshold and 7897.50-7906.25 remains the major overhead supply zone.
View charts on: AlphaWebTrader HTF Charts
NQ Daily View
Overall Rating
- Short-Term: Bearish
- Intermediate-Term: Bearish
- Long-Term: Bullish.
Key Insights Summary
Price is rebounding from the 29236 pivot low, but the recovery remains below the monthly F0% area and beneath the declining 10-, 20-, 55-, and 100-day benchmarks. The short-term pivot structure remains in DTrend, with 30197 as the active opposite-pivot threshold and the 30156-30429 moving-average cluster defining the nearby overhead technical area. Intermediate conditions are corrective despite the broader HiLo UTrend, while the yearly grid and price position above the rising 200-day benchmark retain a constructive long-term structure. The recent sequence reflects elevated volatility following rejection from the 31616.50 swing high, with 29053.00 remaining the principal nearby swing support.
View charts on: AlphaWebTrader HTF Charts
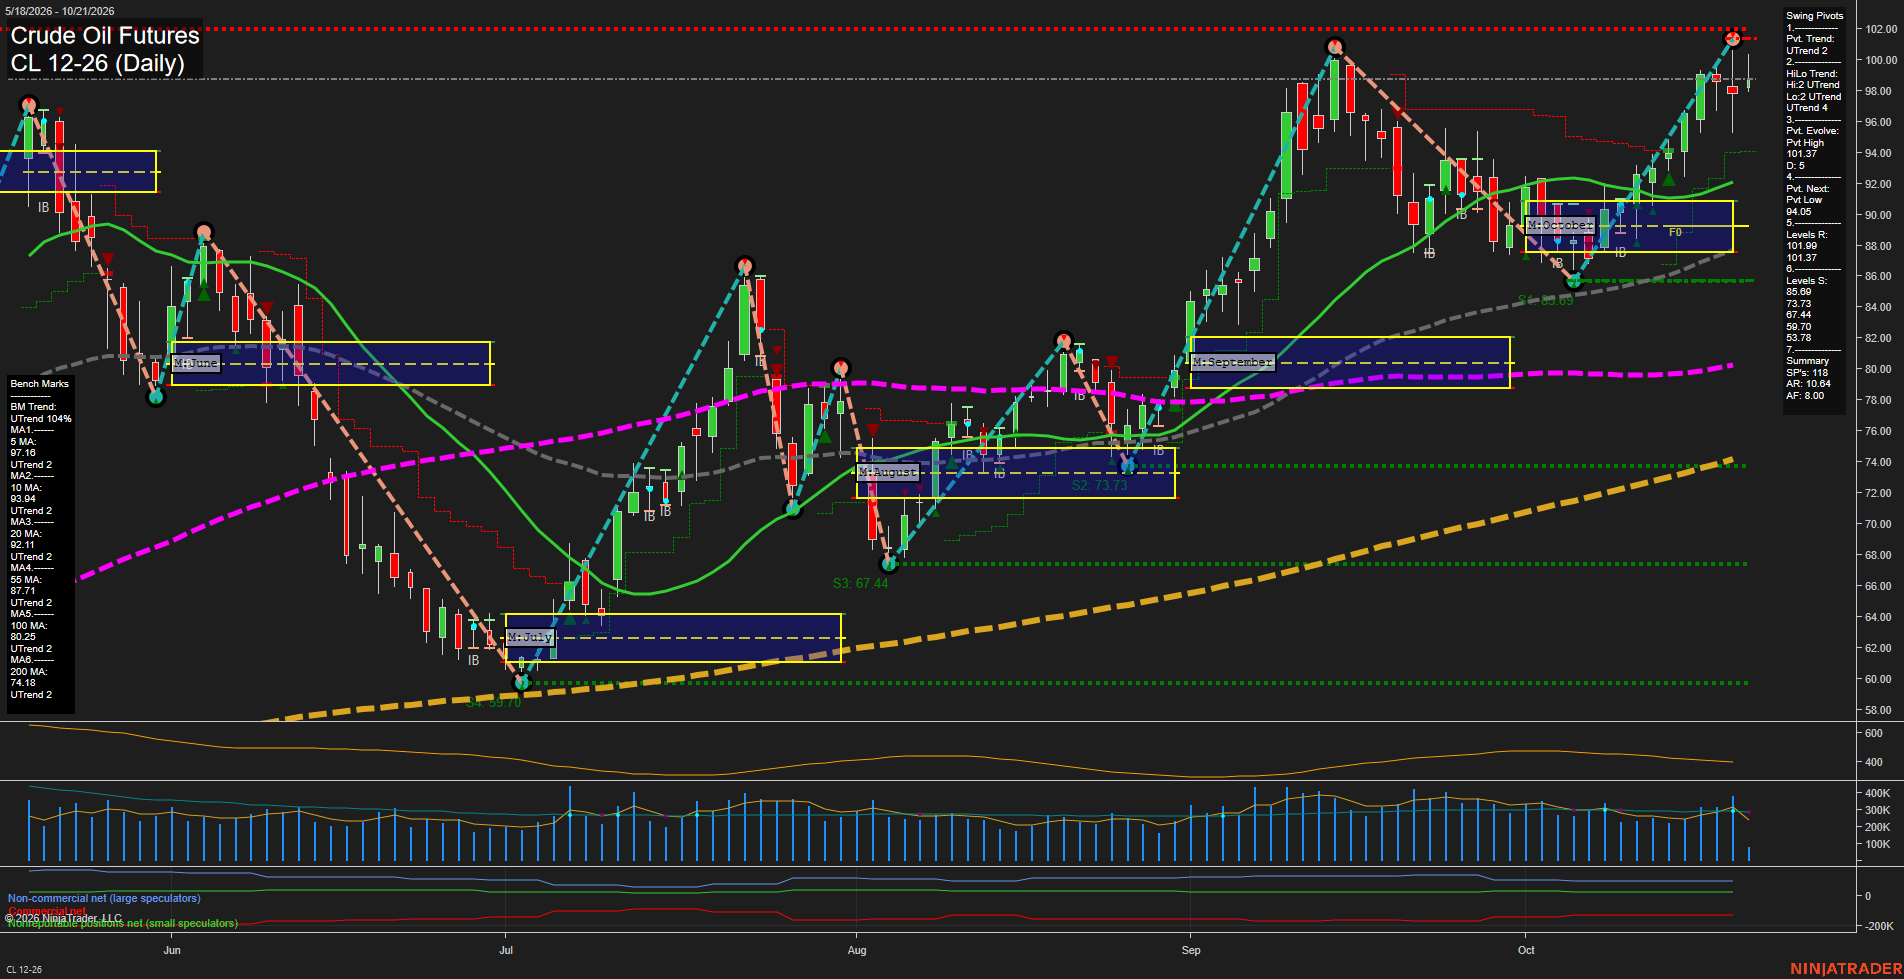
CL Daily View
Overall Rating
- Short-Term: Bullish
- Intermediate-Term: Bullish
- Long-Term: Bullish.
Key Insights Summary
Price remains in a broad bullish swing structure, supported by aligned rising 5-, 10-, 20-, 55-, 100-, and 200-day benchmarks and confirmed by UTrend readings in both pivot classifications. The market has retraced modestly from the 101.37 pivot high and is consolidating beneath that resistance, while the weekly fib-grid reading remains below its F0% level. This creates a short-cycle countertrend tone within a still-positive intermediate and long-term advance. Small recent bars and slowing momentum reflect compression after the sharp September-October rally; 94.05 is the key near-term pivot reversal reference, while 101.37 remains the primary overhead swing-high level.
View charts on: AlphaWebTrader HTF Charts
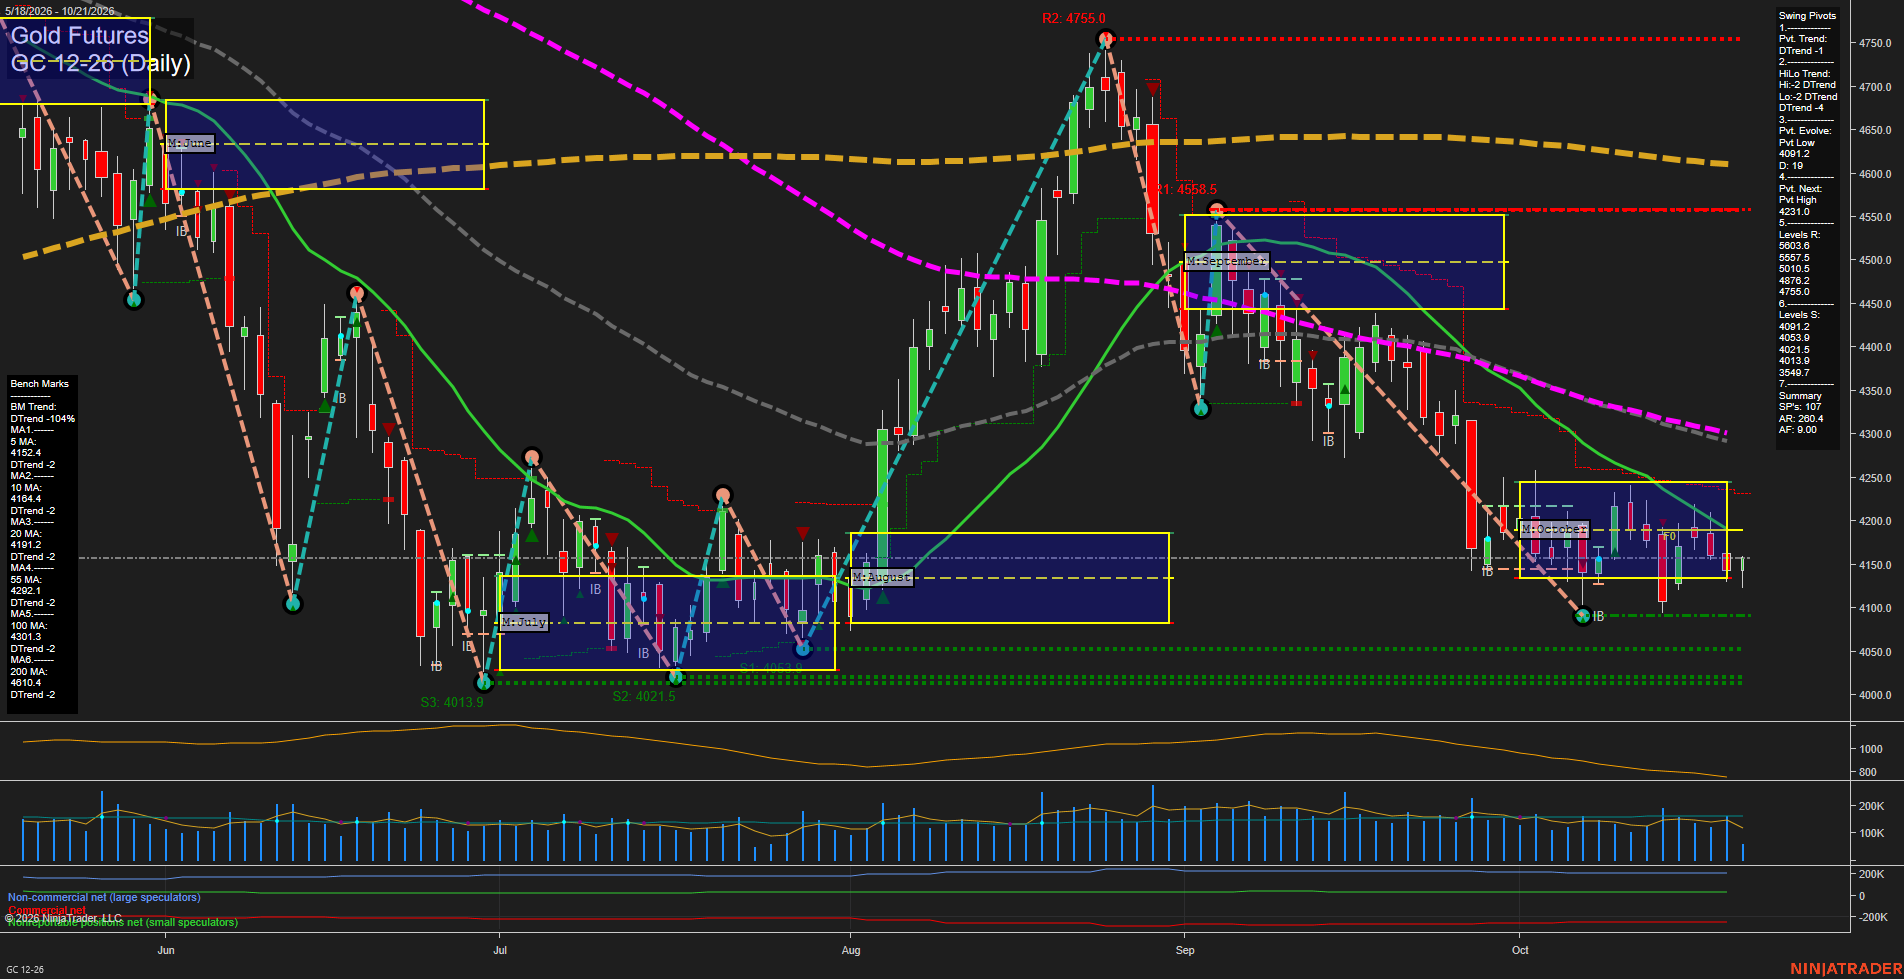
GC Daily View
Overall Rating
- Short-Term: Bearish
- Intermediate-Term: Bearish
- Long-Term: Bearish.
Key Insights Summary
Price remains beneath the weekly, monthly, and yearly Fib-grid reference points, while all six daily benchmarks are declining and positioned above or near the market. The pivot structure remains in a DTrend, with the recent low at 4091.2 defining the immediate downside reference and 4231.0 defining the reversal threshold for a new short-term pivot high. Small daily bars and slow momentum reflect post-selloff consolidation near the October grid rather than a sustained recovery. The pattern retains lower-high characteristics beneath the 20-day and 55-day averages, while volatility remains elevated versus a typical quiet consolidation.
View charts on: AlphaWebTrader HTF Charts
ZB Daily View
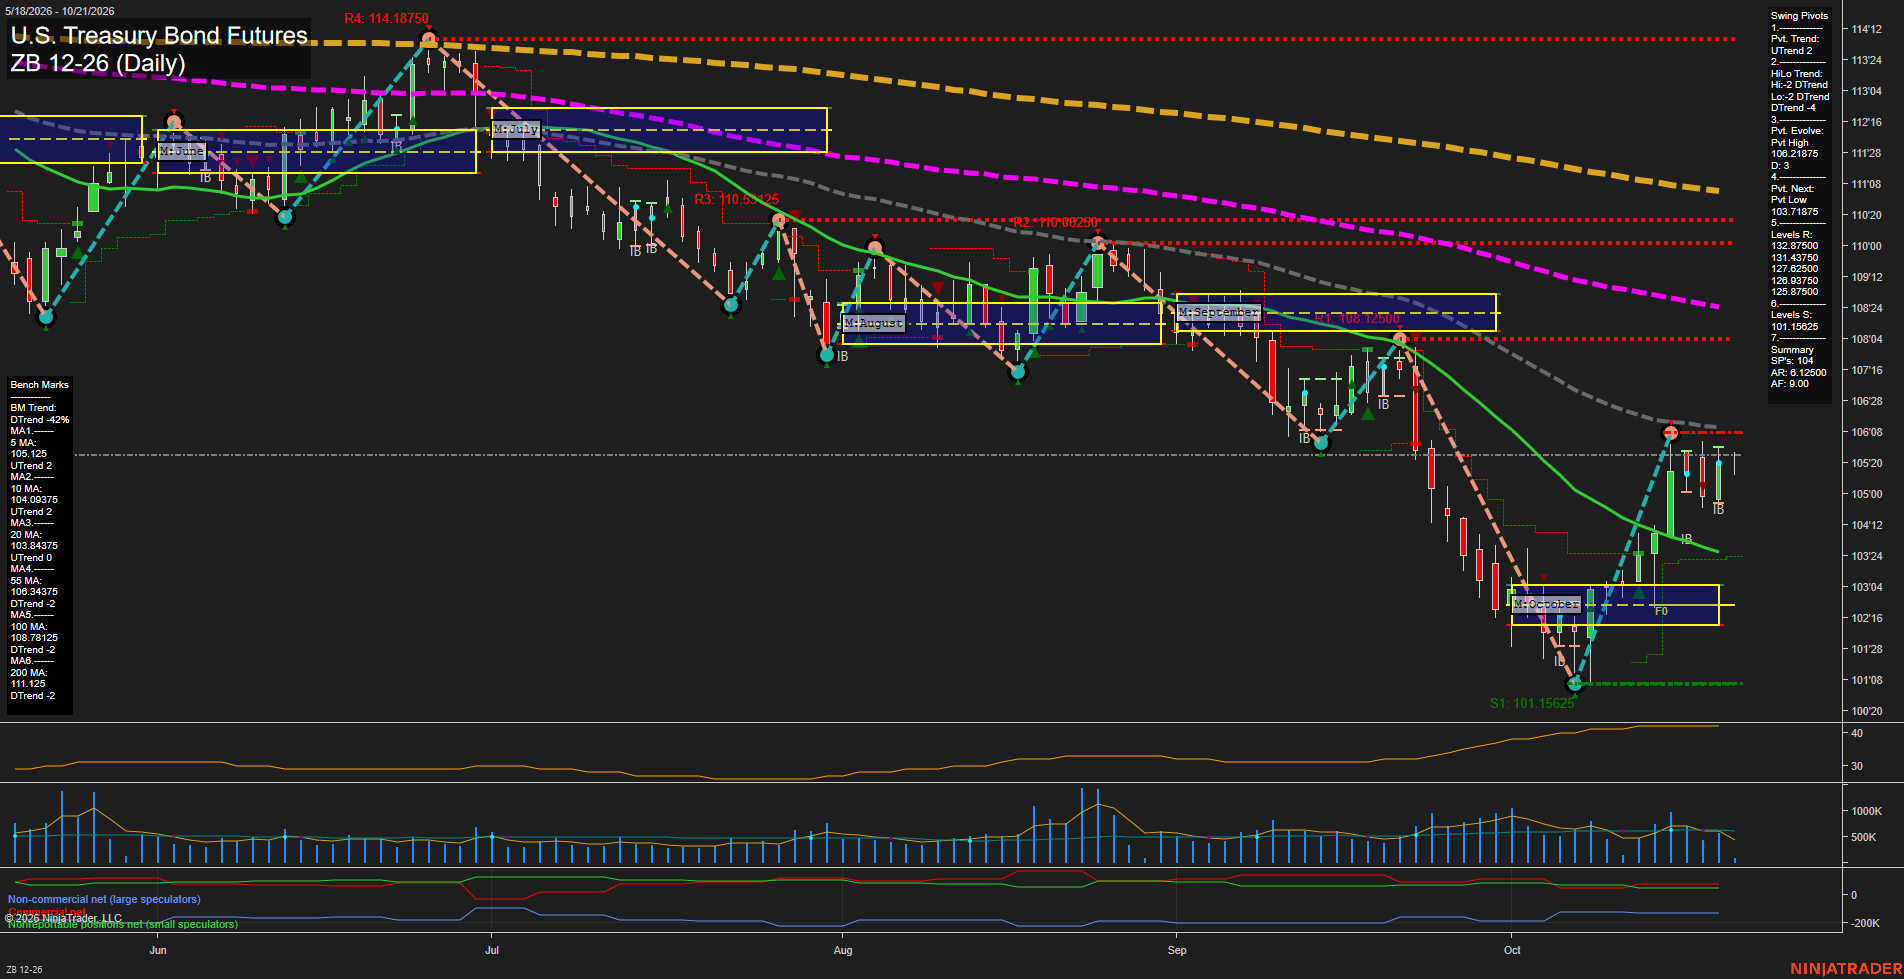
Overall Rating
- Short-Term: Bullish
- Intermediate-Term: Bearish
- Long-Term: Bearish.
Key Insights Summary
The market is sustaining a sharp short-term recovery from the early-October 101.15625 swing low, with price above the weekly and monthly F0% levels and above the rising 5-, 10-, and 20-day benchmarks. The pivot structure remains short-term upward, although the broader HiLo structure is still downward and price remains beneath the declining 55-, 100-, and 200-day averages. Recent small bars near 105.625 reflect consolidation after the rapid rebound and beneath the 106.3 evolving pivot high. This creates a counter-trend rally character within the longer-term decline, while the 103.1875 pivot-next level defines the nearby structural reversal reference.
View charts on: AlphaWebTrader HTF Charts