
Nasdaq futures rose 0.6% ahead of the U.S. session but remained corrective, while Dow daily momentum was bullish and S&P 500 longer-term uptrends held.
Fundamentals: U.S. index futures advanced ahead of the session as AI-linked earnings supported technology shares, with Nasdaq futures up 0.6% and S&P 500 futures gaining 0.19%. Elevated crude prices, Middle East supply disruptions and firm Treasury yields tempered sentiment. Gold and silver remained under pressure, while after-close earnings from Meta and Tesla were a focus.
Technicals: Stock index futures retain long-term bullish structures, but shorter-term conditions diverge. The S&P 500 is consolidating below major resistance, while Nasdaq futures remain corrective despite a rebound. Dow futures show bullish daily momentum, and small caps are rebounding within an intermediate downswing. DAX futures retain a broader uptrend but face short-term weakness and overhead resistance.
Pre-Market Trading 360° view Market Radar of: holidays, earnings, eco-news, market-news summary, news sentiment, prior session major ETFs, MAG7, Higher Time Frame Analysis Indices Futures Summary, and E-mini S&P500, Nasdaq 100, NYMEX Crude, Gold Futures Daily Chart analysis.
As of: October 21, 2026 07:17 CT
Earnings Radar
Monitoring for earnings releases by the Magnificent 7, AI-tech-related firms, and major financial institutions.
- IBM Release: 2026-10-21 T:AMC
- META Release: 2026-10-21 T:AMC
- TSLA Release: 2026-10-21 T:AMC
Conclusion: IBM, META, and TSLA report after market close today, October 21, 2026, placing major tech and MAG7 earnings on the index-futures event calendar. Market momentum and volume can slow ahead of major earnings releases; the after-close timing puts results outside the regular cash session.
For full details visit: Yahoo Earnings Calendar
EcoNews Radar U.S. Events
| Day | Time | Impact | Event |
|---|---|---|---|
| Wed | 10:30 | Low | Crude Oil Inventories |
| Thu | 08:30 | Medium | Unemployment Claims |
| Fri | 09:45 | Medium | Flash Manufacturing PMI |
| Fri | 09:45 | Medium | Flash Services PMI |
| Fri | 10:00 | Medium | Revised UoM Consumer Sentiment |
| Fri | 10:00 | Medium | Revised UoM Inflation Expectations |
EcoNews Summary
No qualifying high-impact EcoNews events are listed. No medium-impact events meet the oil, energy, or petroleum-supply criteria. The crude oil inventories release is classified as low impact and is excluded.
Event Notes:
- No listed events meet the specified impact criteria.
Conclusion:
No single most important day or event is identified for the week because none of the listed events qualify for inclusion.
For full details visit: Forex Factory EcoNews
Market News Summary:
U.S. index futures advanced on AI-linked earnings strength, while elevated oil prices and firm Treasury yields restrained sentiment.
Primary Drivers & Risks:
- Primary Driver: AI-linked earnings support technology futures
- Primary Risk: Energy supply disruptions and inflation pressure
Tone:
Cautiously positive, with technology strength offset by energy and rate concerns.
Stock Market / ETFs / Indices:
Nasdaq 100 futures gained about 160 points, or 0.6%, while S&P 500 futures rose 0.19% and Dow futures were little changed. Stronger AI-linked results and gains in Asian and European AI stocks supported the rebound after a technology sell-off. Two Magnificent Seven companies report after the close. Healthcare’s premium valuation reflected demand for defensive exposure amid AI valuation concerns.
Geopolitical:
Threats to Hormuz shipping and attacks on a tanker and Saudi facilities kept Middle East supply risks in focus. Iran-related mediation discussions had not eased reported supply concerns. Indian Oil is trimming Middle East imports under annual contracts amid the Iran war.
Oil / Energy:
Crude rebounded alongside a reported 4.93-million-barrel API inventory draw, while recovering Middle East exports provided a counterweight to supply disruptions. Reports placed Brent around $108–$110 a barrel. Diesel shortages drew U.S. intervention, including a plan to loan roughly one-third of the heating oil reserve. Washington also discussed refining Western energy supplies with Reliance Industries.
Gold / Metals:
Gold and silver remained under pressure from higher yields, dollar strength and rate-hike pricing despite record ETF holdings. Reported technical reference levels were $4,083 for gold and $57.39 for silver. Separately, Hudbay and Mitsubishi approved an Arizona copper project with production scheduled for the second half of 2029.
Fed / Financials:
Treasury yields edged higher in Asian trading before steadying as investors awaited jobless claims and mortgage data. One report cited 94% implied odds of a December Fed hike, with high energy prices sustaining inflation concerns. French bonds led euro zone yields higher.
Macro / Other:
The average conforming 30-year mortgage rate fell to 7.41% from 7.50%, its first decline in two months. Purchase mortgage applications nevertheless dropped 7% for the week and stood 18% below the year-earlier level, underscoring housing demand weakness.
Conclusion:
AI-linked earnings strength drove the advance in U.S. index futures, with Nasdaq outperforming the S&P 500 and Dow. After-close reports from two Magnificent Seven companies remained a key earnings focus.
Elevated crude prices, Middle East shipping disruptions and firm yields formed the main counterweights to the equity rebound. Defensive healthcare demand and weaker mortgage applications added evidence of uneven sentiment and economic conditions.
Market News Sentiment
Market News Articles: 61
- Neutral: 36.07%
- Negative: 34.43%
- Positive: 29.51%
Sentiment Summary: Across 61 market news articles, sentiment was 36% neutral, 34% negative, and 30% positive.
Conclusion: Neutral sentiment was the largest category, while negative coverage exceeded positive coverage by 5 percentage points before rounding.
GLD,Gold Articles: 15
- Neutral: 46.67%
- Positive: 33.33%
- Negative: 20.00%
Sentiment Summary: Across 15 GLD/Gold articles, sentiment was 47% neutral, 33% positive, and 20% negative.
Conclusion: Neutral sentiment was the largest category, with positive coverage exceeding negative coverage; the snapshot contains no direct indices futures sentiment data.
USO,Oil Articles: 14
- Positive: 42.86%
- Negative: 28.57%
- Neutral: 28.57%
Sentiment Summary: Across 14 USO/oil articles, sentiment was 43% positive, 29% negative, and 29% neutral.
Conclusion: Positive sentiment was the largest category, but the snapshot covers oil-related news rather than indices futures.
Major ETFs and Mega Cap Tech Stocks
Session Pending Predicted Gaps
| Instrument | Prior Close | Predicted Open | Gap % | Gap Pattern |
|---|---|---|---|---|
| QQQ | 717.63 | 721.76 | ▲ +0.58% | ▼ IGU |
| GLD | 377.65 | 379.19 | ▲ +0.41% | ▼ IGU |
| IJH | 73.09 | 73.38 | ▲ +0.40% | ▲ OGU |
| IWM | 275.78 | 276.43 | ▲ +0.24% | ▼ IGU |
| SPY | 769.05 | 770.61 | ▲ +0.20% | ▼ IGU |
| DIA | 524.36 | 525.29 | ▲ +0.18% | ▼ IGU |
| TLT | 80.13 | 80.27 | ▲ +0.18% | ▼ IGU |
| USO | 160.61 | 160.74 | ▲ +0.08% | ▼ IGU |
ETF, Mag7, and Cross-Market ETF Insights
Overall Tone
Daily risk tone was broadly constructive, though uneven across equities and other assets.
Equity ETFs and Mag7
Small caps led, with IWM gaining 1.57% open to close and 1.66% versus the prior close; midcaps and the Dow also outpaced SPY, while QQQ rose during the session but finished slightly below its prior close. Mag7 alignment was weak: Tesla advanced, Apple, Meta and Microsoft declined on both comparisons, Amazon slipped intraday despite a marginal prior-close gain, and Nvidia rose intraday but remained below its prior close.
Cross-Market ETFs
Long-duration Treasuries joined the broader equity advance, although TLT’s gain was largely established before the open, while bitcoin’s IBIT strengthened 1.50% during the session. Gold and oil diverged from the broader equity gains: GLD declined on both comparisons, while USO fell 1.28% open to close but only 0.12% versus its prior close.
| Instrument | Bias | Date | NetC% | OC% | Close | Vwap | Vol |
|---|---|---|---|---|---|---|---|
| ▲ IWM | ▲▲ | 2026-10-20 | ▲ +1.66% | ▲ +1.57% | 275.78 | ▲ 275.05 | 26,435,417 |
| ▲ IJH | ▲▲ | 2026-10-20 | ▲ +0.98% | ▲ +1.06% | 73.09 | ▲ 72.96 | 7,259,617 |
| ▲ DIA | ▲▲ | 2026-10-20 | ▲ +1.05% | ▲ +1.02% | 524.36 | ▲ 523.57 | 3,616,778 |
| ▲ SPY | ▲▲ | 2026-10-20 | ▲ +0.34% | ▲ +0.42% | 769.05 | ▲ 768.97 | 35,110,840 |
| ▲ QQQ | ▼▲ | 2026-10-20 | ▼ -0.10% | ▲ +0.33% | 717.63 | ▼ 717.93 | 30,713,352 |
| Average / total | — | — | +0.78% | +0.88% | — | — | 103,136,004 |
| Instrument | Bias | Date | NetC% | OC% | Close | Vwap | Vol |
|---|---|---|---|---|---|---|---|
| ▲ TSLA | ▲▲ | 2026-10-20 | ▲ +1.54% | ▲ +0.93% | 373.71 | ▲ 373.03 | 32,588,463 |
| ▲ NVDA | ▼▲ | 2026-10-20 | ▼ -0.29% | ▲ +0.23% | 216.47 | ▲ 216.34 | 80,281,632 |
| ▼ META | ▼▼ | 2026-10-20 | ▼ -1.59% | ▼ -0.11% | 694.25 | ▲ 690.34 | 17,115,742 |
| ▼ AAPL | ▼▼ | 2026-10-20 | ▼ -1.00% | ▼ -0.11% | 339.50 | ▼ 340.34 | 36,598,474 |
| ▼ MSFT | ▼▼ | 2026-10-20 | ▼ -0.31% | ▼ -0.38% | 531.87 | ▲ 531.36 | 15,192,747 |
| ▼ AMZN | ▲▼ | 2026-10-20 | ▲ +0.07% | ▼ -0.55% | 262.63 | ▼ 262.92 | 35,265,573 |
| Average / total | — | — | -0.26% | 0.00% | — | — | 217,042,631 |
| Instrument | Bias | Date | NetC% | OC% | Close | Vwap | Vol |
|---|---|---|---|---|---|---|---|
| ▲ IBIT | ▲▲ | 2026-10-20 | ▲ +0.89% | ▲ +1.50% | 46.71 | ▼ 46.74 | 32,627,087 |
| ▲ TLT | ▲▲ | 2026-10-20 | ▲ +0.84% | ▲ +0.08% | 80.13 | ▲ 80.09 | 28,479,020 |
| ▼ GLD | ▼▼ | 2026-10-20 | ▼ -0.54% | ▼ -0.07% | 377.65 | ▼ 378.47 | 6,105,622 |
| ▼ USO | ▼▼ | 2026-10-20 | ▼ -0.12% | ▼ -1.28% | 160.61 | ▲ 159.03 | 7,575,659 |
| Average / total | — | — | +0.27% | +0.06% | — | — | 74,787,388 |
VIX — Market Fear Gauge Daily
| Level | Open | High | Low | NetC% | OC% |
|---|---|---|---|---|---|
| 17.31 | 18.63 | 18.86 | 17.25 | -6.13% | -7.09% |
VIX fell 7.09% from the session's opening level. It fell 6.13% versus the previous session close. Expected volatility eased from the period open.
ATN Vol Ratio: 18.28
Stocks advanced while expected volatility eased. Volatility's percentage response was larger than the stock-market move.
Futures Session Fib Grid Analysis – realtime
| Instrument | Bias | Time(CT) | YSFG | MSFG | WSFG | RSFG |
|---|---|---|---|---|---|---|
| ▲ ES | ▲ +194 | 2026-10-21 07:18:09 | ▲ +60 | ▲ +10 | ▲ +61 | ▲ +63 |
| ▲ NQ | ▲ +124 | 2026-10-21 07:18:13 | ▲ +73 | ▼ -49 | ▲ +53 | ▲ +47 |
| ▲ YM | ▲ +276 | 2026-10-21 07:18:08 | ▲ +39 | ▲ +68 | ▲ +60 | ▲ +109 |
| ▲ EMD | ▲ +243 | 2026-10-21 07:18:05 | ▲ +34 | ▲ +31 | ▲ +57 | ▲ +121 |
| ▲ RTY | ▲ +208 | 2026-10-21 07:18:09 | ▲ +32 | ▼ -22 | ▲ +71 | ▲ +127 |
| ▲ FDAX | ▲ +96 | 2026-10-21 07:18:10 | ▲ +17 | ▲ +44 | ▼ -10 | ▲ +45 |
| ▼ NKD | ▲ +134 | 2026-10-21 07:14:15 | ▲ +171 | ▼ -53 | ▲ +37 | ▼ -21 |
| Instrument | Bias | Time(CT) | YSFG | MSFG | WSFG | RSFG |
|---|---|---|---|---|---|---|
| ▲ BTC | ▲ +94 | 2026-10-21 07:17:28 | ▼ -26 | ▼ -3 | ▲ +30 | ▲ +93 |
| ▲ GC | ▼ -112 | 2026-10-21 07:18:13 | ▼ -114 | ▼ -12 | ▼ -19 | ▲ +33 |
| ▼ CL | ▲ +186 | 2026-10-21 07:18:13 | ▲ +178 | ▲ +61 | ▼ -9 | ▼ -44 |
| ▲ 6E | ▼ -49 | 2026-10-21 07:18:08 | ▼ -53 | ▼ -48 | ▲ +23 | ▲ +29 |
| ▲ ZB | ▲ +82 | 2026-10-21 07:17:42 | ▼ -39 | ▲ +76 | ▲ +5 | ▲ +40 |
Futures Indices – Higher Time Frame Analysis
Summary of the current state of US Indices Futures based on higher time-frame (HTF) technical analysis as of: 2026-10-21: 07:18 CT.
US Indices Futures
- ES above YSFG/MSFG centers and weekly references, rising longer-term benchmarks, daily DTrend versus weekly UTrend, support 7672.75–7676.00, reversal 7824.00, resistance 7897.50–7906.25.
- NQ YSFG bullish, below MSFG F0%, WSFG unspecified, declining daily 10–100 benchmarks, pivot DTrend, support 29053.00–29236, reversal 30197, resistance 31616.50.
- YM above YSFG/MSFG/WSFG references, rising long-term benchmarks, daily pivots up versus weekly DTrend, support 50859, weekly reversal 53213, resistance 54259–54294.
- EMD above YSFG/MSFG F0%, WSFG upward, below declining daily 55/100 benchmarks, weekly pivot DTrend, support 3600.3, resistance 3708.7–3737.8, weekly reversal 3793.5.
- RTY YSFG bullish, MSFG unspecified, above WSFG F0%, below declining daily 20/55/100 benchmarks, pivots down, support 2723.3–2723.8, resistance 2808.7–2815.2, weekly reversal 2888.7.
- FDAX above YSFG/MSFG F0%, below WSFG F0%, rising daily 10/20/200 benchmarks, pivot DTrend, support 24925–25169, benchmark resistance 25511–25686, reversal 25733.
Overall State
- Short-Term: Neutral
- Intermediate-Term: Neutral
- Long-Term: Bullish
Conclusion
Long-term bullish alignment persists across all six instruments through yearly grids and longer-term benchmarks. Intermediate structure diverges: ES, YM, and FDAX retain upward structures, while NQ and RTY remain corrective and EMD is mixed across timeframes. YM leads daily recovery alignment; NQ remains weaker across daily and weekly measures. ES daily weakness contrasts with its weekly UTrend. EMD and RTY daily rebounds remain within weekly pivot downtrends. Recent ES monthly-grid and EMD support-area long signals contrast with NQ short signals. Monthly and weekly grid differences, overhead benchmark clusters, and unresolved pivot-reversal thresholds limit short-term directional alignment.
Note: Intra-day counter-trend pullbacks or retracements may occur, HTF is context for informational usage and market structure. Glossary: Session Fib Grids periods of YSFG:’Yearly’, MSFG:’Monthly’, WSFG:’Weekly’
For full details visit: AlphaWebTrader Technicals
ES Daily View
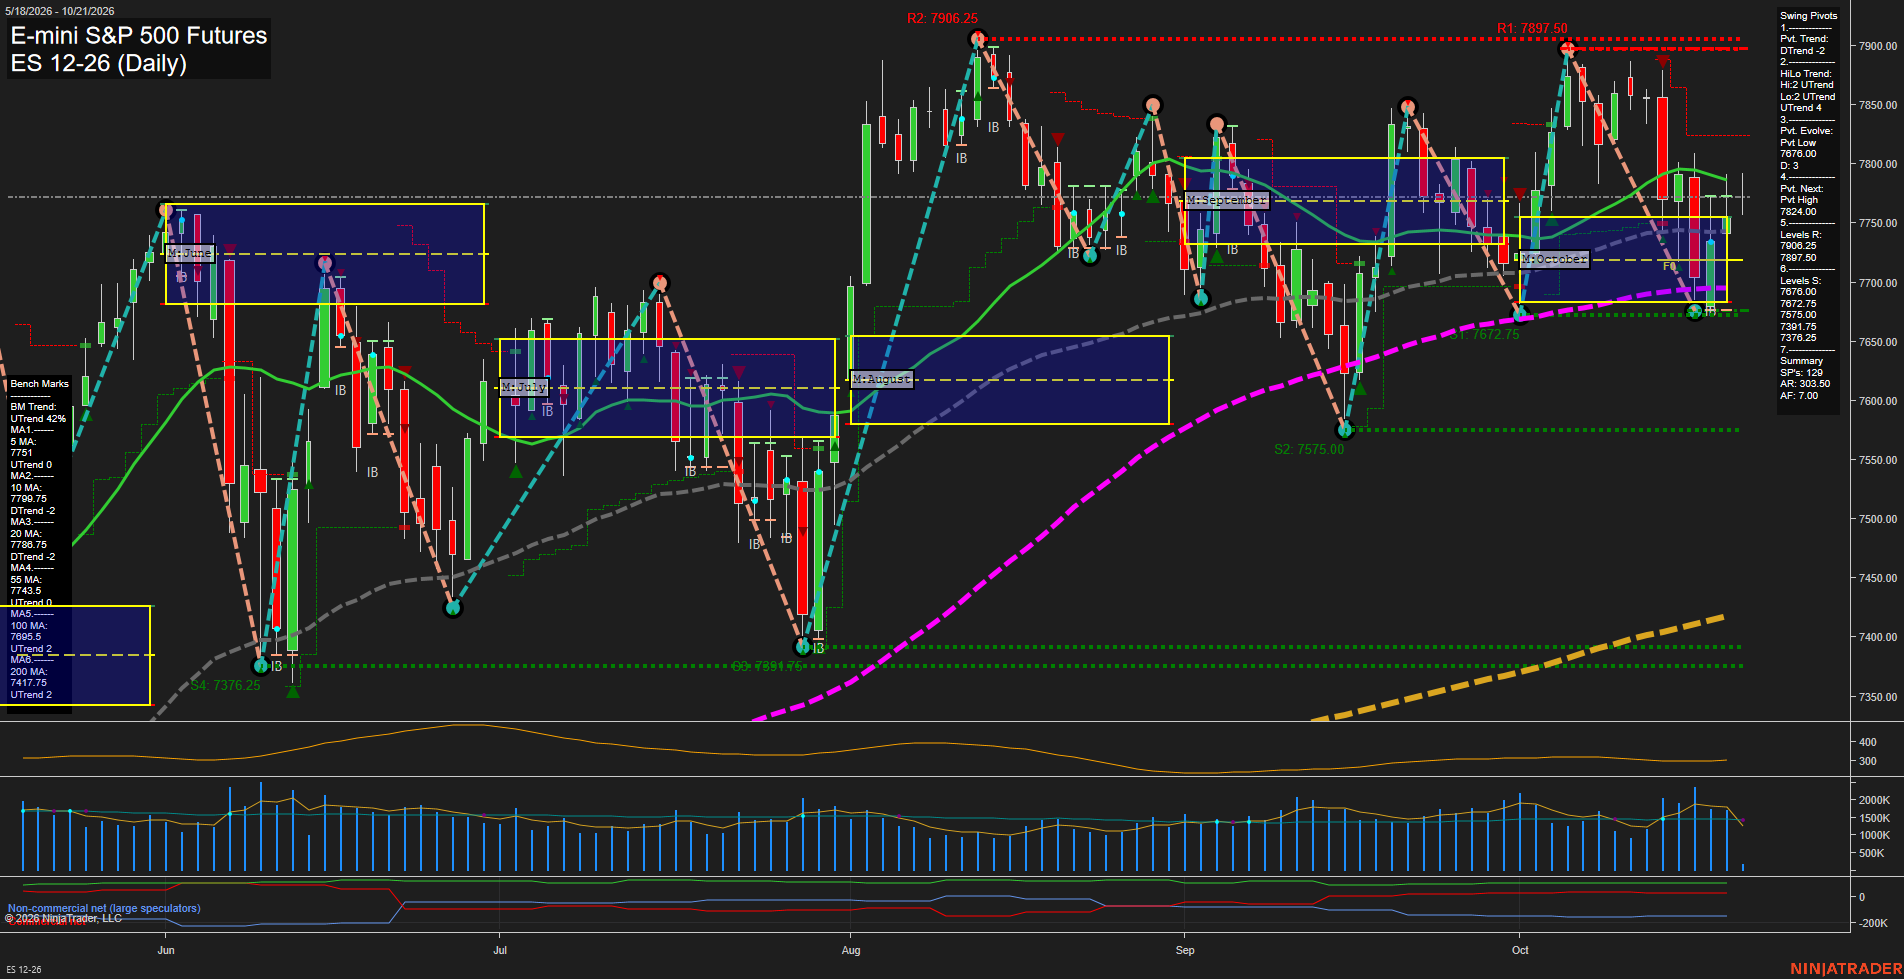
Overall Rating
- Short-Term: Bearish
- Intermediate-Term: Bullish
- Long-Term: Bullish.
Key Insights Summary
Price is consolidating above the monthly and yearly Fib-grid center zones while the short-term pivot structure remains in a DTrend. The recent decline from the 7897.50-7906.25 resistance band produced lower short-term highs, and price is rotating around the 5-, 10-, and 20-day averages. Intermediate and long-term structure remains constructive because the HiLo trend, 55-day, 100-day, and 200-day benchmarks are rising. The 7676.00-7672.75 support cluster defines the current swing-low area, while 7824.00 is the next pivot reversal threshold and 7897.50-7906.25 remains the major overhead supply zone.
View charts on: AlphaWebTrader HTF Charts
NQ Daily View
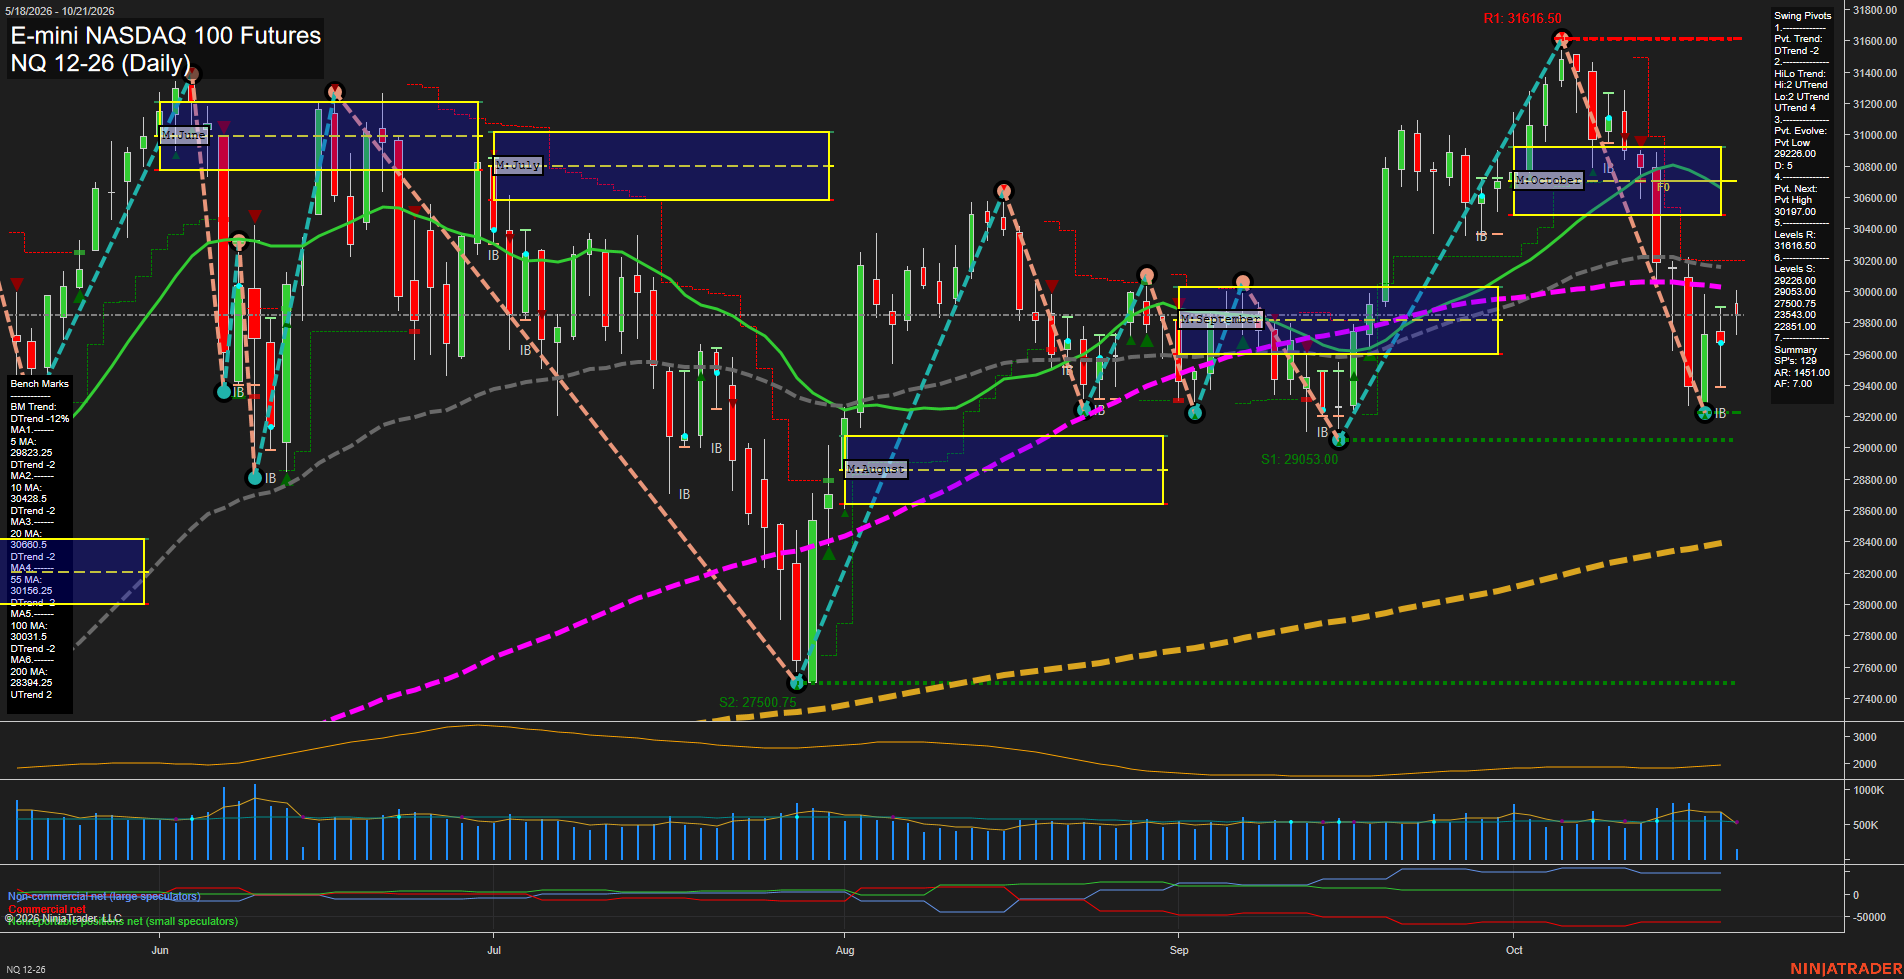
Overall Rating
- Short-Term: Bearish
- Intermediate-Term: Bearish
- Long-Term: Bullish.
Key Insights Summary
Price is rebounding from the 29236 pivot low, but the recovery remains below the monthly F0% area and beneath the declining 10-, 20-, 55-, and 100-day benchmarks. The short-term pivot structure remains in DTrend, with 30197 as the active opposite-pivot threshold and the 30156-30429 moving-average cluster defining the nearby overhead technical area. Intermediate conditions are corrective despite the broader HiLo UTrend, while the yearly grid and price position above the rising 200-day benchmark retain a constructive long-term structure. The recent sequence reflects elevated volatility following rejection from the 31616.50 swing high, with 29053.00 remaining the principal nearby swing support.
View charts on: AlphaWebTrader HTF Charts
CL Daily View
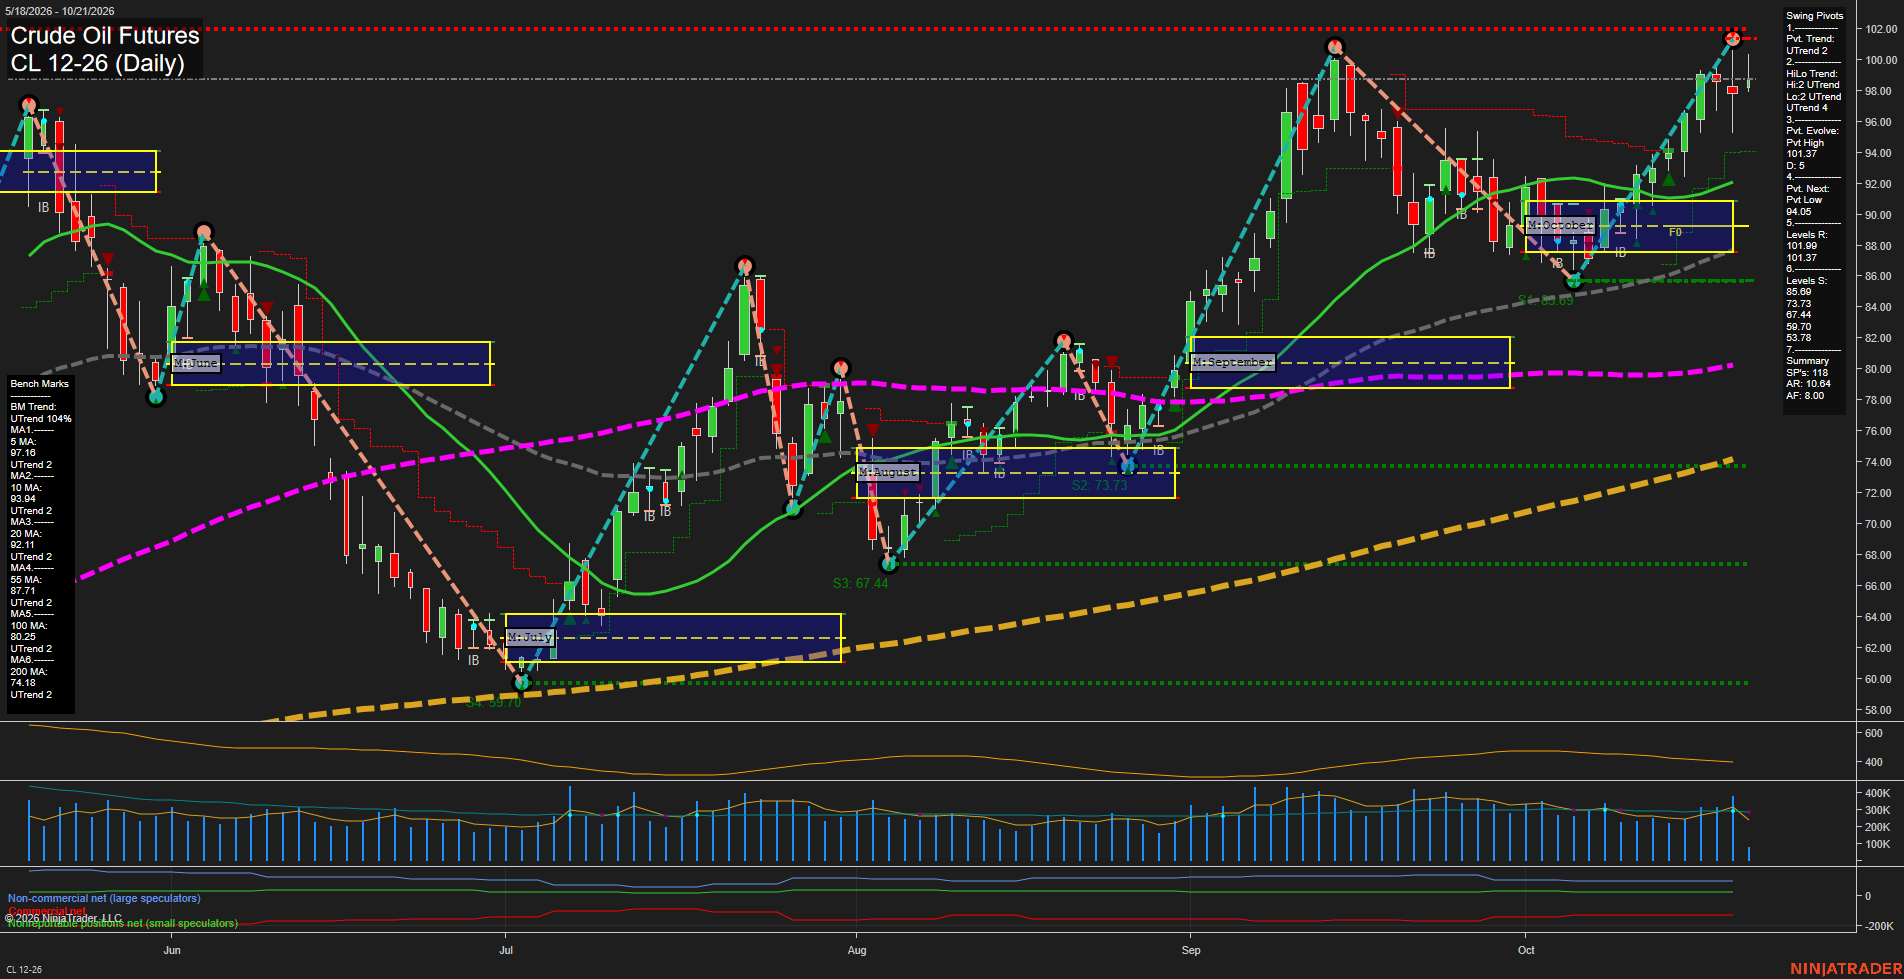
Overall Rating
- Short-Term: Bullish
- Intermediate-Term: Bullish
- Long-Term: Bullish.
Key Insights Summary
Price remains in a broad bullish swing structure, supported by aligned rising 5-, 10-, 20-, 55-, 100-, and 200-day benchmarks and confirmed by UTrend readings in both pivot classifications. The market has retraced modestly from the 101.37 pivot high and is consolidating beneath that resistance, while the weekly fib-grid reading remains below its F0% level. This creates a short-cycle countertrend tone within a still-positive intermediate and long-term advance. Small recent bars and slowing momentum reflect compression after the sharp September-October rally; 94.05 is the key near-term pivot reversal reference, while 101.37 remains the primary overhead swing-high level.
View charts on: AlphaWebTrader HTF Charts
GC Daily View
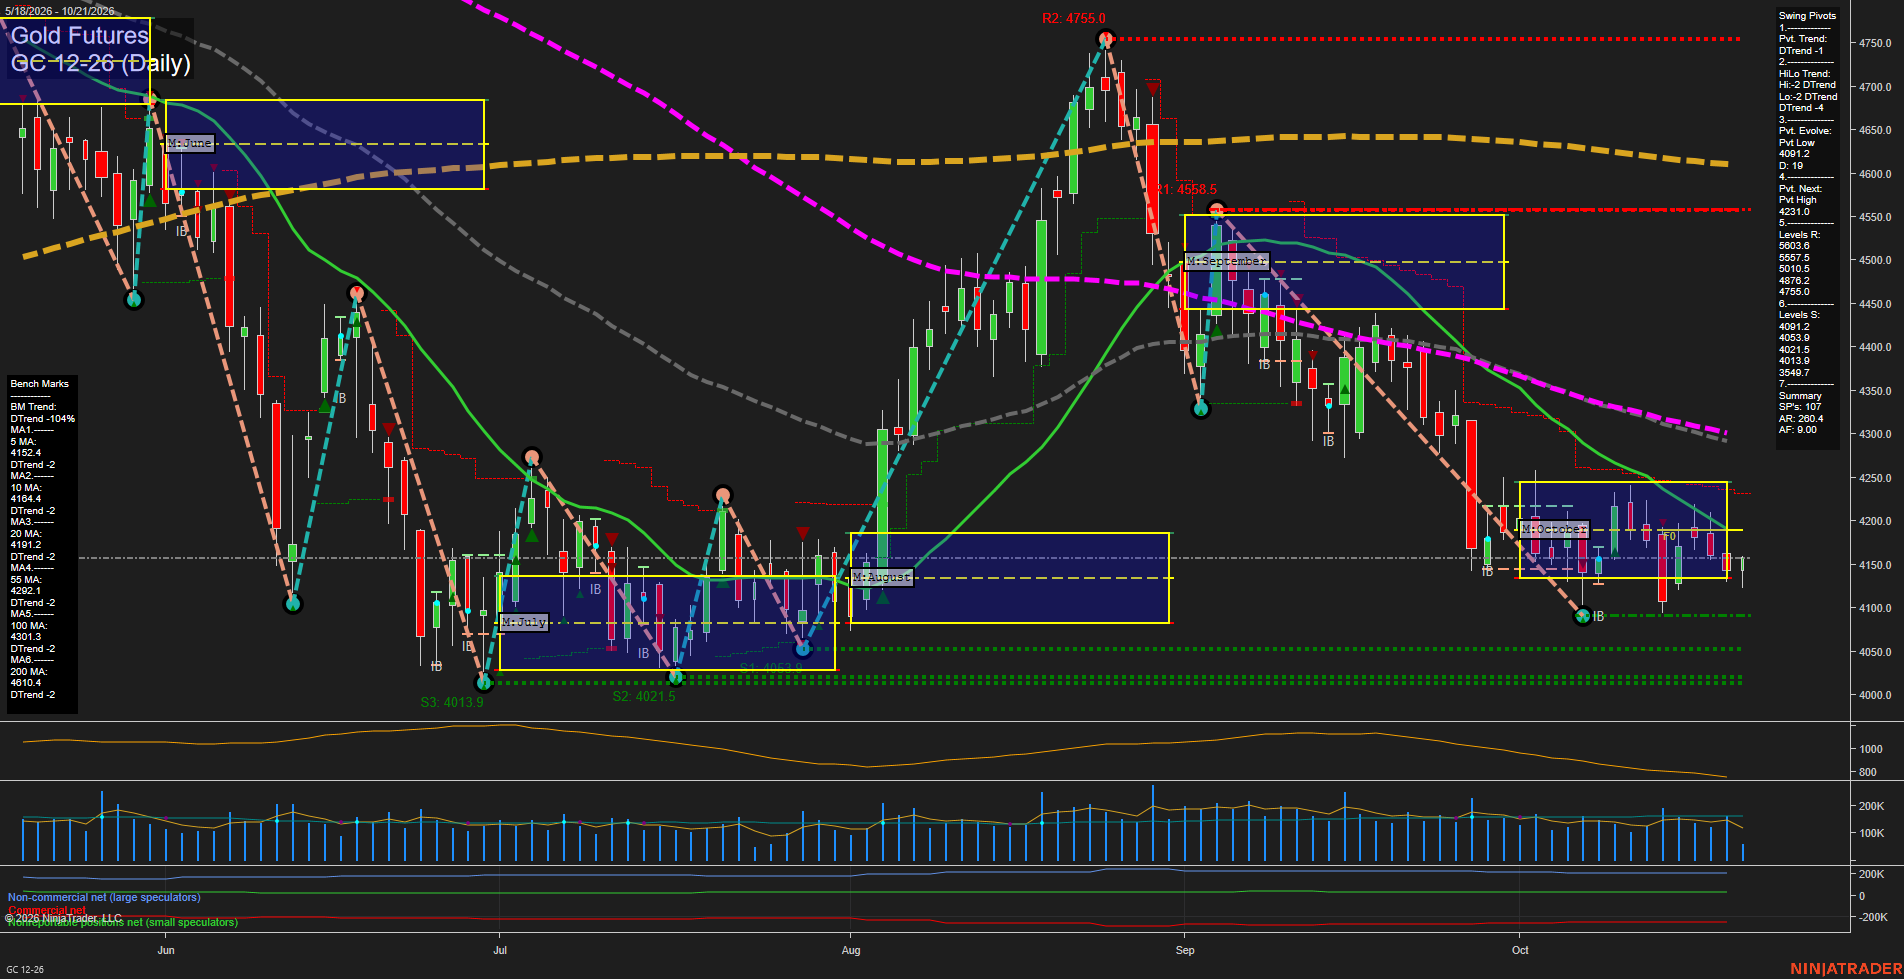
Overall Rating
- Short-Term: Bearish
- Intermediate-Term: Bearish
- Long-Term: Bearish.
Key Insights Summary
Price remains beneath the weekly, monthly, and yearly Fib-grid reference points, while all six daily benchmarks are declining and positioned above or near the market. The pivot structure remains in a DTrend, with the recent low at 4091.2 defining the immediate downside reference and 4231.0 defining the reversal threshold for a new short-term pivot high. Small daily bars and slow momentum reflect post-selloff consolidation near the October grid rather than a sustained recovery. The pattern retains lower-high characteristics beneath the 20-day and 55-day averages, while volatility remains elevated versus a typical quiet consolidation.
View charts on: AlphaWebTrader HTF Charts
ZB Daily View
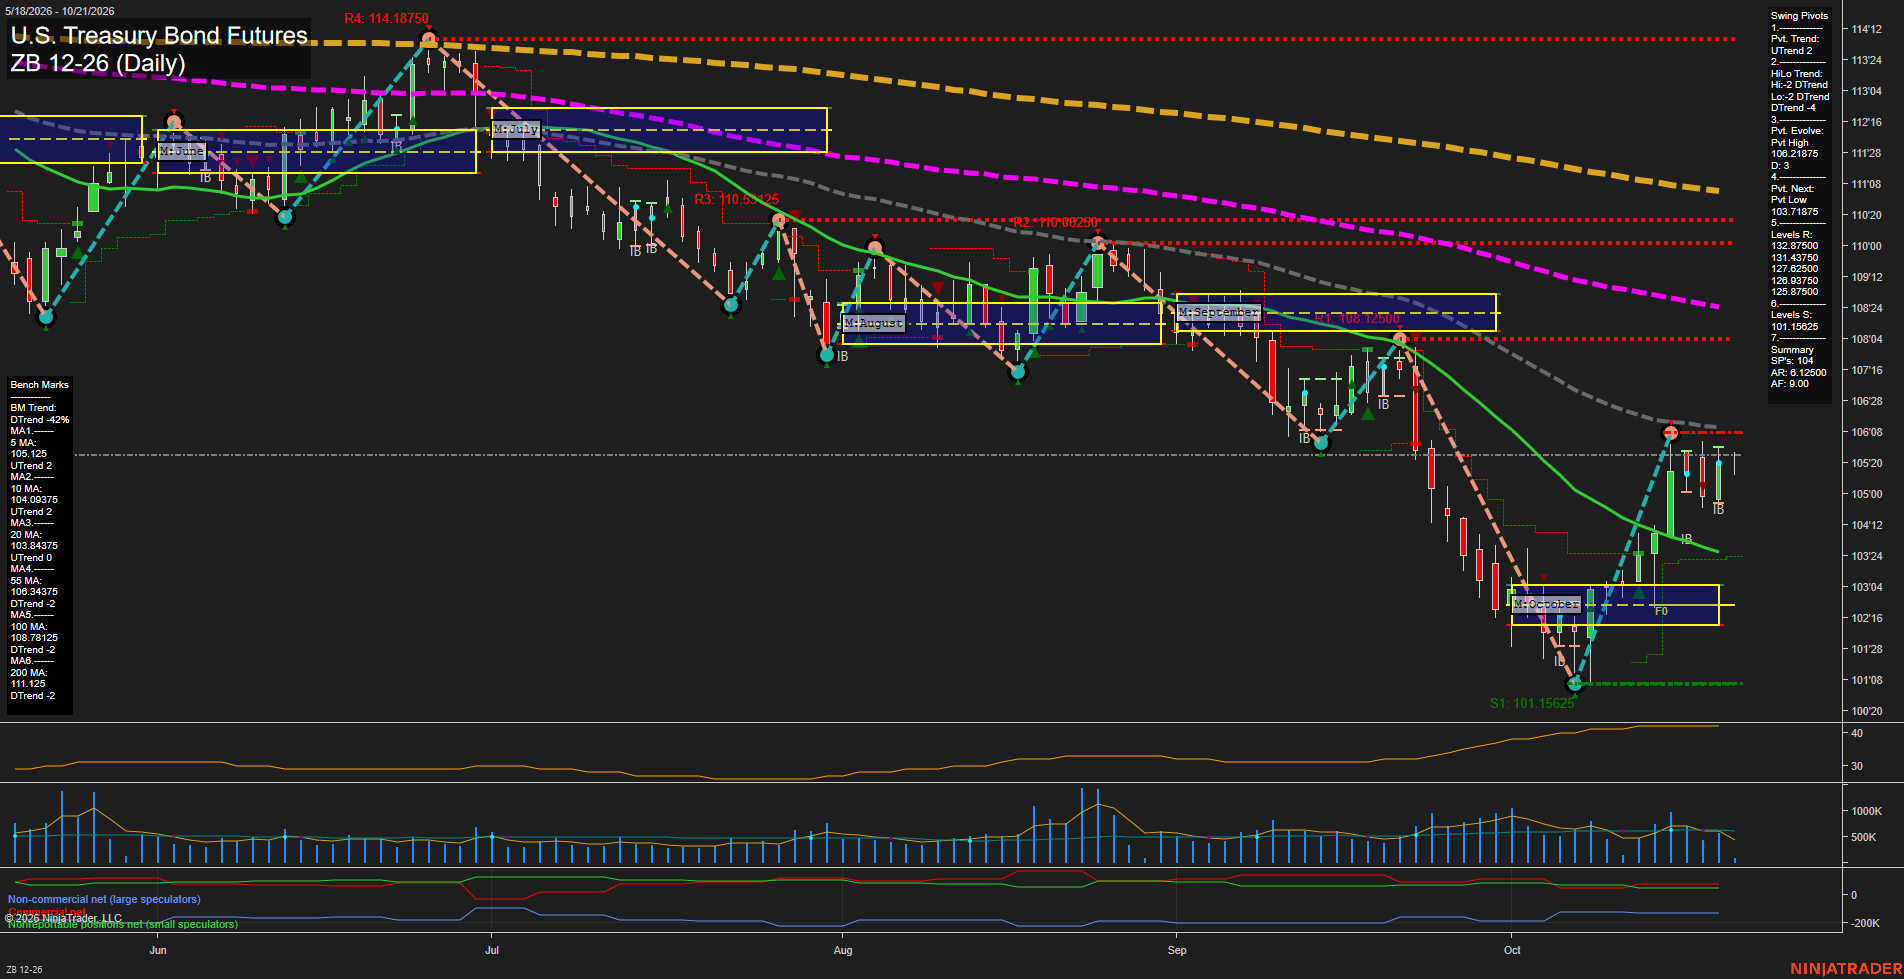
Overall Rating
- Short-Term: Bullish
- Intermediate-Term: Bearish
- Long-Term: Bearish.
Key Insights Summary
The market is sustaining a sharp short-term recovery from the early-October 101.15625 swing low, with price above the weekly and monthly F0% levels and above the rising 5-, 10-, and 20-day benchmarks. The pivot structure remains short-term upward, although the broader HiLo structure is still downward and price remains beneath the declining 55-, 100-, and 200-day averages. Recent small bars near 105.625 reflect consolidation after the rapid rebound and beneath the 106.3 evolving pivot high. This creates a counter-trend rally character within the longer-term decline, while the 103.1875 pivot-next level defines the nearby structural reversal reference.
View charts on: AlphaWebTrader HTF Charts