U.S. index futures face pressure from AI and chip stocks as traders assess key technical levels, oil above $107 and upcoming earnings and economic data.
Fundamentals: U.S. index futures faced renewed pressure as AI and semiconductor shares declined ahead of major technology earnings. WTI crude topped $107 amid Middle East supply concerns, adding to inflation risks. Treasury yields edged lower ahead of housing and employment data, while reported Nvidia chip orders exceeding $35 billion offered a contrasting signal on technology demand.
Technicals: U.S. index futures show mixed technical conditions ahead of the NYSE session, with ES and NQ in corrective phases, YM showing relative strength, and EMD and RTY retaining bearish daily structures. This market radar reviews weekly and daily trends, key support and resistance levels across major index futures, including FDAX, alongside prior-session stock and ETF movers.
Pre-Market Trading 360° view Market Radar of: holidays, earnings, eco-news, market-news summary, news sentiment, prior session major ETFs, MAG7, Higher Time Frame Analysis Indices Futures Summary, and E-mini S&P500, Nasdaq 100, NYMEX Crude, Gold Futures Daily Chart analysis.
As of: October 20, 2026 07:16 CT
Earnings Radar
Monitoring for earnings releases by the Magnificent 7, AI-tech-related firms, and major financial institutions.
- IBM Release: 2026-10-21 T:AMC
- META Release: 2026-10-21 T:AMC
- TSLA Release: 2026-10-21 T:AMC
- SPCX Release: 2026-10-20 T:AMC
Conclusion: SPCX reports after market close today (Oct. 20); META, TSLA, and IBM report after market close Oct. 21, concentrating major-tech and MAG7 earnings relevant to broad-index futures. Market momentum and volume can slow ahead of major earnings releases, especially MAG7 and related tech names.
For full details visit: Yahoo Earnings Calendar
EcoNews Radar U.S. Events
| Day | Time | Impact | Event |
|---|---|---|---|
| Wed | 10:30 | Low | Crude Oil Inventories |
| Thu | 08:30 | Medium | Unemployment Claims |
| Fri | 09:45 | Medium | Flash Manufacturing PMI |
| Fri | 09:45 | Medium | Flash Services PMI |
| Fri | 10:00 | Medium | Revised UoM Consumer Sentiment |
| Fri | 10:00 | Medium | Revised UoM Inflation Expectations |
EcoNews Summary
No qualifying high-impact EcoNews events are listed. The medium-impact releases do not relate directly to oil or petroleum supply and are excluded. Wednesday’s crude oil inventories release is classified as low impact and is also excluded.
Event Notes:
- No listed events meet the specified inclusion criteria.
Conclusion:
No single most important qualifying event or day is identified for the week because none of the listed events meet the required impact criteria.
For full details visit: Forex Factory EcoNews
Market News Summary:
U.S. index futures face renewed technology-sector pressure ahead of earnings, alongside rising energy prices and pending economic data.
Primary Drivers & Risks:
- Primary Driver: Renewed AI and semiconductor selling
- Primary Risk: Energy inflation and earnings uncertainty
Tone:
Cautious, with renewed risk aversion outweighing the prior technology rebound.
Stock Market / ETFs / Indices:
Nasdaq futures slipped as chipmakers and AI infrastructure stocks declined in premarket trading, following a Nasdaq Composite rebound of more than 1%. A disappointing South Korean data-center IPO and shelved offerings renewed scrutiny of AI capital spending and debt. South Korea’s Kospi fell more than 4%, while Japan’s Nikkei 225 lost 1.6%. Heavyweight technology earnings remain in focus; reported Nvidia chip orders exceeding $35 billion from ByteDance, Alibaba and Tencent provide a contrasting demand signal.
Geopolitical:
Tensions between Iran and Western allies and persistent Middle East supply concerns remained central to energy-market pricing.
Oil / Energy:
WTI topped $107 and was on course for a ninth consecutive session of gains, with a monthly increase approaching 20%; Brent reached a five-month high. European natural-gas prices also rose, while soaring freight rates altered Asian refiners’ shipping arrangements. Recovering Gulf exports, prospects for additional Russian supply and IEA readiness for further reserve releases supplied counterweights to disruption concerns. Reserve-release timing rests with individual IEA members.
Gold / Metals:
Gold traded around $4,119 support and above its October low, while silver tested trendline resistance. Reports cited 94% December rate-hike odds as pressure on precious metals. Steelmakers gained on higher prices and tight supply as imports contracted.
Fed / Financials:
U.S. Treasury yields edged lower ahead of housing and employment data and next week’s rate decision. Eurozone government bond yields also eased. Elevated December hike pricing remained a separate policy concern despite the session’s decline in yields.
Macro / Other:
Housing starts and transactions remained broadly flat over three years, with mortgage rates above 7% and Goldman Sachs describing further deterioration in the housing outlook. Higher fuel and trucker-retention costs weighed on transport results, while agricultural pressures added food-price concerns. China’s offshore-trust tax was linked to weaker luxury spending in Asia.
Conclusion:
Renewed selling in AI-related shares and scrutiny of technology spending dominated the index-futures backdrop. Upcoming corporate earnings form the main company-level catalyst after the prior session’s rebound.
Higher oil prices and Middle East tensions added inflation and supply risks, while housing and employment releases remained pending. Lower Treasury yields and large reported Nvidia orders provided cross-currents to the cautious equity tone.
Market News Sentiment
Market News Articles: 63
- Neutral: 44.44%
- Negative: 41.27%
- Positive: 14.29%
Sentiment Summary: Across 63 market news articles, sentiment was 44% neutral, 41% negative, and 14% positive.
Conclusion: Neutral coverage was the largest share, with negative coverage close behind and positive coverage substantially lower.
GLD,Gold Articles: 14
- Positive: 42.86%
- Neutral: 35.71%
- Negative: 21.43%
Sentiment Summary: Across 14 GLD/Gold articles, sentiment was 43% positive, 36% neutral, and 21% negative.
Conclusion: Positive sentiment was the largest category, but the snapshot contains no direct sentiment data for indices futures.
USO,Oil Articles: 14
- Negative: 50.00%
- Positive: 28.57%
- Neutral: 21.43%
Sentiment Summary: Across 14 USO and oil articles, sentiment was 50% negative, 29% positive, and 21% neutral.
Conclusion: Negative sentiment led oil-related coverage; the snapshot contains no direct indices futures sentiment data.
Daily Market Data Snapshot
ETF Snapshot of major stock market ETFs, Mag7, and others as of: October 20, 2026 07:16
Top Movers & Losers
- USO 161.76 Bullish 2.83% ▲
- AAPL 343.46 Bullish 0.43% ▲
- TLT 80.05 Bullish 0.10% ▲
- TSLA 354.72 Bearish -2.13% ▼
- QQQ 709.80 Bearish -2.50% ▼
- META 709.33 Bearish -3.72% ▼
Major Index ETFs: SPY, QQQ, DIA, IWM, IJH
- DIA 519.10 Bearish -0.40% ▼
- IJH 72.35 Bearish -0.93% ▼
- SPY 763.25 Bearish -1.11% ▼
- IWM 270.44 Bearish -1.69% ▼
- QQQ 709.80 Bearish -2.50% ▼
Bearish across all five index ETFs. QQQ was the most bearish mover at -2.50%, followed by IWM at -1.69%, SPY at -1.11%, and IJH at -0.93%. DIA was the least negative mover at -0.40%.
Mag 7 Stocks: AAPL, MSFT, GOOG, AMZN, META, NVDA, TSLA
- AAPL 343.46 Bullish 0.43% ▲
- NVDA 214.13 Bearish -1.43% ▼
- AMZN 250.00 Bearish -1.87% ▼
- MSFT 529.05 Bearish -1.93% ▼
- TSLA 354.72 Bearish -2.13% ▼
- META 709.33 Bearish -3.72% ▼
Mixed, predominantly Bearish: AAPL was the most Bullish mover at +0.43%, while META was the most Bearish mover at -3.72%. Other Bearish close-to-close moves were TSLA -2.13%, MSFT -1.93%, AMZN -1.87%, and NVDA -1.43%.
Cross-Market ETFs: TLT, GLD, USO, IBIT
- USO 161.76 Bullish 2.83% ▲
- TLT 80.05 Bullish 0.10% ▲
- GLD 382.01 Bearish -0.18% ▼
- IBIT 46.15 Bearish -0.94% ▼
Mixed: USO was the most Bullish mover at +2.83%, while IBIT was the most Bearish at -0.94%. TLT was near-flat, marginally Bullish at +0.10%; GLD was Bearish at -0.18%. All moves reflect daily close-to-close changes.
ETF, Mag7, and Cross-Market ETF Insights
Overall Tone
Bearish equities contrasted with Mixed cross-market ETFs, with USO the most bullish mover at +2.83% and META the most bearish at -3.72%.
Equity ETFs and Mag7:
Major Index ETFs were broadly Bearish: QQQ led declines at -2.50%, followed by IWM at -1.69%, SPY at -1.11%, and IJH at -0.93%; DIA was the least negative mover at -0.40%. Mag7 was predominantly Bearish: META led losses at -3.72%, followed by TSLA at -2.13%, MSFT at -1.93%, AMZN at -1.87%, and NVDA at -1.43%, while AAPL was the most bullish mover at +0.43%.
Cross-Market ETFs:
Cross-market ETFs were Mixed: USO was the most bullish mover at +2.83%, diverging from equity declines, while TLT was near-flat at +0.10%. IBIT was the most bearish mover at -0.94%, aligned with equity declines, while GLD slipped -0.18%.
Futures Indices – Higher Time Frame Analysis
Summary of the current state of US Indices Futures based on higher time-frame (HTF) technical analysis as of: 2026-10-20: 07:17 CT.
US Indices Futures
- ES YSFG upward, MSFG below F0%, daily below 5–55 benchmarks, weekly pivot-high developing, support 7657–7676, pivot reference 7589.75, resistance 7824–7950.25.
- NQ YSFG upward, MSFG below F0%, WSFG above F0%, daily below 5–100 benchmarks, pivot DTrend, support 29053–29262, reversal 30197, resistance 31375.50–31616.50.
- YM above YSFG/MSFG/WSFG references, daily above rising 5–20 benchmarks, weekly pivot down/daily up, support 50859, resistance 52835–52888, reversal 53199.
- EMD YSFG upward, MSFG below F0%, WSFG midpoint consolidation, daily below all benchmarks, pivot/HiLo DTrend, support 3600.3–3609.1, resistance 3737.8, weekly high 3969.6.
- RTY YSFG upward, MSFG below F0%, WSFG above F0%, daily below all benchmarks, bearish pivots, support 2723.3, resistance 2761–2822, reversal 2803.5.
- FDAX YSFG/MSFG above F0%, WSFG below F0%, weekly below 5–20 benchmarks, short-term pivot DTrend, support 24897–25170, 200-day benchmark 25273, resistance 25748–25827.
Overall State
- Short-Term: Bearish
- Intermediate-Term: Bearish
- Long-Term: Bullish
Conclusion
Short-term downside alignment spans ES, NQ, EMD, RTY, and FDAX; YM diverges with an upward daily pivot structure and price above rising 5–20-day benchmarks. MSFG weakness in ES, NQ, EMD, and RTY contrasts with YM and FDAX holding above monthly references. WSFG positioning is mixed, including stabilization above F0% in NQ and RTY versus FDAX below F0%. EMD and RTY lag structurally, with daily price below every benchmark and bearish daily long-term ratings. Weekly YSFG structures and rising longer-term benchmarks retain the broader bullish context, although daily long-term readings range from bullish to bearish. Recent ES short signals and widespread pivot DTrends characterize the correction; the listed swing supports and overhead pivot resistance define its HTF boundaries.
Note: Intra-day counter-trend pullbacks or retracements may occur, HTF is context for informational usage and market structure. Glossary: Session Fib Grids periods of YSFG:’Yearly’, MSFG:’Monthly’, WSFG:’Weekly’
For full details visit: AlphaWebTrader Technicals
ES Daily View
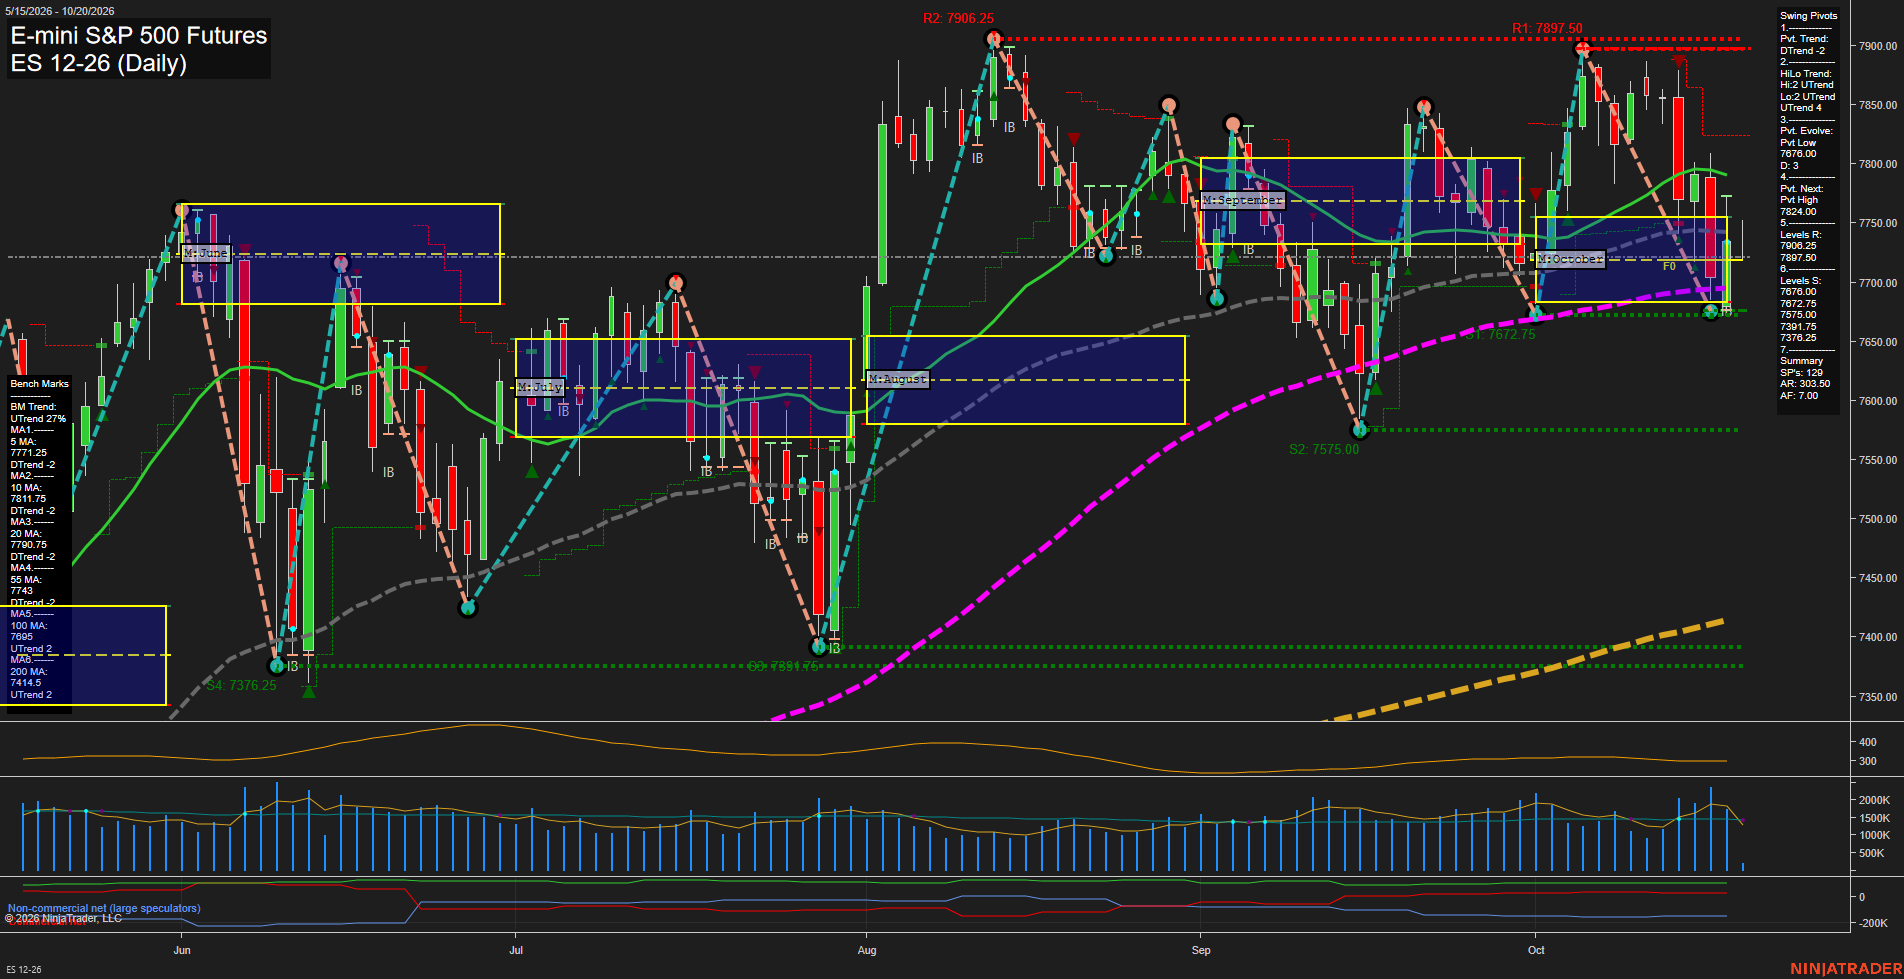
Overall Rating
- Short-Term: Bearish
- Intermediate-Term: Bearish
- Long-Term: Bullish.
Key Insights Summary
The daily structure reflects a short-term corrective downswing within a still constructive long-term advance. Price is below the 5, 10, 20, and 55-day benchmarks, while the pivot trend is DTrend and October MSFG remains below its F0% reference. The 7676 to 7657 support cluster has contained the latest selloff, producing a modest bounce, but momentum remains slow and price is still beneath nearby benchmark resistance. The intermediate HiLo trend remains positive and price holds above rising 100-day and 200-day averages, preserving the broader bullish structure. The current pattern is a volatile consolidation between support near 7676 and overhead pivot resistance at 7824, with major resistance concentrated near 7897.50 to 7906.25.
View charts on: AlphaWebTrader HTF Charts
NQ Daily View
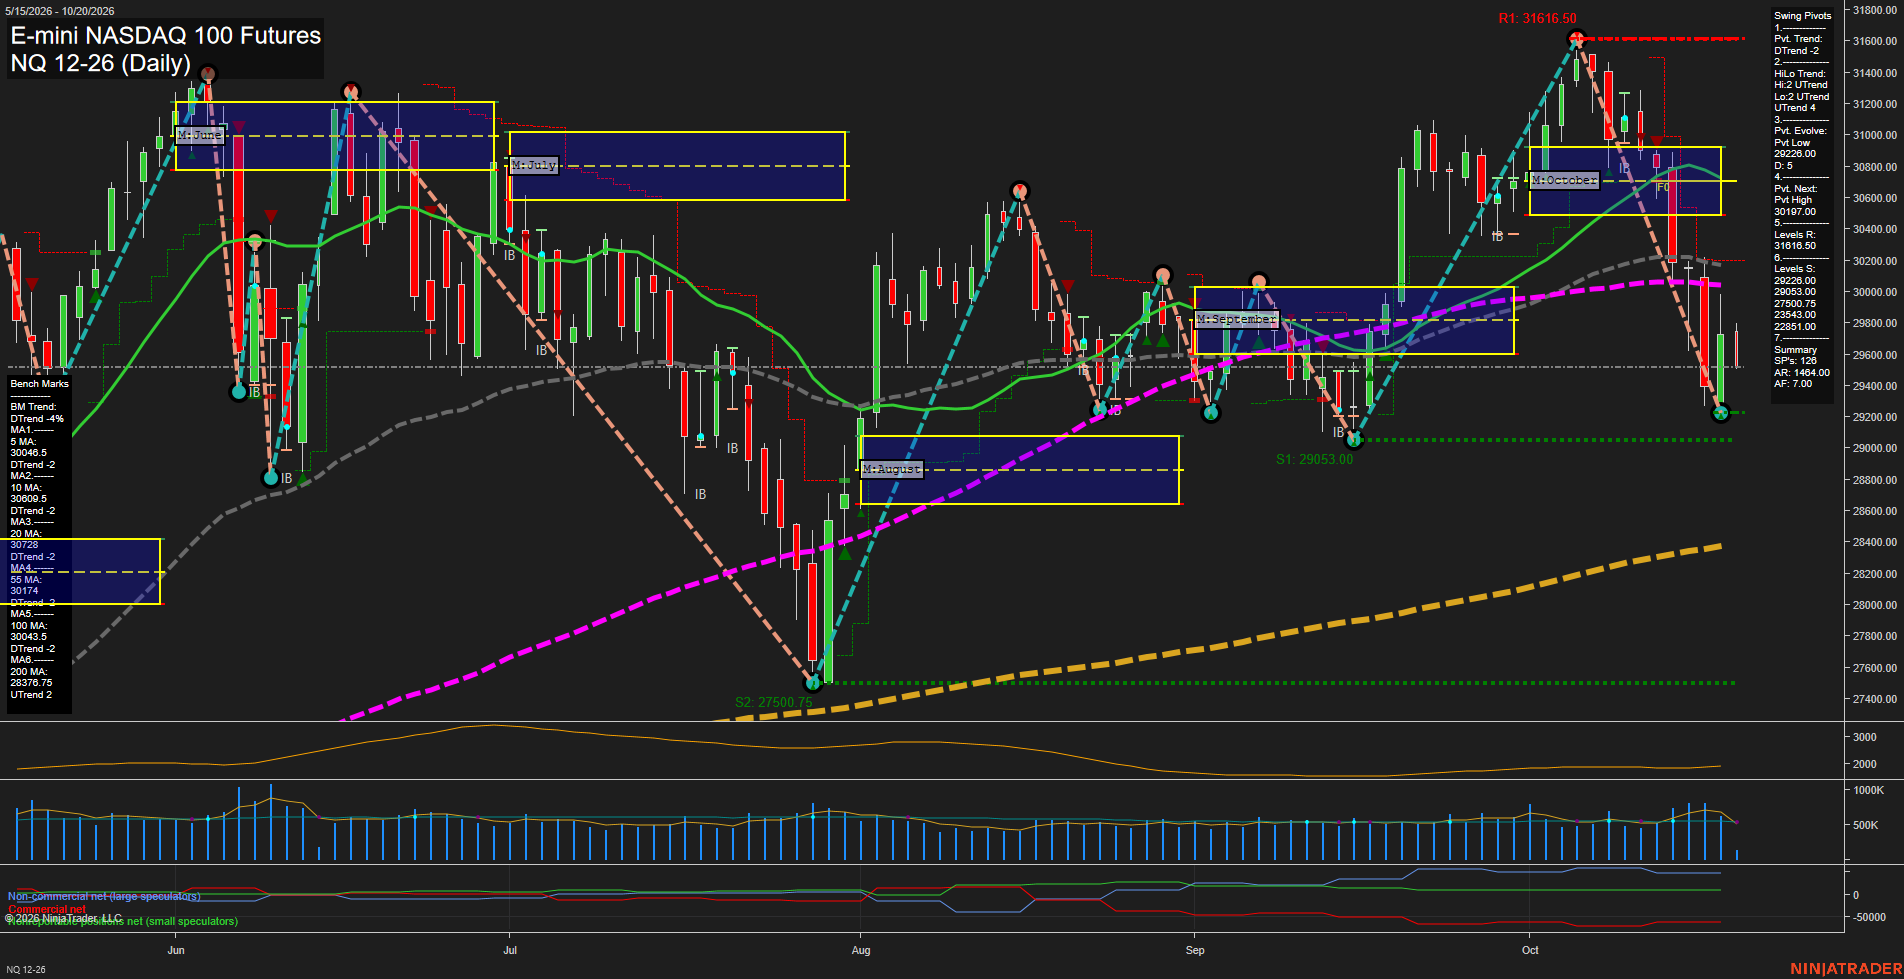
Overall Rating
- Short-Term: Bearish
- Intermediate-Term: Bearish
- Long-Term: Neutral.
Key Insights Summary
Price is rebounding from the 29226-29053 support zone after a sharp October decline, but the daily swing structure remains in a short-term DTrend and price remains beneath all benchmark averages from the 5-day through 100-day. The monthly grid remains below F0% and the clustered 30043-30728 moving-average area defines overhead countertrend resistance, with 30197 the next pivot reversal level. The broader yearly structure and rising 200-day average remain constructive, creating a mixed long-term backdrop while the current daily cycle is a volatile pullback from the 31616.50 swing high.
View charts on: AlphaWebTrader HTF Charts
CL Daily View
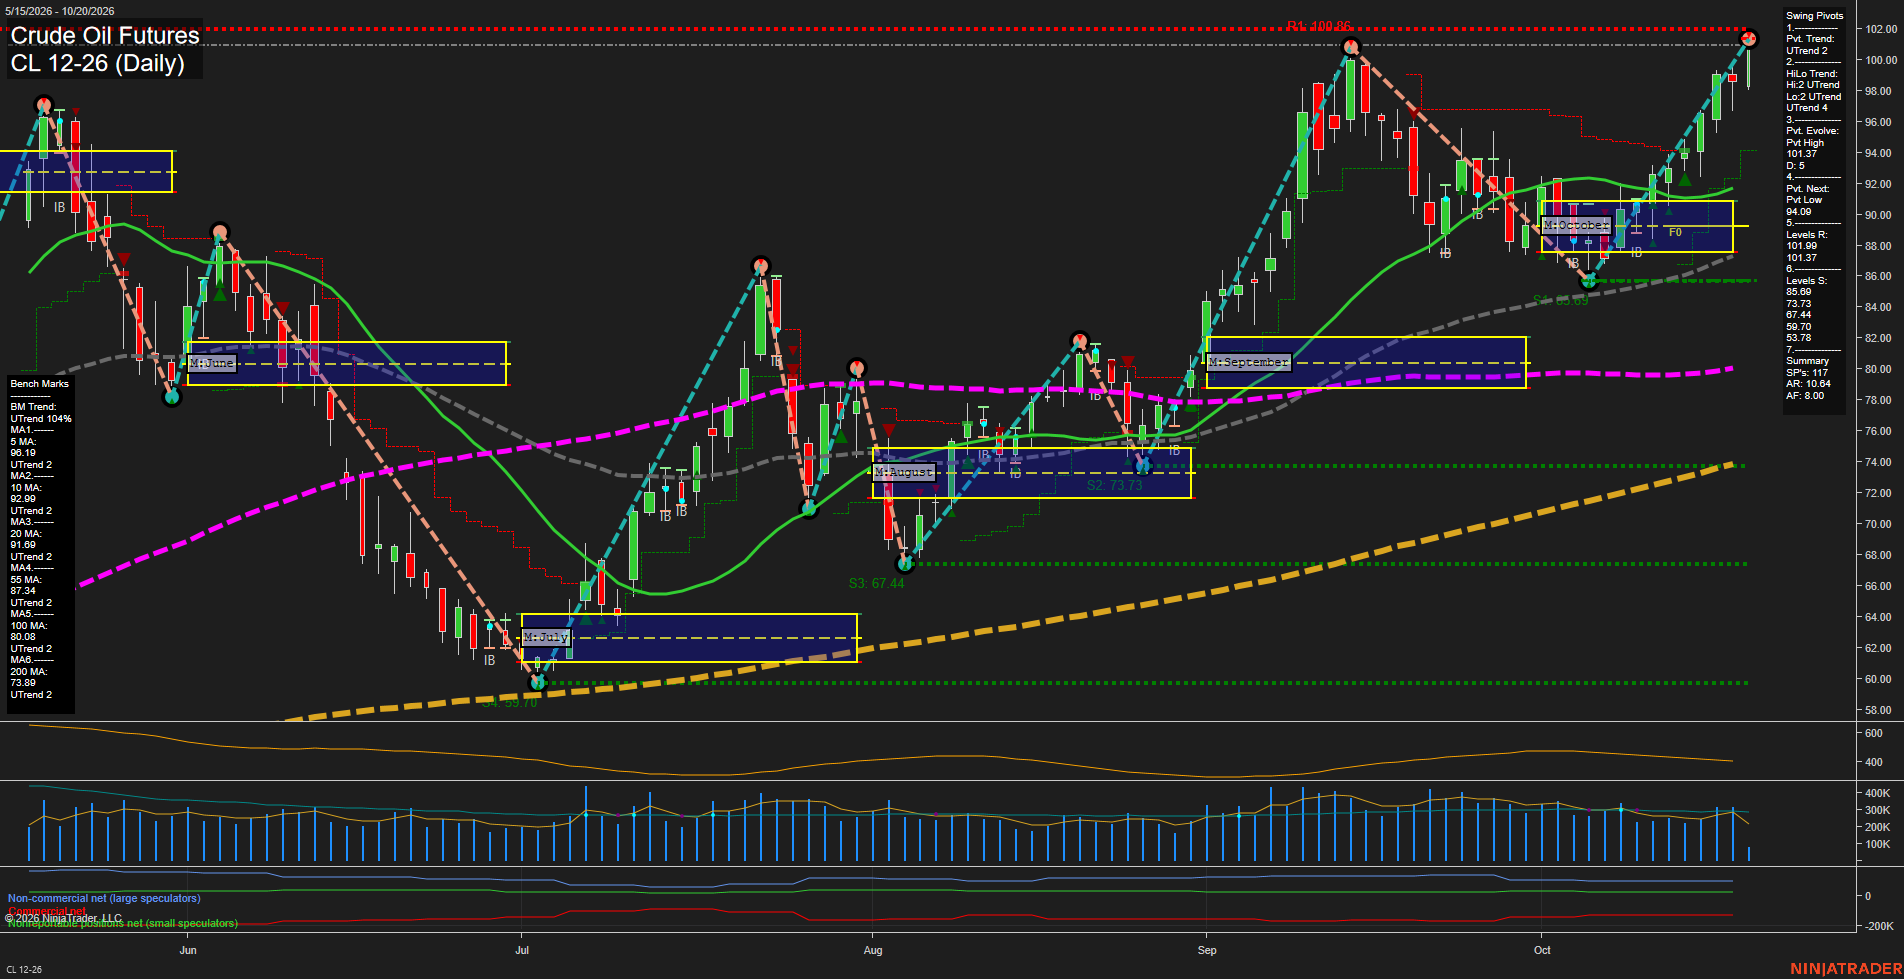
Overall Rating
- Short-Term: Bullish
- Intermediate-Term: Bullish
- Long-Term: Bullish.
Key Insights Summary
Price is in a broad multi-month advance, with higher pivot lows and a renewed push into the 100.86 to 101.37 resistance zone. Momentum is fast following the October recovery from the 85.69 support area, while price remains above every daily benchmark from the 5-day through 200-day average. The short-term pivot structure is bullish, though the active pivot-high area defines the immediate overhead test. Weekly, monthly, and yearly Fib-grid readings are all above their F0%/NTZ reference areas, aligning the short-, intermediate-, and long-term trend structure to the upside.
View charts on: AlphaWebTrader HTF Charts
GC Daily View
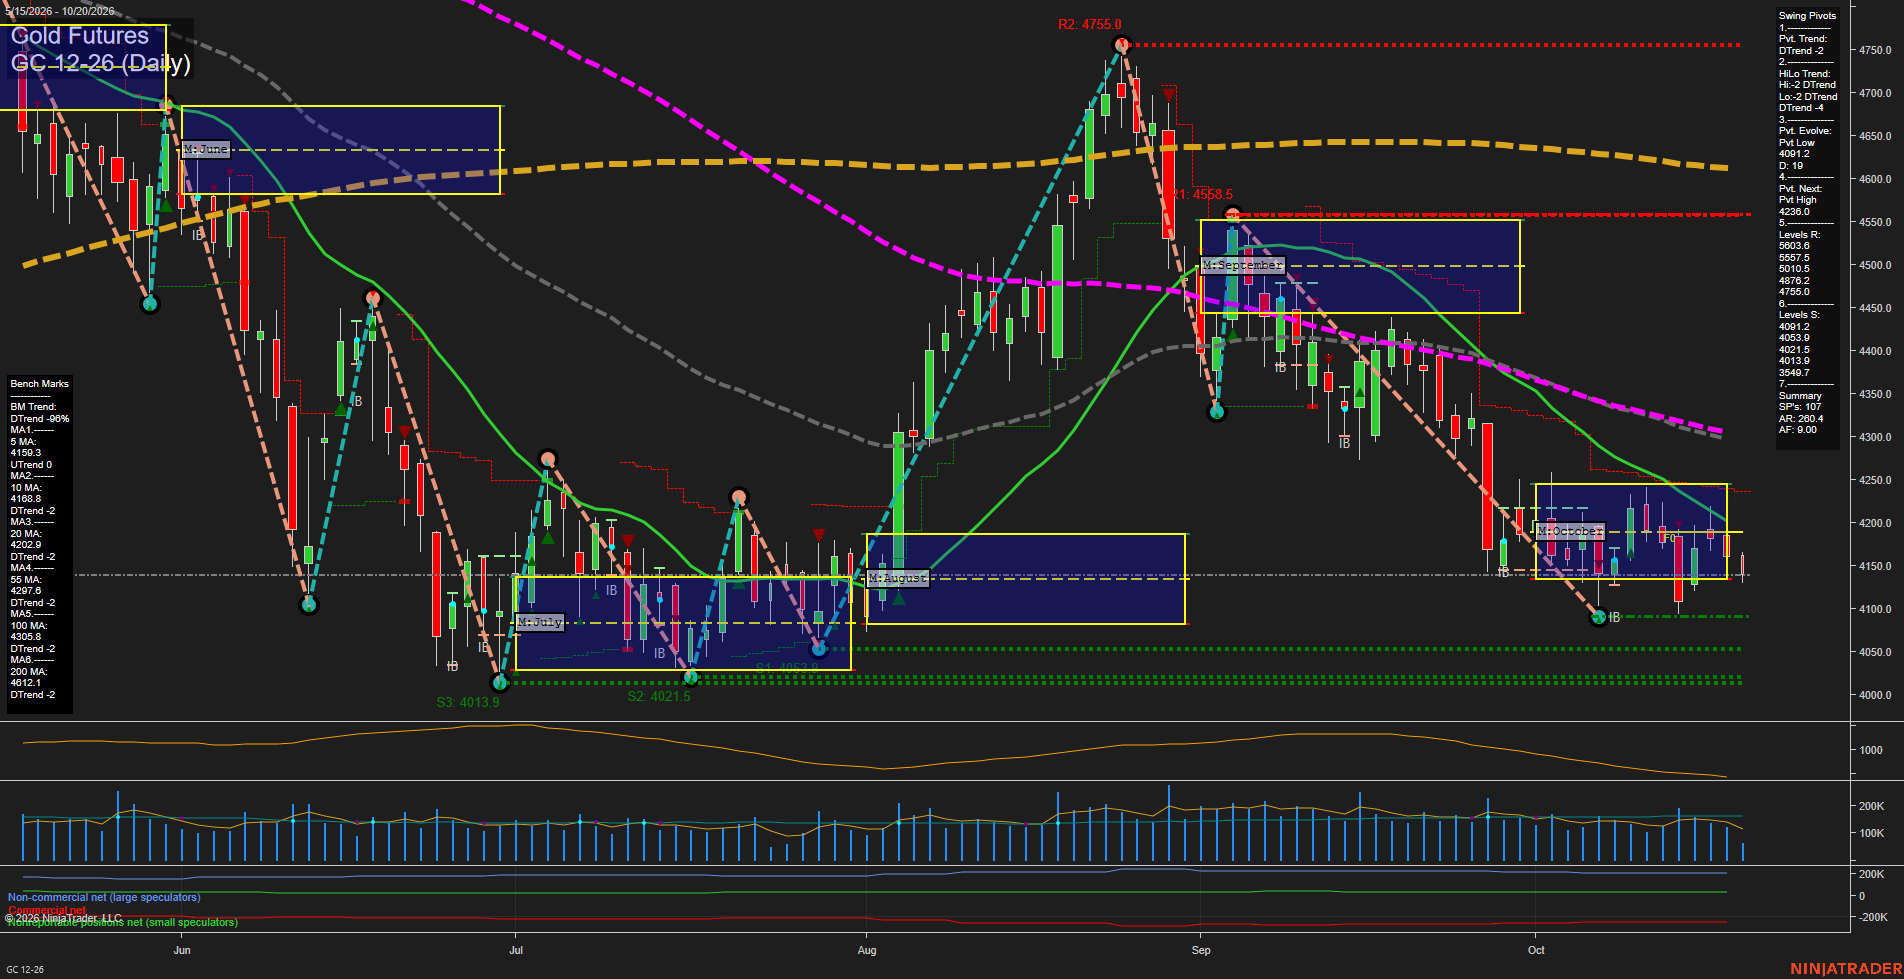
Overall Rating
- Short-Term: Bearish
- Intermediate-Term: Bearish
- Long-Term: Bearish.
Key Insights Summary
GC is in a broad daily-chart decline, with price beneath the weekly, monthly, and yearly Fib-grid centers and below every benchmark moving average except for a marginally rising 5-day average. The pivot structure remains bearish, defined by lower highs and lower lows from the late-August peak, while the current October consolidation is holding above the 4091.2 pivot low. The 4138 area is below the 5-, 10-, and 20-day averages, reinforcing weak short-term participation. A move through the evolving 4091.2 low would extend the established downside sequence toward clustered supports at 4053.9 to 4013.9, while 4236.0 is the next pivot-reversal reference and initial structural resistance. ATR remains elevated, reflecting a volatile correction/consolidation phase following the sharp September selloff.
View charts on: AlphaWebTrader HTF Charts
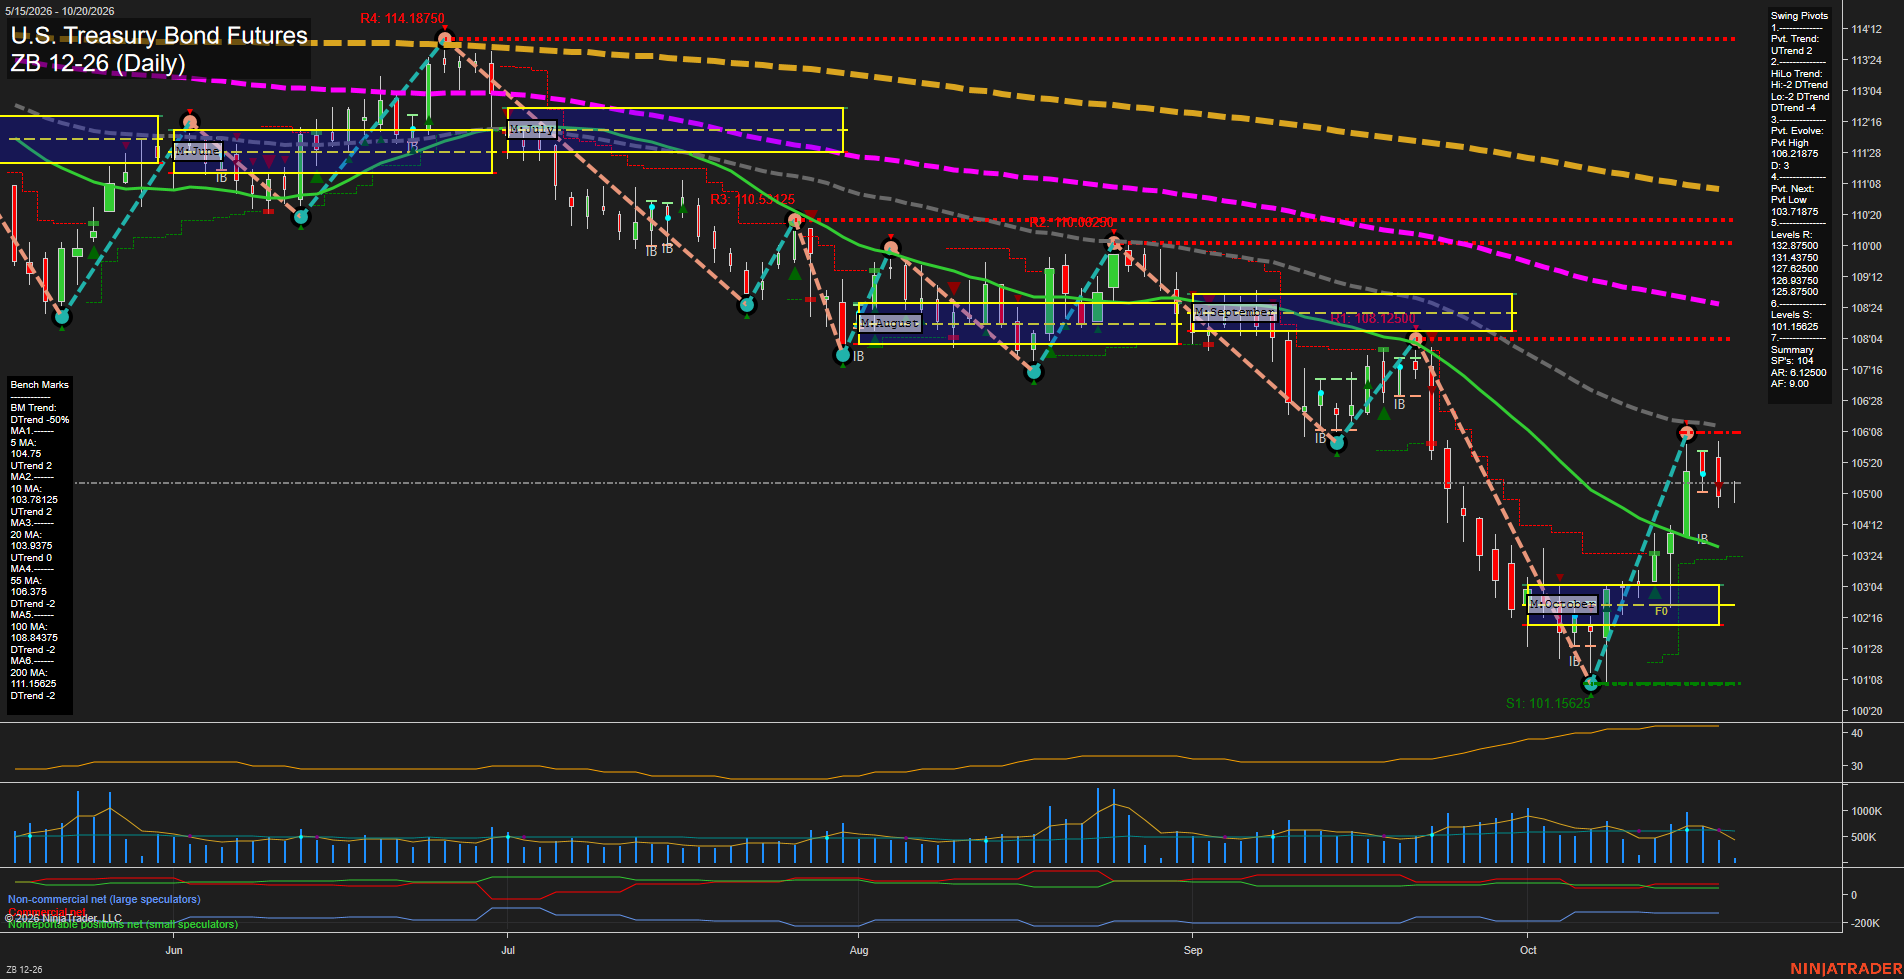
ZB Daily View
Overall Rating
- Short-Term: Bullish
- Intermediate-Term: Neutral
- Long-Term: Bearish.
Key Insights Summary
Price remains in a short-term recovery structure following the October washout near 101'05, supported by an UTrend pivot condition and rising 5, 10, and 20-day benchmarks. The rebound stalled beneath the 55-day benchmark and the 106'23 pivot high, producing a pullback from the recent recovery peak. Weekly fib positioning remains below its F0%/NTZ area, while the monthly grid remains constructive above its F0% level. The intermediate picture is mixed as the monthly trend is up but the HiLo pivot structure remains in a DTrend. Longer-term structure remains bearish, with price below the declining 55, 100, and 200-day benchmarks and the yearly grid below equilibrium. Volume is moderate relative to the recent rebound, while ATR near 35 reflects an active but contained daily swing environment.
View charts on: AlphaWebTrader HTF Charts