U.S. stocks fell as AI credit concerns hit technology shares, while hot inflation data and Middle East risks pushed crude higher above $100.
Fundamentals: U.S. equities closed sharply lower as AI-related credit concerns pressured chip, software and cybersecurity stocks, sending the Nasdaq down 2.37% and lifting the VIX above 22. September inflation data and rising oil prices added to rate concerns, while Iranian attacks in the Strait of Hormuz pushed crude above $100. Treasury yields later eased and gold held support near $4,000.
Technicals: The market roundup showed a bearish short-term tone in major growth and small-cap contracts after declines in QQQ, Meta and Google. ES and YM retained constructive intermediate- and long-term structures, while NQ, RTY and EMD remained under near-term pressure. FDAX recovered sharply, with pivot, Fibonacci-grid and moving-average levels highlighting uneven conditions across futures markets.
After Market Close daily snapshot: market news summary and sentiment, major ETFs, Magnificent 7 analysis, Indices Futures Higher Time Frame Analysis, and E-mini S&P500, Nasdaq 100, NYMEX Crude, Gold Futures Daily Chart analysis.
As of: October 16, 2026 05:00 CT
Market News Summary:
U.S. equities sold off sharply as AI and technology credit concerns collided with renewed inflation and Middle East energy risks.
Primary Drivers & Risks:
- Primary Driver: AI-led technology stock selloff
- Primary Risk: Inflation and oil-price shock
Tone:
Risk-off, with elevated cross-asset volatility.
Stock Market / ETFs / Indices:
The Nasdaq fell 2.37% and the S&P 500 declined more than 1% as chip, software, and cybersecurity shares sold off. AI-related credit concerns centered on CoreWeave and hyperscaler financing, while the SOXX correction reached 15%. The VIX moved above 22 for the first time in four months, and high-beta shares posted outsized losses.
Geopolitical:
Iranian attacks in the Strait of Hormuz intensified energy-supply concerns, while Ukraine pledged strikes on Russian refineries. China expanded controls over key AI technology exports, and Taiwan moved to criminalize unauthorized AI server and chip shipments to the mainland.
Oil / Energy:
U.S. crude rose above $100 and oil gained about 4% as traders focused on Middle East escalation and Hormuz disruption risk. Earlier reports had cited low oil prices after Houthi attacks on Saudi Arabia caused no supply interruption. The U.S. also solicited an exchange of up to 17 million barrels from the Strategic Petroleum Reserve.
Gold / Metals:
Gold found support near $4,000 as lower real yields aided buyers, but hotter inflation, rising Treasury yields, and a firmer dollar pressured prices. Gold faced resistance near $4,200 to $4,226, with upcoming U.S. housing, employment, and activity data in focus.
Fed / Financials:
September CPI rose 3.7% year over year, while producer prices recorded their largest increase since early 2022. Markets increasingly priced an October Fed rate hold. Treasury yields later declined despite hot CPI and PPI reports as buyers viewed prevailing yields as attractive; Bank of America also faced a Treasury fine exceeding $1.2 billion for anti-money-laundering and sanctions failures.
Macro / Other:
Inflation readings and higher oil prices intensified concern over price pressures. Energy Department funding included a $50 million grid-power investment tied to power-grid security.
Conclusion:
AI-sector deleveraging and broad technology weakness drove the equity decline. Inflation data and the Fed-rate outlook remained central for index futures sentiment.
Middle East escalation lifted crude prices and added an inflation cross-current. Falling Treasury yields and gold support reflected competing growth, inflation, and risk-aversion signals.
Market News Sentiment
Market News Articles: 38
- Neutral: 55.26%
- Negative: 34.21%
- Positive: 10.53%
Sentiment Summary: Market news tone is predominantly neutral (55%), with negative coverage (34%) exceeding positive coverage (11%).
Conclusion: Indices futures headlines show a neutral overall backdrop with a notable negative tilt in directional coverage.
GLD,Gold Articles: 11
- Neutral: 36.36%
- Positive: 36.36%
- Negative: 27.27%
Sentiment Summary: Gold-related coverage is balanced, with 36% positive, 36% neutral, and 27% negative sentiment across 11 articles.
Conclusion: The gold news flow presents mixed directional cues for indices futures day traders.
USO,Oil Articles: 9
- Negative: 55.56%
- Positive: 22.22%
- Neutral: 22.22%
Sentiment Summary: USO/oil coverage was predominantly negative (56%), with positive and neutral articles each at 22%.
Conclusion: Oil-related news tone is negative overall, which is relevant context for indices futures traders monitoring energy-sector sentiment.
Market Data Snapshot
ETF Snapshot of major stock market ETFs, Mag7, and others as of: October 16, 2026 05:00
Top Movers & Losers
- USO 161.76 Bullish 2.83% ▲
- AAPL 343.46 Bullish 0.43% ▲
- TLT 80.05 Bullish 0.10% ▲
- GOOG 336.91 Bearish -2.32% ▼
- QQQ 709.80 Bearish -2.50% ▼
- META 709.33 Bearish -3.72% ▼
Major Index ETFs: SPY, QQQ, DIA, IWM, IJH
- DIA 519.10 Bearish -0.40% ▼
- IJH 72.35 Bearish -0.93% ▼
- SPY 763.25 Bearish -1.11% ▼
- IWM 270.44 Bearish -1.69% ▼
- QQQ 709.80 Bearish -2.50% ▼
Major Index ETFs were uniformly Bearish. QQQ led losses at -2.50%, followed by IWM at -1.69%, SPY at -1.11%, and IJH at -0.93%. DIA was the least negative mover at -0.40%.
Mag 7 Stocks: AAPL, MSFT, GOOG, AMZN, META, NVDA, TSLA
- AAPL 343.46 Bullish 0.43% ▲
- NVDA 214.13 Bearish -1.43% ▼
- AMZN 250.00 Bearish -1.87% ▼
- MSFT 529.05 Bearish -1.93% ▼
- TSLA 354.72 Bearish -2.13% ▼
- GOOG 336.91 Bearish -2.32% ▼
- META 709.33 Bearish -3.72% ▼
Mag7 was Bearish overall: AAPL was the most bullish mover at +0.43%, while META led losses as the most bearish mover at -3.72%. GOOG declined -2.32%, TSLA -2.13%, MSFT -1.93%, AMZN -1.87%, and NVDA -1.43%.
Cross-Market ETFs: TLT, GLD, USO, IBIT
- USO 161.76 Bullish 2.83% ▲
- TLT 80.05 Bullish 0.10% ▲
- GLD 382.01 Bearish -0.18% ▼
- IBIT 46.15 Bearish -0.94% ▼
Mixed: USO is the most bullish mover at +2.83%, while TLT is marginally Bullish at +0.10%. IBIT is the most bearish mover at -0.94%, with GLD modestly Bearish at -0.18%.
ETF, Mag7, and Cross-Market ETF Insights
Overall Tone
Bearish overall, with broad equity weakness led by growth shares while oil strength and marginal TLT gains create a Mixed cross-market backdrop.
Equity ETFs and Mag7:
Major Index ETFs were broadly Bearish: QQQ fell -2.50%, IWM declined -1.69%, SPY lost -1.11%, IJH dropped -0.93%, and DIA was the least negative mover at -0.40%. Mag7 performance was selective but predominantly Bearish, with AAPL the only Bullish name at +0.43%; META was the most bearish mover at -3.72%, followed by GOOG at -2.32% and TSLA at -2.13%.
Cross-Market ETFs:
Cross-market ETFs were Mixed: USO was the most bullish mover at +2.83%, while TLT was marginally Bullish at +0.10%. GLD slipped -0.18%, while IBIT was the most bearish cross-market mover at -0.94%; oil strength diverged from broad equity and bitcoin ETF weakness.
Futures Indices – Higher Time Frame Analysis
Summary of the current state of US Indices Futures based on higher time-frame (HTF) technical analysis as of: 2026-10-16: 17:00 CT.
US Indices Futures
- ES: YSFG/MSFG bullish, WSFG below F0%, benchmarks broadly rising, pivot resistance 7906.25, support 7772.75, reversal threshold 7583.75.
- NQ: YSFG bullish, MSFG/WSFG below F0%, benchmarks mixed, pivot resistance 31616.50, support 29822.50, reversal reference 29424.00.
- YM: YSFG/MSFG/WSFG bullish, benchmarks rising, recovery above short-term averages, pivot resistance 55316, support 50859, near-term threshold 53221.
- EMD: YSFG/MSFG above F0%, WSFG bearish, price below short-term benchmarks, pivot resistance 3696.6, support 3600.3, lower support 3332.6.
- RTY: YSFG bullish, MSFG/WSFG below F0%, benchmarks weakened short-term, active pivot 2734.9, reversal threshold 2899.1, resistance 2871.1.
- FDAX: YSFG/MSFG/WSFG bullish, rising long-term benchmarks, recovery above short-term averages, pivot resistance 26847, support 24847, daily overhead 25817-25990.
Overall State
- Short-Term: Neutral
- Intermediate-Term: Neutral
- Long-Term: Bullish
Conclusion
Higher-timeframe structure remains bullish overall through yearly grids and rising long-term benchmarks. ES, YM, and FDAX retain stronger alignment, while NQ, EMD, and RTY remain in weekly or daily pullback structures. ES and NQ cluster beneath swing resistance; YM and FDAX show recovery momentum. EMD and RTY remain below short-term grid and benchmark references. Cross-index conditions are mixed short-term, neutral intermediate-term, and bullish long-term.
Note: Intra-day counter-trend pullbacks or retracements may occur, HTF is context for informational usage and market structure. Glossary: Session Fib Grids periods of YSFG:’Yearly’, MSFG:’Monthly’, WSFG:’Weekly’
For full details visit: AlphaWebTrader Technicals
ES Daily View
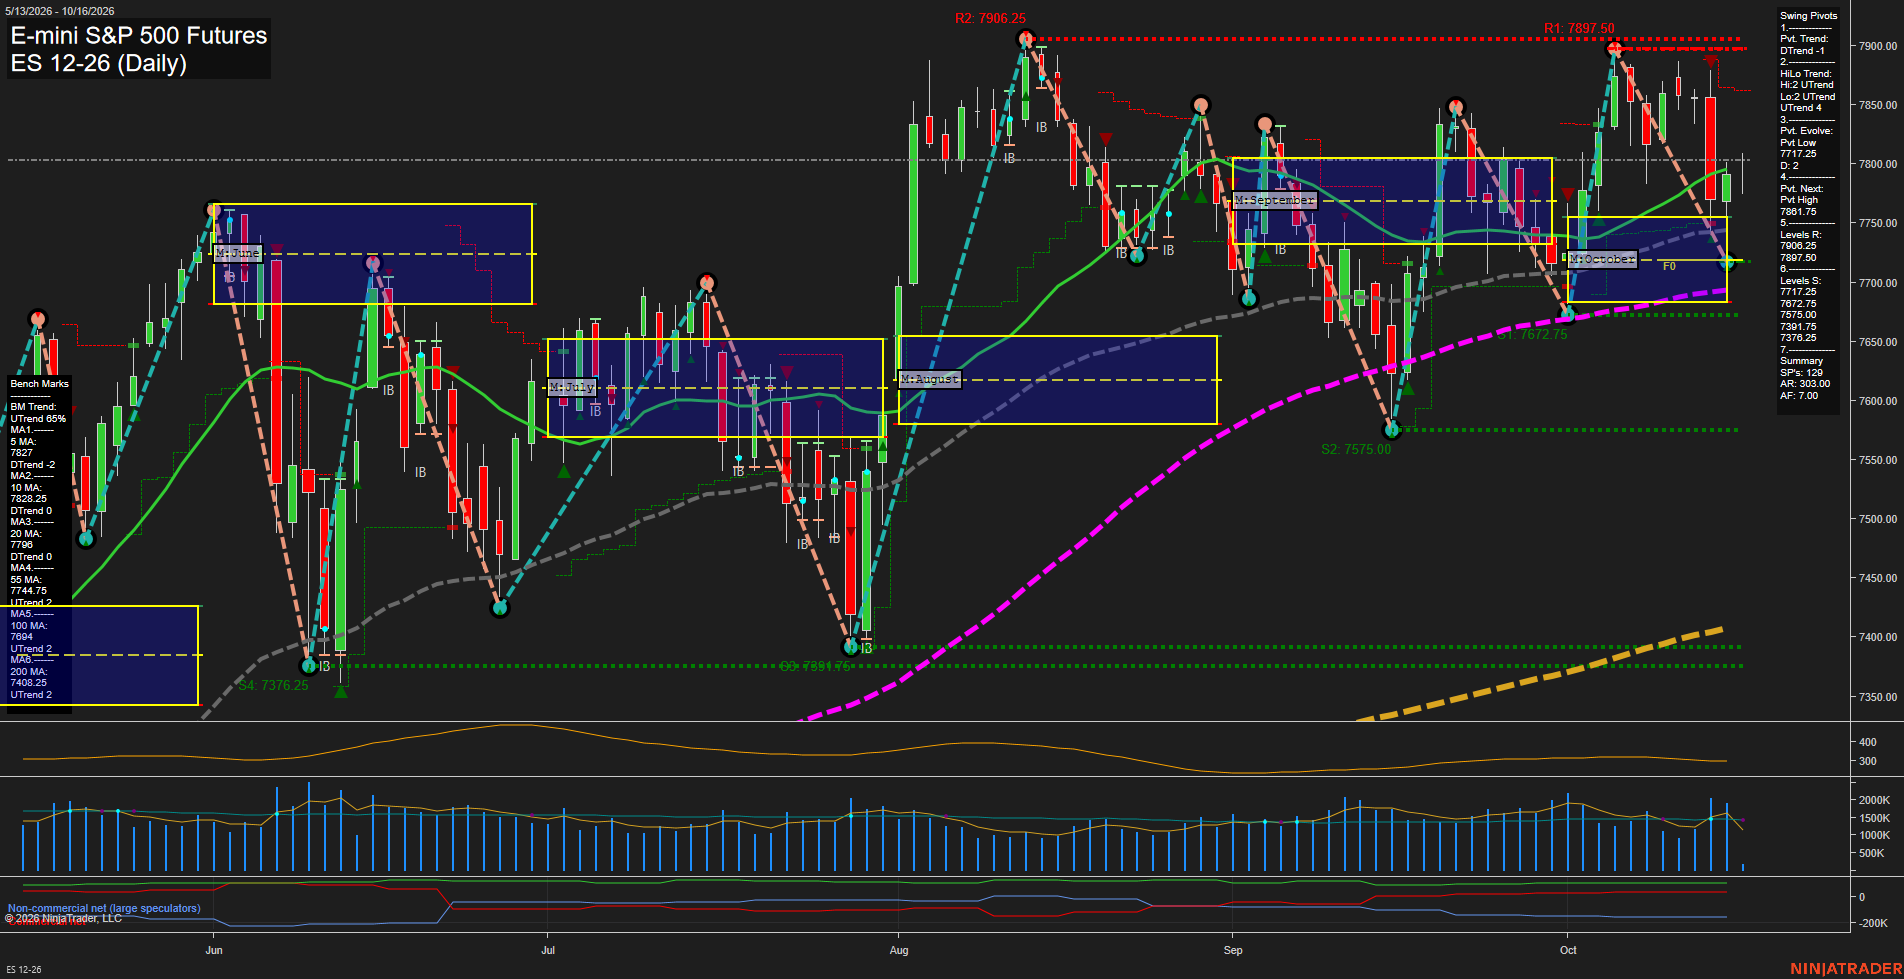
Overall Rating
- Short-Term: Bearish
- Intermediate-Term: Bullish
- Long-Term: Bullish.
Key Insights Summary
Price is consolidating beneath the 5-day and 10-day benchmarks after a rejection from the 7897.50 to 7906.25 resistance area. The short-term pivot structure remains in a DTrend and the weekly fib-grid position is below F0%, reflecting a countertrend pullback within a broader advancing structure. Intermediate and long-term conditions remain constructive: price is above the rising 20-day, 55-day, 100-day, and 200-day averages, while the monthly and yearly fib grids remain positive. The 7772.75 pivot-low area is the nearest structural support, with 7831.75 defining the next pivot-high reversal threshold.
View charts on: AlphaWebTrader HTF Charts
NQ Daily View
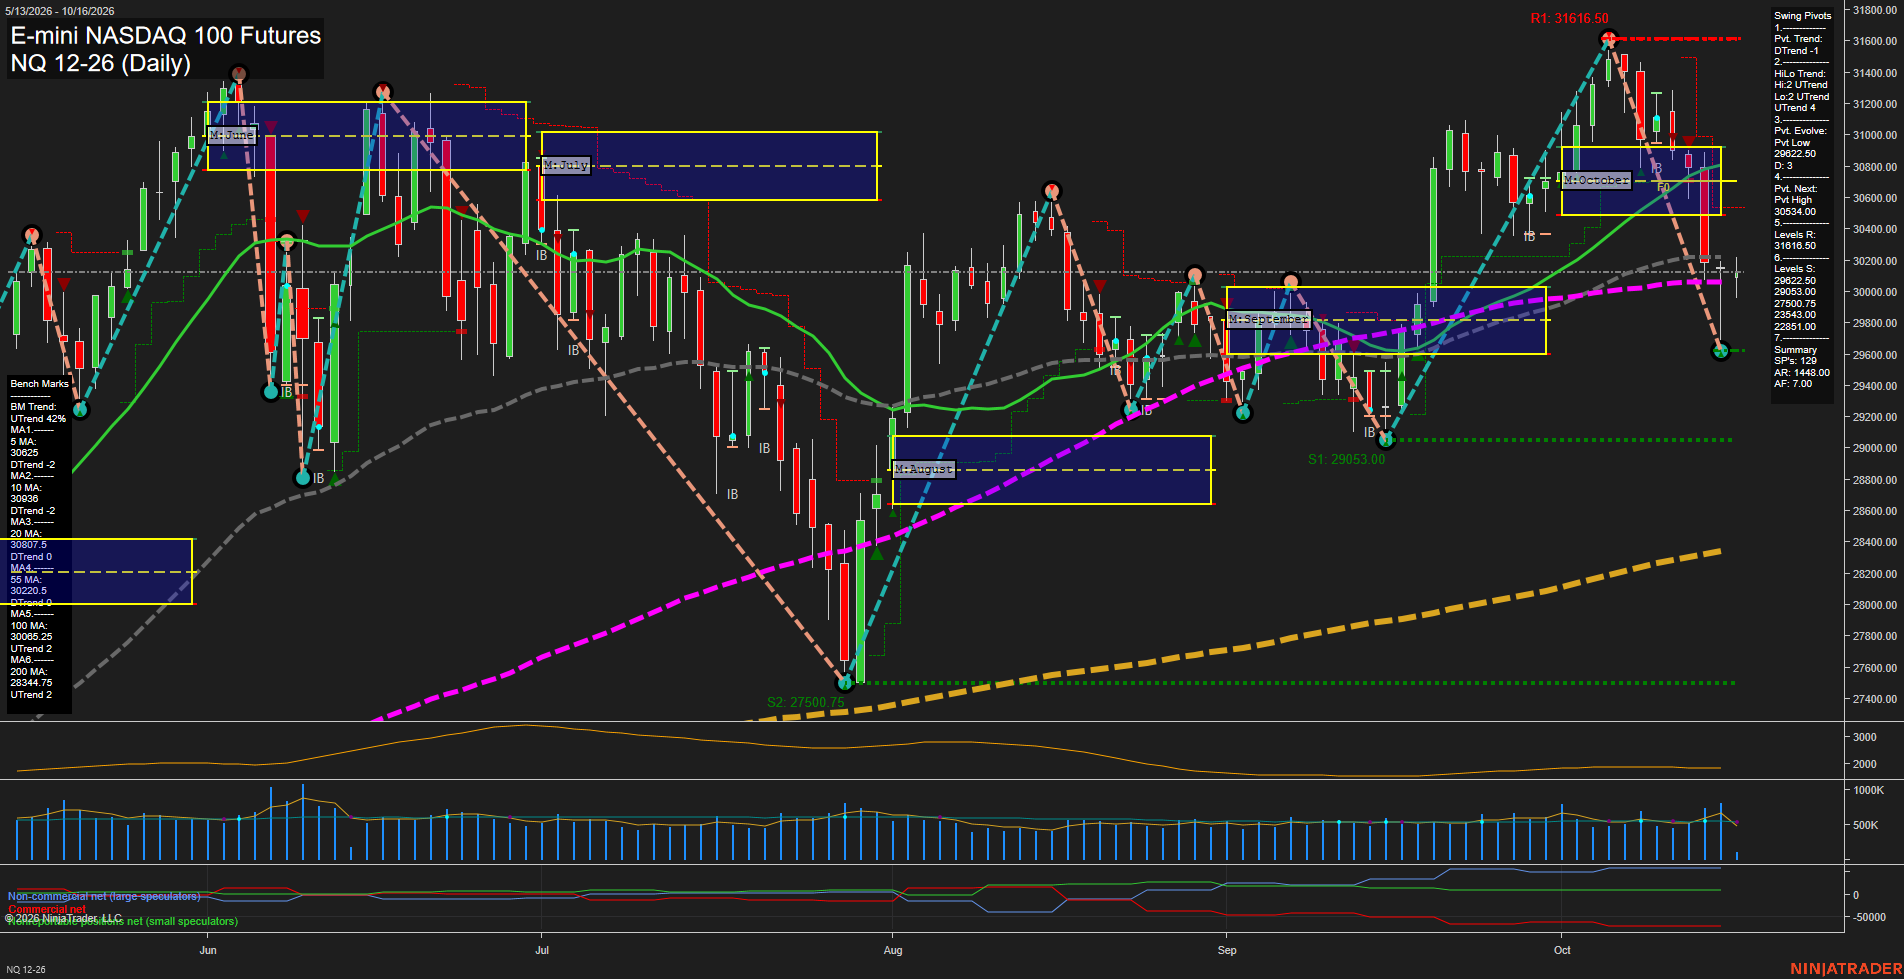
Overall Rating
- Short-Term: Bearish
- Intermediate-Term: Bearish
- Long-Term: Bullish.
Key Insights Summary
The daily structure shows a fast, high-range pullback from the 31616.50 pivot high, with price below the weekly and monthly Fibonacci grids and below the declining 5-, 10-, and 20-day benchmarks. The short-term pivot trend is down, while the larger HiLo structure remains up and price remains marginally above the rising 100-day average, defining the decline as a meaningful countertrend retracement within a still-positive long-term structure. The 30220.50 55-day average and 30534.00 next pivot-high level frame nearby overhead pressure, while 29822.50 is the first pivotal downside support. Elevated ATR and large recent bars reflect an active volatility expansion following the October rejection from the highs.
View charts on: AlphaWebTrader HTF Charts
CL Daily View
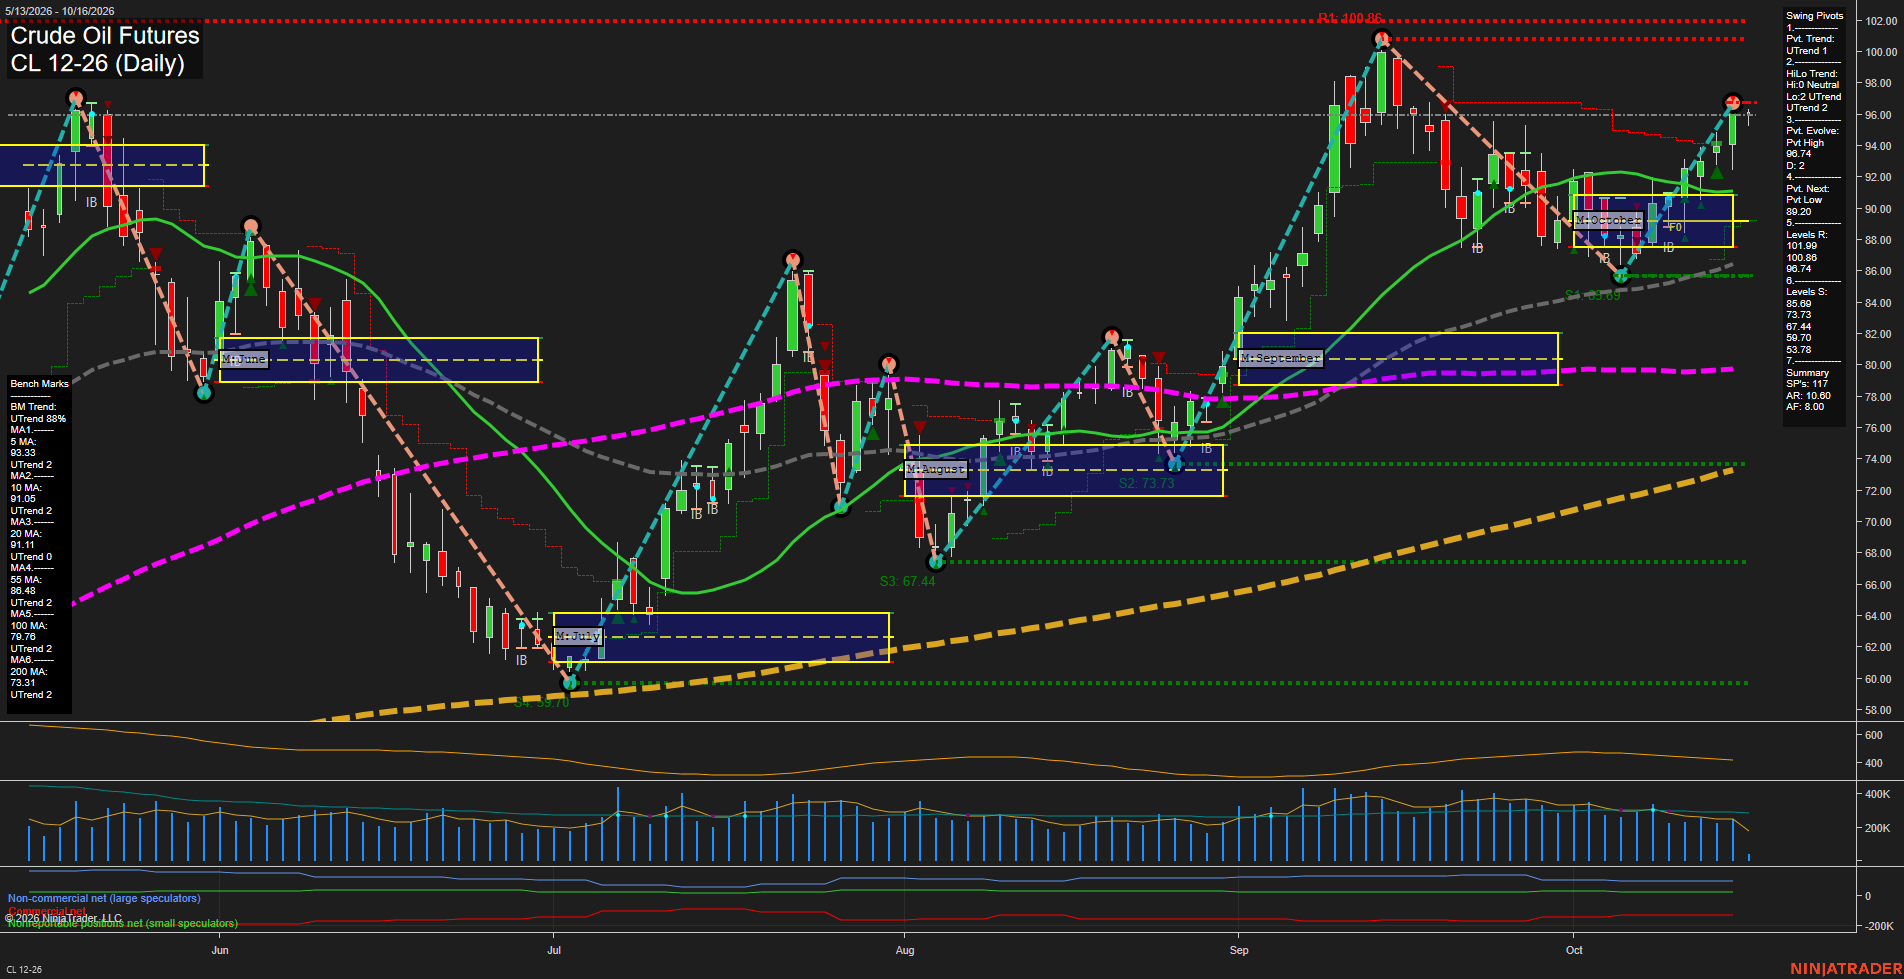
Overall Rating
- Short-Term: Bullish
- Intermediate-Term: Bullish
- Long-Term: Bullish.
Key Insights Summary
Price is advancing from the early-October pivot low and has reclaimed the 5-, 10-, 20-, and 55-day benchmarks, producing a fast short-term recovery into the 96.74 pivot-high area. Both pivot trend measures remain in UTrend, while the weekly, monthly, and yearly fib-grid biases are above F0%, aligning the short-, intermediate-, and long-term structure positively. The immediate chart focus is the 96.74 pivot high and the overhead 100.20-100.86 resistance band; support is layered at 90.20, 85.69, and 83.73. The broad structure retains higher lows from the August base, and price remains materially above the rising 100- and 200-day averages, confirming a sustained longer-cycle recovery.
View charts on: AlphaWebTrader HTF Charts
GC Daily View
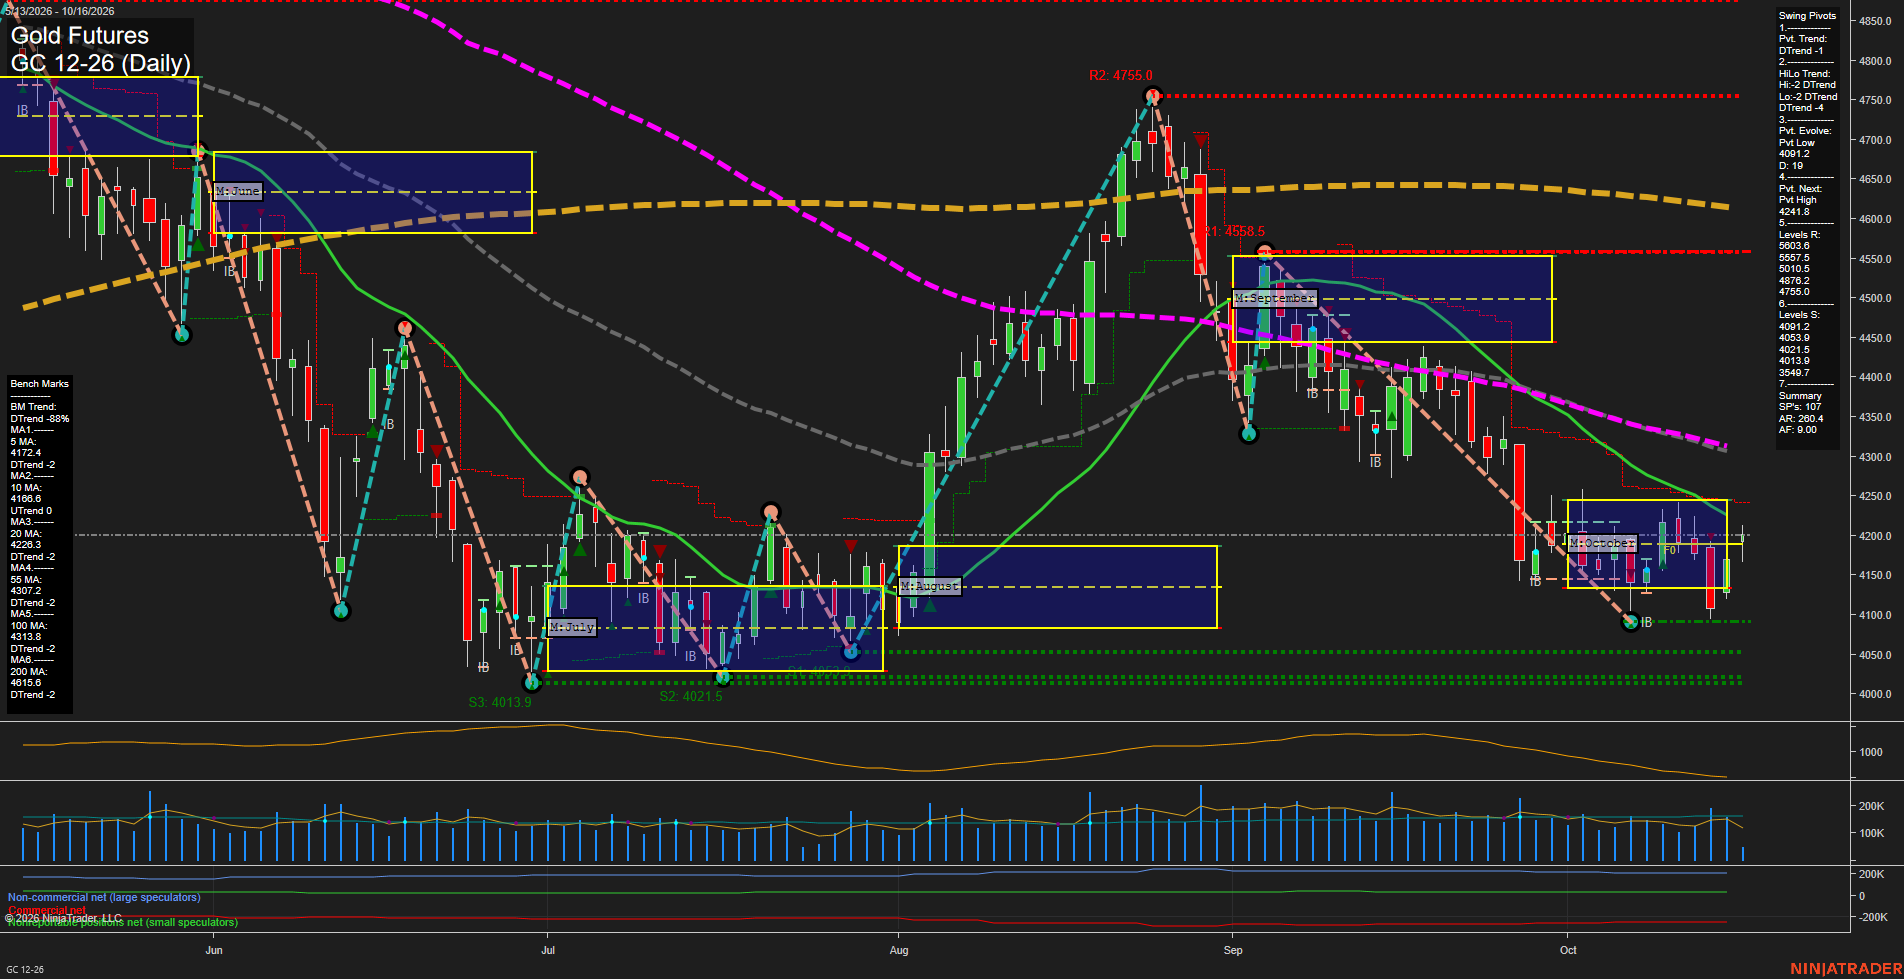
Overall Rating
- Short-Term: Bearish
- Intermediate-Term: Bearish
- Long-Term: Bearish.
Key Insights Summary
Gold is consolidating below the October monthly F0% area and the declining 20-day average after a sharp September reversal from 4755.0. The short-term pivot structure remains in a DTrend, with the current low pivot at 4091.2 and 4241.8 defining the next pivot reversal threshold. Price is holding above nearby 4091.2 to 4021.5 support, but lower highs beneath the 20-, 55-, 100-, and 200-day benchmarks preserve the broader corrective structure. Recent bars reflect compressed, choppy momentum following the selloff, while the mixed 5- and 10-day averages describe a narrow countertrend stabilization within a bearish intermediate and long-term trend.
View charts on: AlphaWebTrader HTF Charts
ZB Daily View
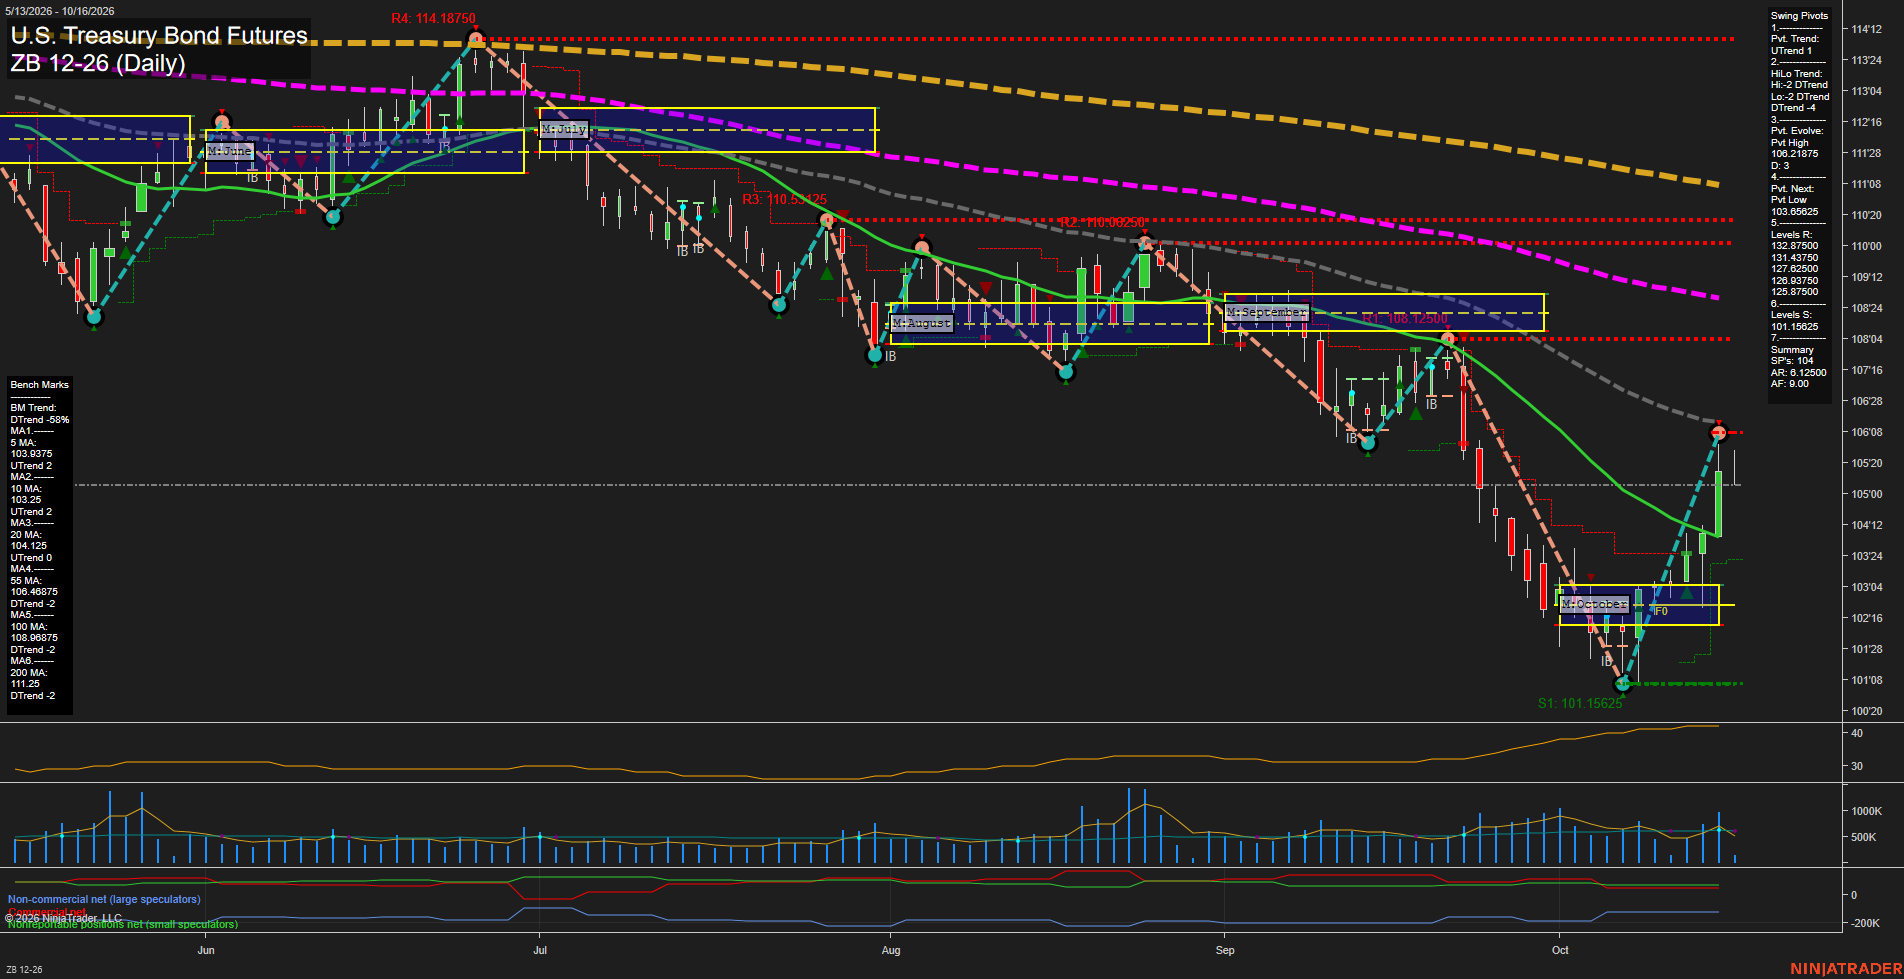
Overall Rating
- Short-Term: Bullish
- Intermediate-Term: Neutral
- Long-Term: Bearish.
Key Insights Summary
The daily chart shows a sharp V-style recovery from the October 101-05 swing low, with price rebounding above the 5-, 10-, and 20-day benchmarks and the short-term pivot trend turning higher. The intermediate pivot structure remains down, however, as price is still beneath the declining 55-, 100-, and 200-day averages. The recovery is fast and volatility has expanded, leaving the 106-03 pivot-high area as the nearest structural test while the broader long-term pattern continues to reflect lower highs and a bearish major-trend alignment.
View charts on: AlphaWebTrader HTF Charts