NYSE pre-market ETF movers and futures trends frame a data-heavy session as inflation concerns, credit stress and shipping risks weigh on sentiment.
Fundamentals: Markets enter the NYSE pre-market session with U.S. producer-price and retail-sales data, jobless claims and later Fed comments on the calendar. Hot CPI readings have renewed concern over further Fed tightening, while AI-related credit stress and weak breadth have pressured equities. Middle East shipping disruptions add an energy and freight-cost cross-current as oil assesses supply conditions and gold edges higher.
Technicals: Pre-market ETF action showed gains in TLT, AAPL and USO, while TSLA, NVDA and META declined. Futures analysis identifies bearish short-term conditions across ES, NQ, EMD and RTY, with several markets still retaining constructive longer-term structures. YM is consolidating, while FDAX shows a short-term rebound within mixed intermediate conditions.
Pre-Market Trading 360° view Market Radar of: holidays, earnings, eco-news, market-news summary, news sentiment, prior session major ETFs, MAG7, Higher Time Frame Analysis Indices Futures Summary, and E-mini S&P500, Nasdaq 100, NYMEX Crude, Gold Futures Daily Chart analysis.
As of: October 15, 2026 07:16 CT
EcoNews Radar U.S. Events
| Day | Time | Impact | Event |
|---|---|---|---|
| Thu | 08:30 | High | Core PPI m/m |
| Thu | 08:30 | High | Core Retail Sales m/m |
| Thu | 08:30 | High | PPI m/m |
| Thu | 08:30 | High | Retail Sales m/m |
| Thu | 08:30 | Medium | Philly Fed Manufacturing Index |
| Thu | 08:30 | Medium | Unemployment Claims |
| Thu | 12:00 | Low | Crude Oil Inventories |
| Thu | 23:30 | High | Fed Chairman Warsh Speaks |
EcoNews Summary
Thursday concentrates the week’s listed high-impact U.S. data, with Producer Price Index and Retail Sales releases at 08:30 followed by a high-impact speech from Fed Chairman Warsh at 23:30. The inflation and consumer-spending releases provide key context for index futures, Treasury yields, and U.S. dollar pricing. Crude oil inventories offer a petroleum-supply update relevant to energy prices and inflation sensitivity.
Event Notes:
- Thursday 08:30 – USD Core PPI m/m: Measures monthly producer-price inflation excluding selected volatile components. Traders monitor it for underlying pipeline inflation pressure and implications for rates and equity valuations.
- Thursday 08:30 – USD Core Retail Sales m/m: Measures monthly consumer spending in a core retail-sales measure. It provides a view of consumer demand and the contribution of household spending to economic activity.
- Thursday 08:30 – USD PPI m/m: Measures the monthly change in prices received by domestic producers for goods and services. It is monitored as an inflation indicator that affects interest-rate and index-futures repricing.
- Thursday 08:30 – USD Retail Sales m/m: Measures the monthly change in retail spending. It is a major gauge of consumer demand, a central component of U.S. economic activity.
- Thursday 12:00 – USD Crude Oil Inventories: Reports changes in U.S. commercial crude-oil stocks. Inventory changes inform petroleum-supply conditions, energy prices, and inflation-related market sensitivity.
- Thursday 23:30 – USD Fed Chairman Warsh Speaks: Public remarks from the Federal Reserve Chairman. Traders monitor comments for information on monetary-policy views, inflation assessment, and economic conditions.
Conclusion:
Thursday is the most important day, led by the 08:30 USD PPI m/m release. The simultaneous PPI and Retail Sales data combine inflation and consumer-demand signals, while Chairman Warsh’s late speech adds monetary-policy communication risk. High oil prices directly affect markets through inflation and geopolitical concerns.
For full details visit: Forex Factory EcoNews
Market News Summary:
Hot U.S. inflation, AI-credit stress, and Middle East shipping disruptions dominated an otherwise mixed market backdrop.
Primary Drivers & Risks:
- Primary Driver: Hot CPI revives Fed tightening fears
- Primary Risk: AI debt stress and narrow breadth
Tone:
Risk-off, with inflation and credit concerns pressuring equities.
Stock Market / ETFs / Indices:
Wall Street losses fed through to Asia, with the Nikkei down 2.9% after the inflation report renewed Fed-hike expectations. AI-linked shares faced pressure from neocloud debt concerns and sharply wider AI credit-default-swap spreads. Market breadth remained weak: 84% of S&P 500 constituents were reported in correction territory despite index records driven by AI infrastructure leaders. Small caps were below their 50-day averages while large caps remained above theirs.
Geopolitical:
Middle East tensions remained elevated after a ship was sunk in the Strait of Hormuz and Iran issued threats toward U.S. warships. The shipping route disruption added to global freight-rate concerns.
Oil / Energy:
Oil futures eased as investors assessed supply conditions, tanker-sanctions relief, and possible position adjustments. Countering the decline, Hormuz shipping risks, higher freight costs, a reported U.S. inventory draw, and strong Russian oil-and-gas revenue remained supportive factors. Saudi Aramco was reported to be offering additional spot cargoes to Europe.
Gold / Metals:
Gold rose in early Asian trading following a lower front-month settlement, described as a technical correction.
Fed / Financials:
A hot CPI report heightened concern over further Federal Reserve rate increases and weighed on equities. Bond-market concerns accompanied the AI selloff, while a Bank of England official said a rate increase did not necessarily signal a prolonged series of hikes. Sovereign funds were reported to be considering non-dollar bonds amid an AI-related liquidity crunch.
Macro / Other:
Higher oil shipping costs were cited as adding pressure from fuel prices through grocery costs. Lower U.S. fuel-economy targets were described as reducing automaker compliance costs and shifting investment away from fuel-saving technologies.
Conclusion:
Inflation-driven Fed tightening concerns and AI-sector credit stress were the central pressures on index sentiment. Weak market breadth added to caution despite strong headline index performance.
Hormuz tensions and elevated freight costs created an energy and inflation cross-current, even as oil prices declined on supply considerations. Gold rebounded modestly while global rate and liquidity concerns remained in focus.
Market News Sentiment
Market News Articles: 49
- Neutral: 40.82%
- Negative: 38.78%
- Positive: 20.41%
Sentiment Summary: News tone was mixed to slightly negative, with 41% neutral, 39% negative, and 20% positive coverage across 49 articles.
Conclusion: Indices futures day traders faced a predominantly neutral-to-negative news backdrop, with negative articles nearly matching neutral coverage and positive sentiment limited.
GLD,Gold Articles: 14
- Negative: 57.14%
- Positive: 28.57%
- Neutral: 14.29%
Sentiment Summary: Gold-related coverage is predominantly negative (57%), with 29% positive and 14% neutral.
Conclusion: The gold news tone is negative overall, indicating a risk-sensitive backdrop relevant to indices futures monitoring.
USO,Oil Articles: 11
- Negative: 72.73%
- Neutral: 18.18%
- Positive: 9.09%
Sentiment Summary: USO/Oil coverage is predominantly negative, with 73% negative, 18% neutral, and 9% positive articles across 11 reports.
Conclusion: The oil news tone is negative, which is a relevant cross-market sentiment input for indices futures day traders.
Market Data Snapshot
ETF Snapshot of major stock market ETFs, Mag7, and others as of: October 15, 2026 07:16
Top Movers & Losers
- TLT 78.89 Bullish 0.66% ▲
- AAPL 342.96 Bullish 0.50% ▲
- USO 153.56 Bullish 0.31% ▲
- TSLA 367.16 Bearish -2.15% ▼
- NVDA 221.30 Bearish -3.16% ▼
- META 737.54 Bearish -3.27% ▼
Major Index ETFs: SPY, QQQ, DIA, IWM, IJH
- DIA 515.63 Bearish -0.11% ▼
- SPY 769.60 Bearish -1.08% ▼
- IJH 72.27 Bearish -1.35% ▼
- IWM 271.37 Bearish -1.93% ▼
- QQQ 728.95 Bearish -1.97% ▼
Major index ETFs were Bearish across the group. QQQ was the most bearish mover at -1.97%, followed by IWM at -1.93%, IJH at -1.35%, and SPY at -1.08%. DIA was the least negative mover, marginally lower at -0.11%.
Mag 7 Stocks: AAPL, MSFT, GOOG, AMZN, META, NVDA, TSLA
- AAPL 342.96 Bullish 0.50% ▲
- GOOG 343.65 Bearish -1.68% ▼
- AMZN 254.08 Bearish -1.74% ▼
- MSFT 533.69 Bearish -1.80% ▼
- TSLA 367.16 Bearish -2.15% ▼
- NVDA 221.30 Bearish -3.16% ▼
- META 737.54 Bearish -3.27% ▼
Mag7 is Bearish overall, with six declines led by META at -3.27%, the most bearish mover, followed by NVDA at -3.16%. AAPL is the sole Bullish mover at +0.50%, while GOOG -1.68%, AMZN -1.74%, MSFT -1.80%, and TSLA -2.15% remain Bearish.
Cross-Market ETFs: TLT, GLD, USO, IBIT
- TLT 78.89 Bullish 0.66% ▲
- USO 153.56 Bullish 0.31% ▲
- GLD 375.99 Bearish -1.49% ▼
- IBIT 46.24 Bearish -1.89% ▼
Other ETFs are Mixed: TLT is the most bullish mover at +0.66%, followed by USO at +0.31%. IBIT is the most bearish mover at -1.89%, with GLD also Bearish at -1.49%.
ETF, Mag7, and Cross-Market ETF Insights
Overall Tone
Bearish risk-off tone, with broad equity weakness alongside Bullish Treasuries and modest Bullish oil.
Equity ETFs and Mag7:
Major Index ETFs were broadly Bearish: DIA was marginal at -0.11%, while SPY fell -1.08%, IJH -1.35%, IWM -1.93%, and QQQ -1.97%. Mag7 performance was selective, with AAPL the most bullish mover at +0.50%, while META was the most bearish mover at -3.27%; NVDA declined -3.16%, TSLA -2.15%, MSFT -1.80%, AMZN -1.74%, and GOOG -1.68%. Equity weakness was broadly aligned, with smaller-cap and technology ETFs lagging the near-flat DIA.
Cross-Market ETFs:
Cross-market ETFs were Mixed: TLT was the most bullish mover at +0.66%, and USO added +0.31%. GLD declined -1.49%, while IBIT was the most bearish mover at -1.89%, showing weakness in gold and bitcoin alongside the equity decline.
Futures Indices – Higher Time Frame Analysis
Summary of the current state of US Indices Futures based on higher time-frame (HTF) technical analysis as of: 2026-10-15: 07:16 CT.
US Indices Futures
- ES: YSFG up, MSFG/WSFG below centers, bearish short-term benchmarks, 7729.50 support, 7875.00-7906.25 resistance, long-term averages rising.
- NQ: YSFG up, MSFG/WSFG below F0%, benchmarks down through 100-day, 29748.50 support, 30686.50-31616.50 resistance, long-term structure up.
- YM: YSFG/MSFG up, WSFG below F0%, short-term consolidation, 50859-51472 support, 52612-53219 resistance, 200-day benchmark rising.
- EMD: YSFG up, MSFG centered, WSFG below F0%, DTrend below benchmarks, 3600.3 support, 3696.1-3737.8 resistance, long-term mixed.
- RTY: YSFG up, MSFG/WSFG below F0%, DTrend below all daily benchmarks, 2734.9 support, 2816.9-2899.1 resistance, weekly long-term benchmarks rising.
- FDAX: YSFG/MSFG up, WSFG below F0%, daily UTrend rebound, 24897-24925 support, 25589-26847 resistance, 200-day benchmark rising.
Overall State
- Short-Term: Bearish
- Intermediate-Term: Bearish
- Long-Term: Bullish
Conclusion
ES, NQ, EMD, and RTY retain aligned short-term downside structures, with prices below WSFG/MSFG reference areas and key benchmark clusters. YM is balancing above short-term averages but remains below pivot resistance. FDAX shows a daily rebound within a weekly corrective structure. YSFG conditions and rising longer-term benchmarks remain upward across most contracts; EMD long-term conditions are mixed. Support pivots include ES 7729.50, NQ 29748.50, YM 50859, EMD 3600.3, RTY 2734.9, and FDAX 24925.
Note: Intra-day counter-trend pullbacks or retracements may occur, HTF is context for informational usage and market structure. Glossary: Session Fib Grids periods of YSFG:’Yearly’, MSFG:’Monthly’, WSFG:’Weekly’
For full details visit: AlphaWebTrader Technicals
ES Daily View
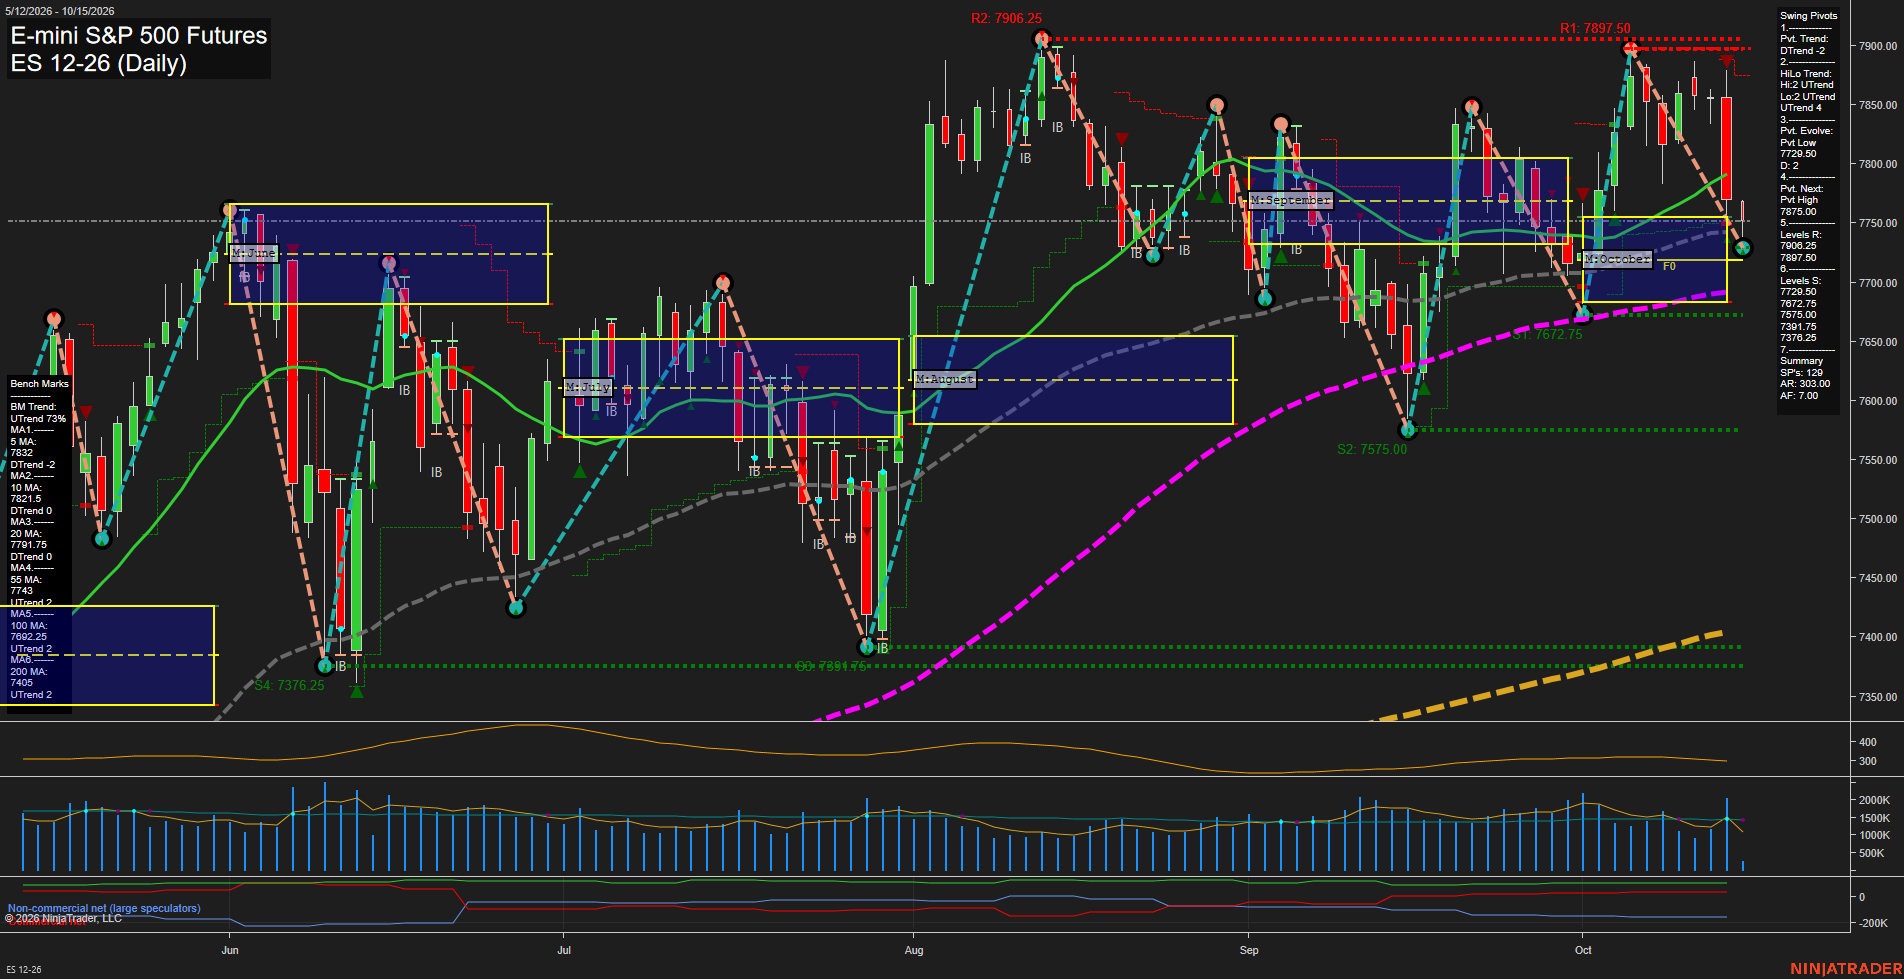
Overall Rating
- Short-Term: Bearish
- Intermediate-Term: Neutral
- Long-Term: Bullish.
Key Insights Summary
The daily structure shows a sharp short-term selloff from the early-October high near 7897.50, with a large bearish bar pressing price into the 7729.50 pivot-low support zone. Price is below the weekly and monthly Fib-grid centers and below the declining 5-, 10-, and 20-day benchmarks, confirming fast downside momentum and a short-term DTrend. Intermediate conditions are mixed: the HiLo trend remains up and the 55-day average is rising, but the monthly grid is down and price has slipped beneath the 55-day benchmark. The longer-term structure remains constructive above rising 100- and 200-day averages and the positive yearly grid. Resistance is concentrated at 7875.00, 7897.50, and 7906.25, while a break beneath 7729.50 exposes the lower support sequence at 7672.75 and 7575.00.
View charts on: AlphaWebTrader HTF Charts
NQ Daily View
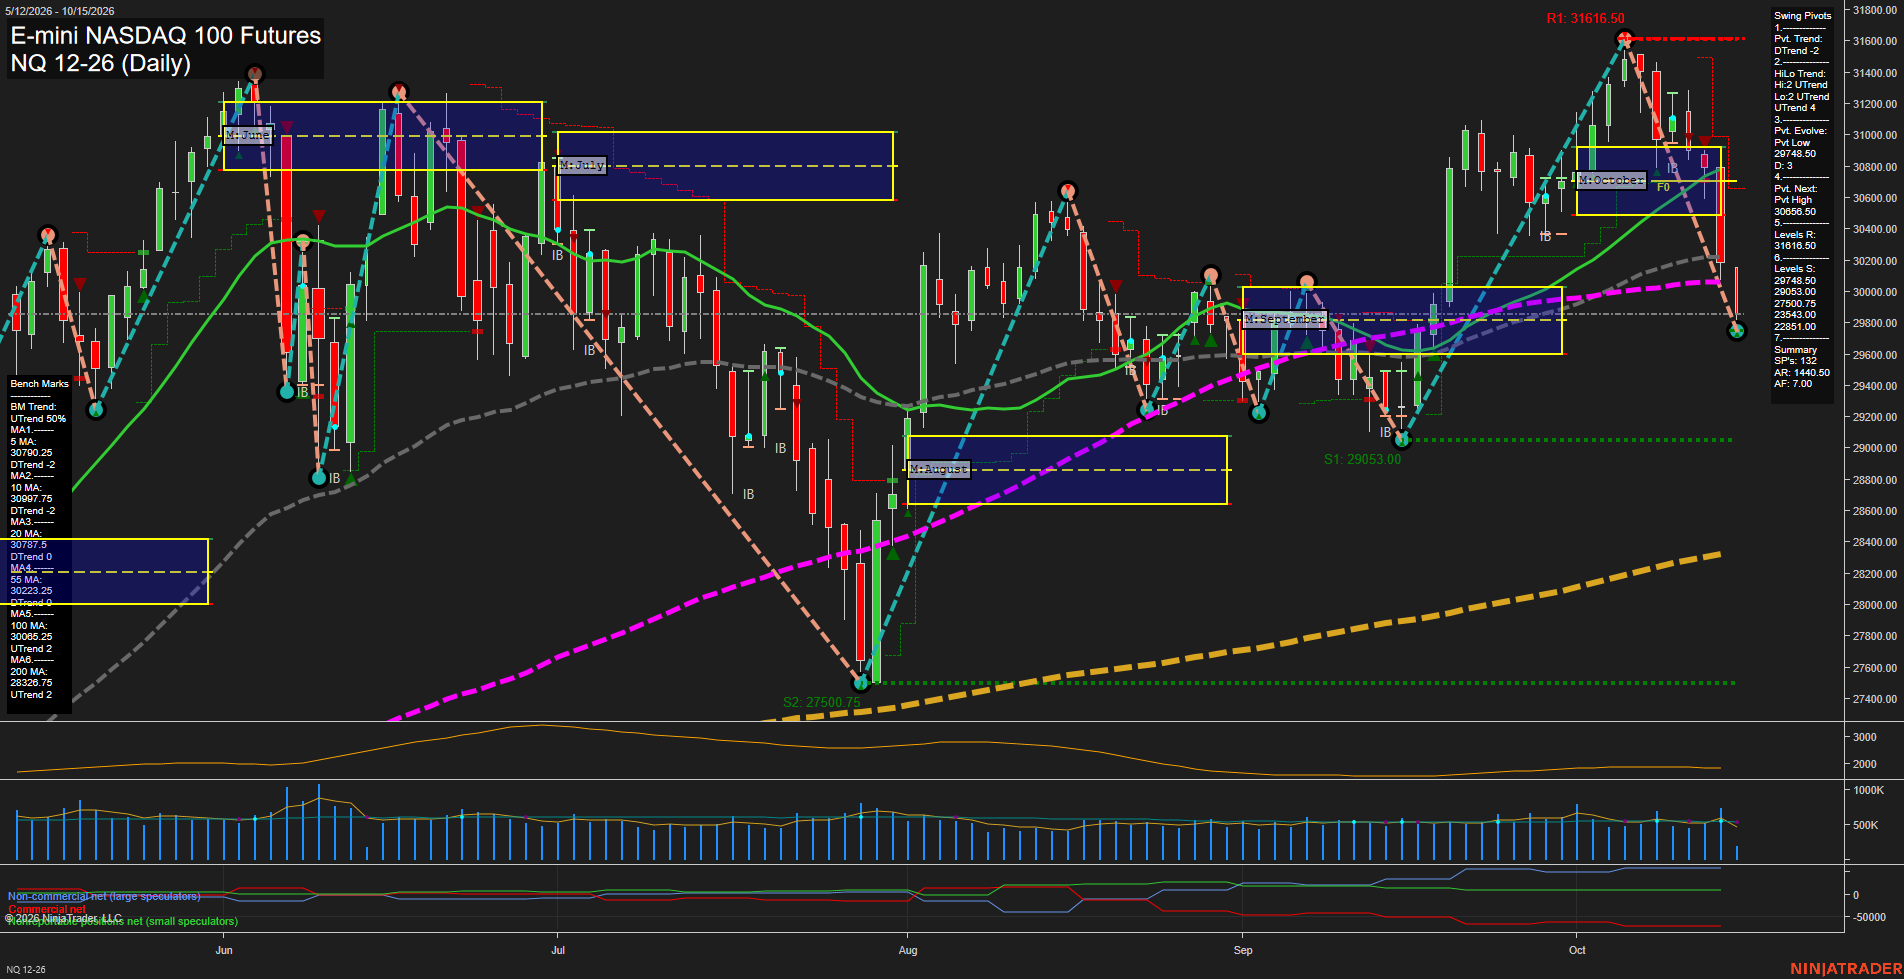
Overall Rating
- Short-Term: Bearish
- Intermediate-Term: Bearish
- Long-Term: Bullish.
Key Insights Summary
The daily structure shows a fast downside reversal from the 31616.50 swing-high resistance area, with price now below the weekly and monthly Fib-grid centers and beneath the 5-, 10-, 20-, 55-, and 100-day benchmarks. The active short-term pivot trend is down, while the broader HiLo pivot trend remains up, defining the current move as a sharp countertrend retracement within a still-positive yearly structure. Price is testing the 29748.50 pivot-low area near the 100-day average; 29053.00 is the next major swing-support reference. The 30686.50 pivot-next level and the clustered 20-, 55-, and 100-day averages form an important overhead rebound and rejection zone. Elevated ATR and fast momentum reflect a volatile liquidation phase rather than a quiet consolidation.
View charts on: AlphaWebTrader HTF Charts
CL Daily View
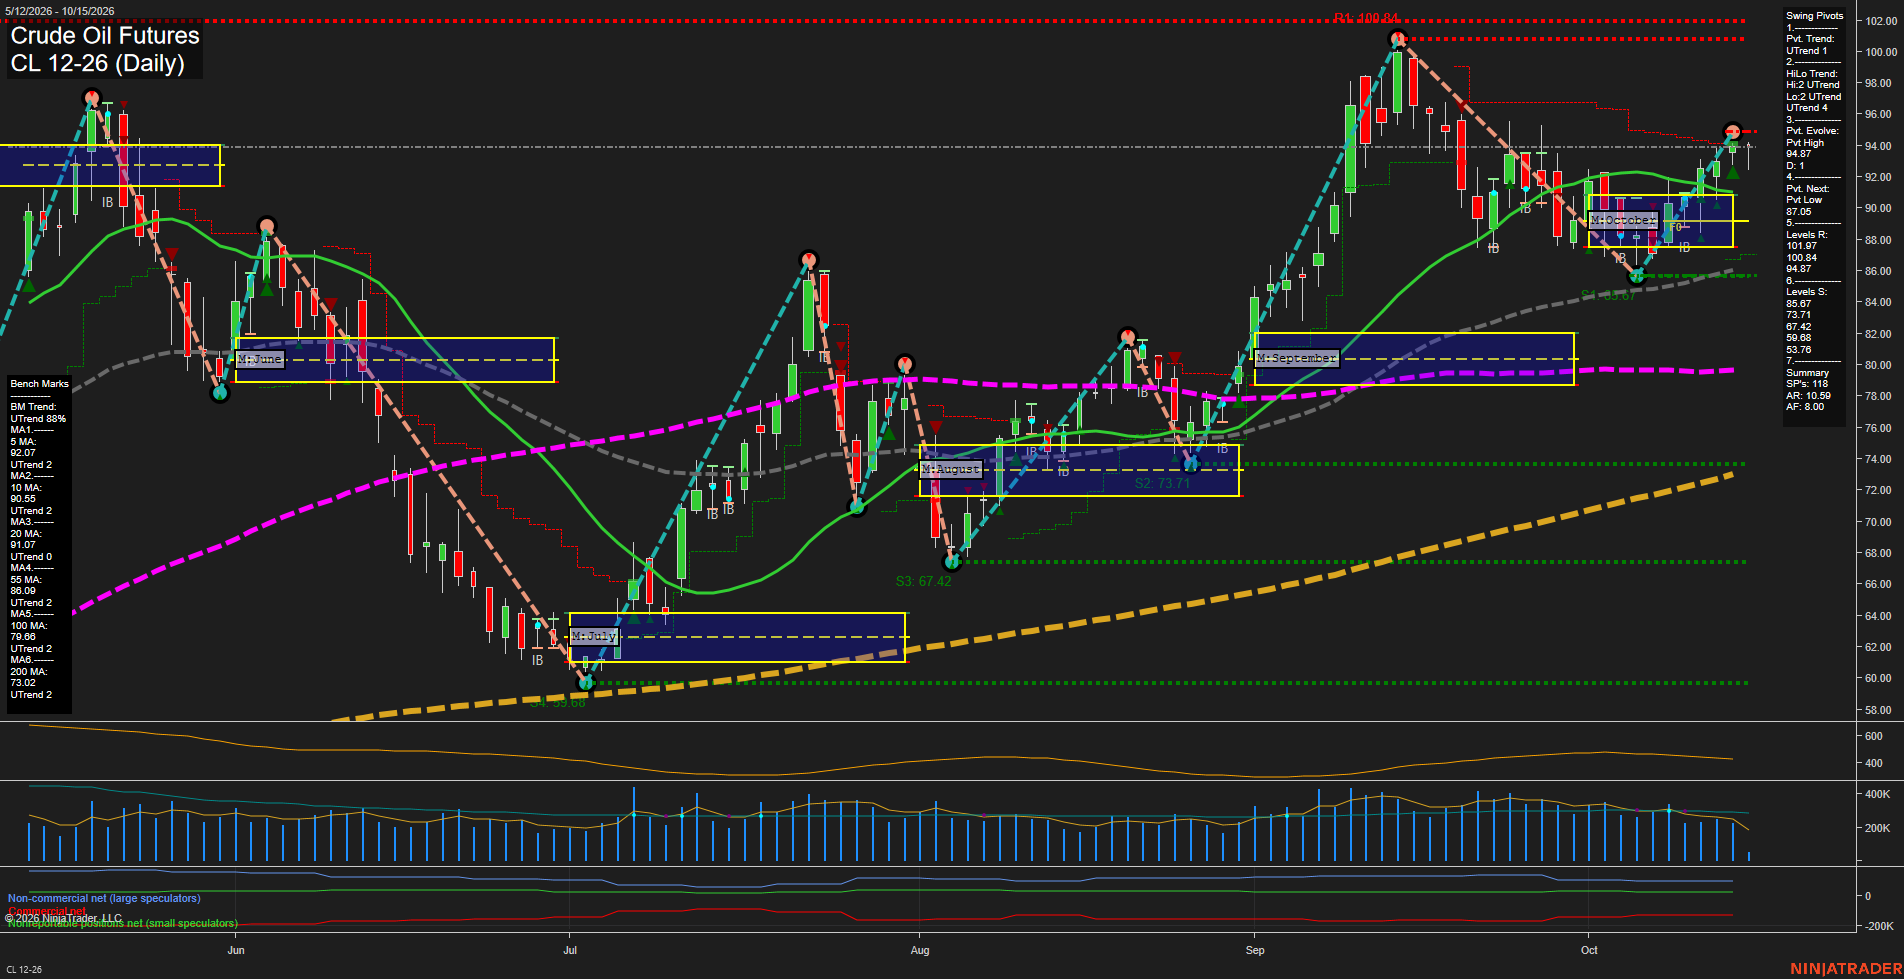
Overall Rating
- Short-Term: Bullish
- Intermediate-Term: Bullish
- Long-Term: Bullish.
Key Insights Summary
Price has resumed its advance from the early-October 85.67 pivot low and is trading above every daily benchmark, with the 5, 10, 20, 55, 100, and 200-day averages all aligned in uptrends. The short-term pivot structure is in an UTrend and the intermediate HiLo structure remains constructive, while price is above both the weekly and monthly F0%/NTZ areas. The recovery has accelerated into the 94.87 evolving pivot-high area, making the nearby 94.87 level immediate price reference resistance before the larger 100.84 and 101.97 swing-high zones. The recent sequence reflects higher lows following the late-September pullback, while 87.05 remains the next pivot-reversal reference and 85.67 is the major nearby swing support. Volume activity has moderated after the September rally surge, indicating a more measured continuation phase rather than the earlier high-volume breakout impulse.
View charts on: AlphaWebTrader HTF Charts
GC Daily View
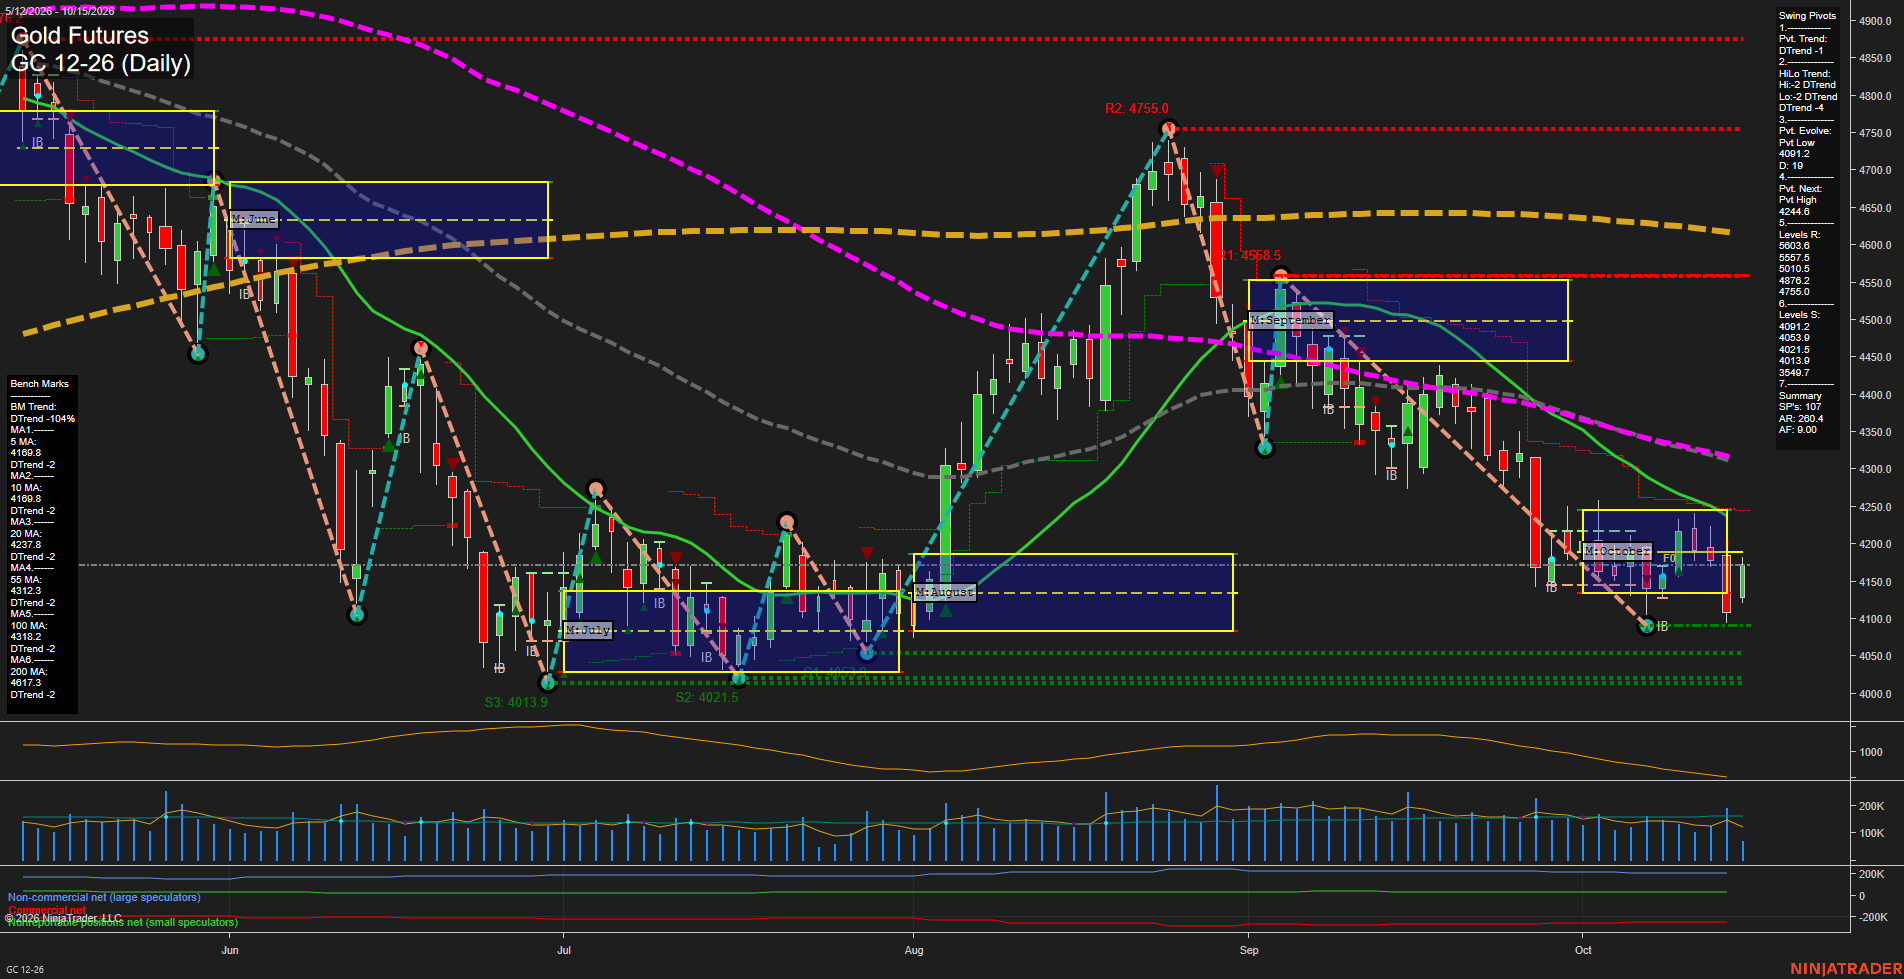
Overall Rating
- Short-Term: Bearish
- Intermediate-Term: Bearish
- Long-Term: Bearish.
Key Insights Summary
Gold remains in a broad daily-chart decline, with price below the monthly and yearly Fib-grid bias levels and all benchmark averages retaining down trends. The rebound from the 4091.2 pivot low is a short-term countertrend bounce, but it remains beneath the 20, 55, 100, and 200-day averages. Pivot structure remains bearish, defined by lower highs and a DTrend in both short- and intermediate-term measures; 4246.8 is the next pivot-reversal reference while 4091.2, 4053.9, and 4021.5 define the nearby support cluster. Volatility remains elevated, consistent with medium-sized daily bars and choppy retracement conditions following the sharp September decline.
View charts on: AlphaWebTrader HTF Charts
ZB Daily View
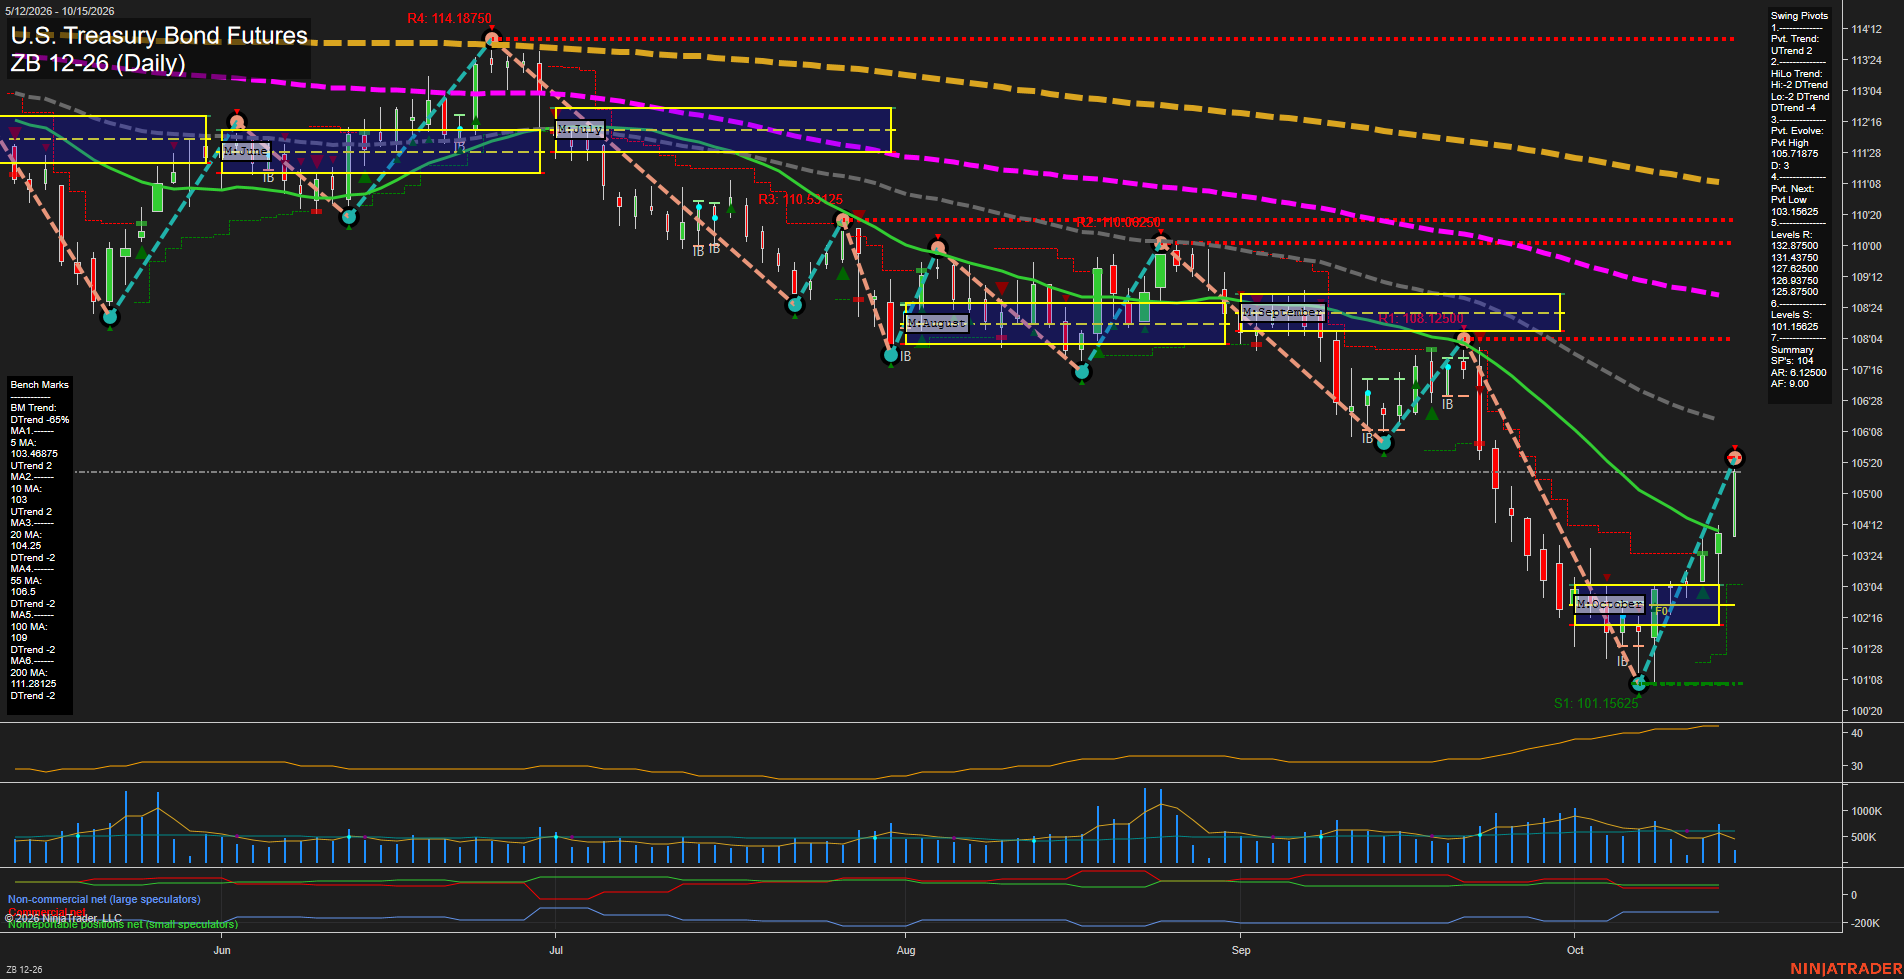
Overall Rating
- Short-Term: Bullish
- Intermediate-Term: Neutral
- Long-Term: Bearish.
Key Insights Summary
The October rebound has developed into a fast, large-range recovery from the 101.15625 swing low, lifting price above the weekly and monthly F0%/NTZ structures and restoring the short-term pivot trend to UTrend. Price is also above the rising 5-day and 10-day averages, while the 103.15625 pivot-next level defines the near-term pullback reference. Intermediate structure remains mixed: the HiLo trend is still DTrend and price remains beneath declining 20-day and 55-day benchmarks. The broader yearly grid and declining 100-day and 200-day averages retain a bearish long-term structure
View charts on: AlphaWebTrader HTF Charts