U.S. equity futures rise before CPI and bank earnings as technical levels, oil, yields, breadth, gold and Middle East risks guide market focus.
Fundamentals: U.S. equity futures edged higher before CPI data and results from Bank of America and Morgan Stanley. The session is framed by inflation and rate expectations, higher oil prices amid Middle East tensions, and concerns over narrow index leadership, weak small caps and semiconductor pressure. Gold held near recent levels as investors assessed dollar and Fed-policy implications.
Technicals: ETF leadership was mixed in the prior session, with META, USO and NVDA higher while AMZN, IWM and TSLA declined. Futures technical conditions show broadly constructive longer-term structures in ES and FDAX, while NQ, YM, EMD and RTY display varying degrees of short-term corrective pressure. Key pivot, benchmark and Fibonacci reference levels frame the current consolidation and rebound patterns.
Pre-Market Trading 360° view Market Radar of: holidays, earnings, eco-news, market-news summary, news sentiment, prior session major ETFs, MAG7, Higher Time Frame Analysis Indices Futures Summary, and E-mini S&P500, Nasdaq 100, NYMEX Crude, Gold Futures Daily Chart analysis.
As of: October 14, 2026 07:16 CT
Earnings Radar
Monitoring for earnings releases by the Magnificent 7, AI-tech-related firms, and major financial institutions.
- BAC Release: 2026-10-14 T:BMO
- MS Release: 2026-10-14 T:BMO
Conclusion: BAC and MS report before the market opens on Oct. 14, placing major bank earnings at the center of index-futures focus through financial-sector reactions, rate-sensitive sentiment, credit trends, and capital-markets activity. No MAG7, AI, semiconductor, or major technology releases are included in the provided data.
For full details visit: Yahoo Earnings Calendar
EcoNews Radar U.S. Events
| Day | Time | Impact | Event |
|---|---|---|---|
| Wed | 08:30 | High | Core CPI m/m |
| Wed | 08:30 | High | Core CPI y/y |
| Wed | 08:30 | High | CPI m/m |
| Wed | 08:30 | High | CPI y/y |
| Thu | 08:30 | High | Core PPI m/m |
| Thu | 08:30 | High | Core Retail Sales m/m |
| Thu | 08:30 | High | PPI m/m |
| Thu | 08:30 | High | Retail Sales m/m |
| Thu | 08:30 | Medium | Philly Fed Manufacturing Index |
| Thu | 08:30 | Medium | Unemployment Claims |
| Thu | 12:00 | Low | Crude Oil Inventories |
| Thu | 23:30 | High | Fed Chairman Warsh Speaks |
EcoNews Summary
Wednesday’s 08:30 consumer-inflation releases and Thursday’s 08:30 producer-price and retail-sales releases concentrate the week’s highest-impact U.S. data. Thursday also includes crude oil inventories, relevant to energy pricing and petroleum supply, followed by Fed Chairman Warsh’s remarks at 23:30.
Event Notes:
- Wednesday 08:30 – Core consumer inflation m/m and y/y: Measures consumer-price changes excluding food and energy on monthly and annual bases. Traders monitor underlying inflation pressure and its relevance to monetary-policy conditions.
- Wednesday 08:30 – Consumer inflation m/m and y/y: Measures broad consumer-price changes on monthly and annual bases. Traders monitor inflation trends, interest-rate sensitivity, and index-futures volatility around the release.
- Thursday 08:30 – Core PPI m/m: Measures monthly changes in producer prices excluding food and energy. Traders monitor pipeline inflation pressures that feed into broader pricing conditions.
- Thursday 08:30 – PPI m/m: Measures monthly changes in prices received by domestic producers. Traders monitor producer-cost trends and inflation conditions.
- Thursday 08:30 – Core Retail Sales m/m: Measures monthly retail-sales changes excluding volatile categories. Traders monitor consumer-demand strength and the pace of economic activity.
- Thursday 08:30 – Retail Sales m/m: Measures monthly changes in total retail spending. Traders monitor household demand, consumption activity, and growth-sensitive market reactions.
- Thursday 12:00 – Crude Oil Inventories: Reports changes in U.S. crude stockpiles. Traders monitor inventory shifts for petroleum-supply conditions, energy-price movement, and inflation relevance.
- Thursday 23:30 – Fed Chairman Warsh Speaks: Public remarks from the Federal Reserve Chairman. Traders monitor comments on economic conditions, inflation, and monetary-policy framing.
Conclusion:
Wednesday is the week’s most important day, centered on the 08:30 consumer-inflation releases. Market momentum and volume often slow ahead of major inflation data, with increased volatility at release time. Thursday’s clustered price and consumption data, crude inventories, and late Fed remarks extend the event-driven market focus.
For full details visit: Forex Factory EcoNews
Market News Summary:
Equity futures firmed ahead of U.S. CPI and major bank results, while inflation, rates, and Middle East energy tensions remained central cross-currents.
Primary Drivers & Risks:
- Primary Driver: U.S. CPI and bank earnings
- Primary Risk: Inflation, yields, and narrow breadth
Tone:
Cautiously constructive ahead of key inflation data, with elevated rate and concentration concerns.
Stock Market / ETFs / Indices:
S&P 500 and Dow futures rose ahead of CPI and large-bank results, while the Nikkei gained 0.3% as investors adjusted positions before the release. The S&P 500 recently reached a record high, but reports highlighted weak small-cap performance, poor market breadth, heavy concentration in five technology firms, and semiconductor weakness.
Geopolitical:
Middle East tensions escalated around Yemen, with reports of Saudi-led strikes on Houthi energy terminals and fuel reserves. Strait of Hormuz security rhetoric remained a focal point for energy markets.
Oil / Energy:
Oil prices rose on concerns over Middle East supply disruption, Saudi supply risk, and Russian diesel flows. WTI held above $93.94 and Brent traded near a $107 technical target amid Hormuz-related risks; EU methane rules for oil and gas imports were delayed by one year.
Gold / Metals:
Gold held near $4,142-$4,160 ahead of U.S. CPI, with pricing sensitive to the Fed-rate path and dollar response. Silver remained under pressure in technical commentary, while a copper-gold exploration financing announcement provided a limited sector-specific positive.
Fed / Financials:
Markets focused on CPI for signals on further Fed tightening, while Fed Governor Bowman said there was time to wait and see before additional action. Rising bond yields were cited as pressure on expensive equities, and AI-related capital spending was linked to persistent inflation and reduced technology-sector buybacks.
Macro / Other:
China producer prices rose at their fastest pace since June 2022 and exceeded economist estimates, adding to global inflation attention. Asian currencies consolidated against the dollar before the CPI release.
Conclusion:
U.S. CPI, Fed-rate expectations, and large-bank results were the primary equity-index catalysts. Futures traded higher ahead of these events despite a mixed underlying market backdrop.
Rising yields, concentrated index leadership, weak small caps, and semiconductor pressure remained key equity risks. Higher oil prices tied to Middle East tensions and stronger Chinese producer prices added inflation cross-currents.
Market News Sentiment
Market News Articles: 40
- Negative: 50.00%
- Neutral: 27.50%
- Positive: 22.50%
Sentiment Summary: Market news sentiment is negative overall, with 50% negative, 28% neutral, and 23% positive coverage across 40 articles.
Conclusion: Indices futures headlines show a predominantly cautious tone, with negative coverage exceeding neutral and positive items.
GLD,Gold Articles: 14
- Negative: 50.00%
- Positive: 28.57%
- Neutral: 21.43%
Sentiment Summary: GLD/Gold coverage is predominantly negative at 50%, with 29% positive and 21% neutral across 14 articles.
Conclusion: The gold-related news tone is negative overall, which may be relevant context for indices futures day traders.
USO,Oil Articles: 13
- Positive: 46.15%
- Negative: 30.77%
- Neutral: 23.08%
Sentiment Summary: USO and oil coverage is moderately positive, with 46% positive, 31% negative, and 23% neutral articles across 13 items.
Conclusion: Oil-related news tone is net positive but includes meaningful negative coverage, indicating mixed sentiment for indices futures traders.
Market Data Snapshot
ETF Snapshot of major stock market ETFs, Mag7, and others as of: October 14, 2026 07:16
Top Movers & Losers
- META 762.50 Bullish 2.63% ▲
- USO 153.09 Bullish 1.36% ▲
- NVDA 228.52 Bullish 0.97% ▲
- AMZN 258.58 Bearish -0.37% ▼
- IWM 276.70 Bearish -0.43% ▼
- TSLA 375.23 Bearish -0.74% ▼
Major Index ETFs: SPY, QQQ, DIA, IWM, IJH
- IJH 73.26 Bullish 0.14% ▲
- SPY 778.01 Bearish -0.01% ▼
- DIA 516.21 Bearish -0.33% ▼
- QQQ 743.57 Bearish -0.33% ▼
- IWM 276.70 Bearish -0.43% ▼
Major Index ETFs are Mixed: IJH is the most bullish mover at +0.14%, while IWM is the most bearish mover at -0.43%. SPY is marginally Bearish at -0.01%; DIA and QQQ are Bearish at -0.33% each.
Mag 7 Stocks: AAPL, MSFT, GOOG, AMZN, META, NVDA, TSLA
- META 762.50 Bullish 2.63% ▲
- NVDA 228.52 Bullish 0.97% ▲
- MSFT 543.45 Bullish 0.42% ▲
- GOOG 349.52 Bullish 0.16% ▲
- AAPL 341.27 Bullish 0.09% ▲
- AMZN 258.58 Bearish -0.37% ▼
- TSLA 375.23 Bearish -0.74% ▼
Mixed: META is the most bullish mover at +2.63%, followed by NVDA at +0.97%. MSFT +0.42% and GOOG +0.16% are Bullish, while AAPL is marginally Bullish at +0.09%. TSLA is the most bearish mover at -0.74%, with AMZN Bearish at -0.37%.
Cross-Market ETFs: TLT, GLD, USO, IBIT
- USO 153.09 Bullish 1.36% ▲
- IBIT 47.13 Bullish 0.58% ▲
- TLT 78.37 Bullish 0.41% ▲
- GLD 381.67 Bearish -0.13% ▼
Other ETFs were Mixed: USO was the most bullish mover at +1.36%, followed by IBIT at +0.58% and TLT at +0.41%. GLD was the most bearish mover, marginally lower at -0.13%.
ETF, Mag7, and Cross-Market ETF Insights
Overall Tone
Mixed, with selective Bullish leadership in META and USO while broad equity index ETFs remain modestly Bearish to near-flat.
Equity ETFs and Mag7:
Major Index ETFs were Mixed: IJH was Bullish at +0.14%, while SPY was marginally Bearish at -0.01%, QQQ and DIA each declined -0.33%, and IWM was the most Bearish index ETF at -0.43%.
Mag7 performance was selective, led by META—the most Bullish mover across the snapshot—at +2.63%, followed by NVDA +0.97%, MSFT +0.42%, GOOG +0.16%, and AAPL +0.09%.
AMZN was Bearish at -0.37%, while TSLA was the most Bearish mover across the snapshot at -0.74%, showing mixed large-cap technology participation.
Cross-Market ETFs:
Cross-Market ETFs were mostly Bullish, with USO leading as the most Bullish mover at +1.36%, while IBIT gained +0.58% and TLT added +0.41%.
GLD was the only Bearish cross-market ETF and the most Bearish mover in this group at -0.13%, diverging from strength in energy, Bitcoin exposure, and Treasuries.
Futures Indices – Higher Time Frame Analysis
Summary of the current state of US Indices Futures based on higher time-frame (HTF) technical analysis as of: 2026-10-14: 07:16 CT.
US Indices Futures
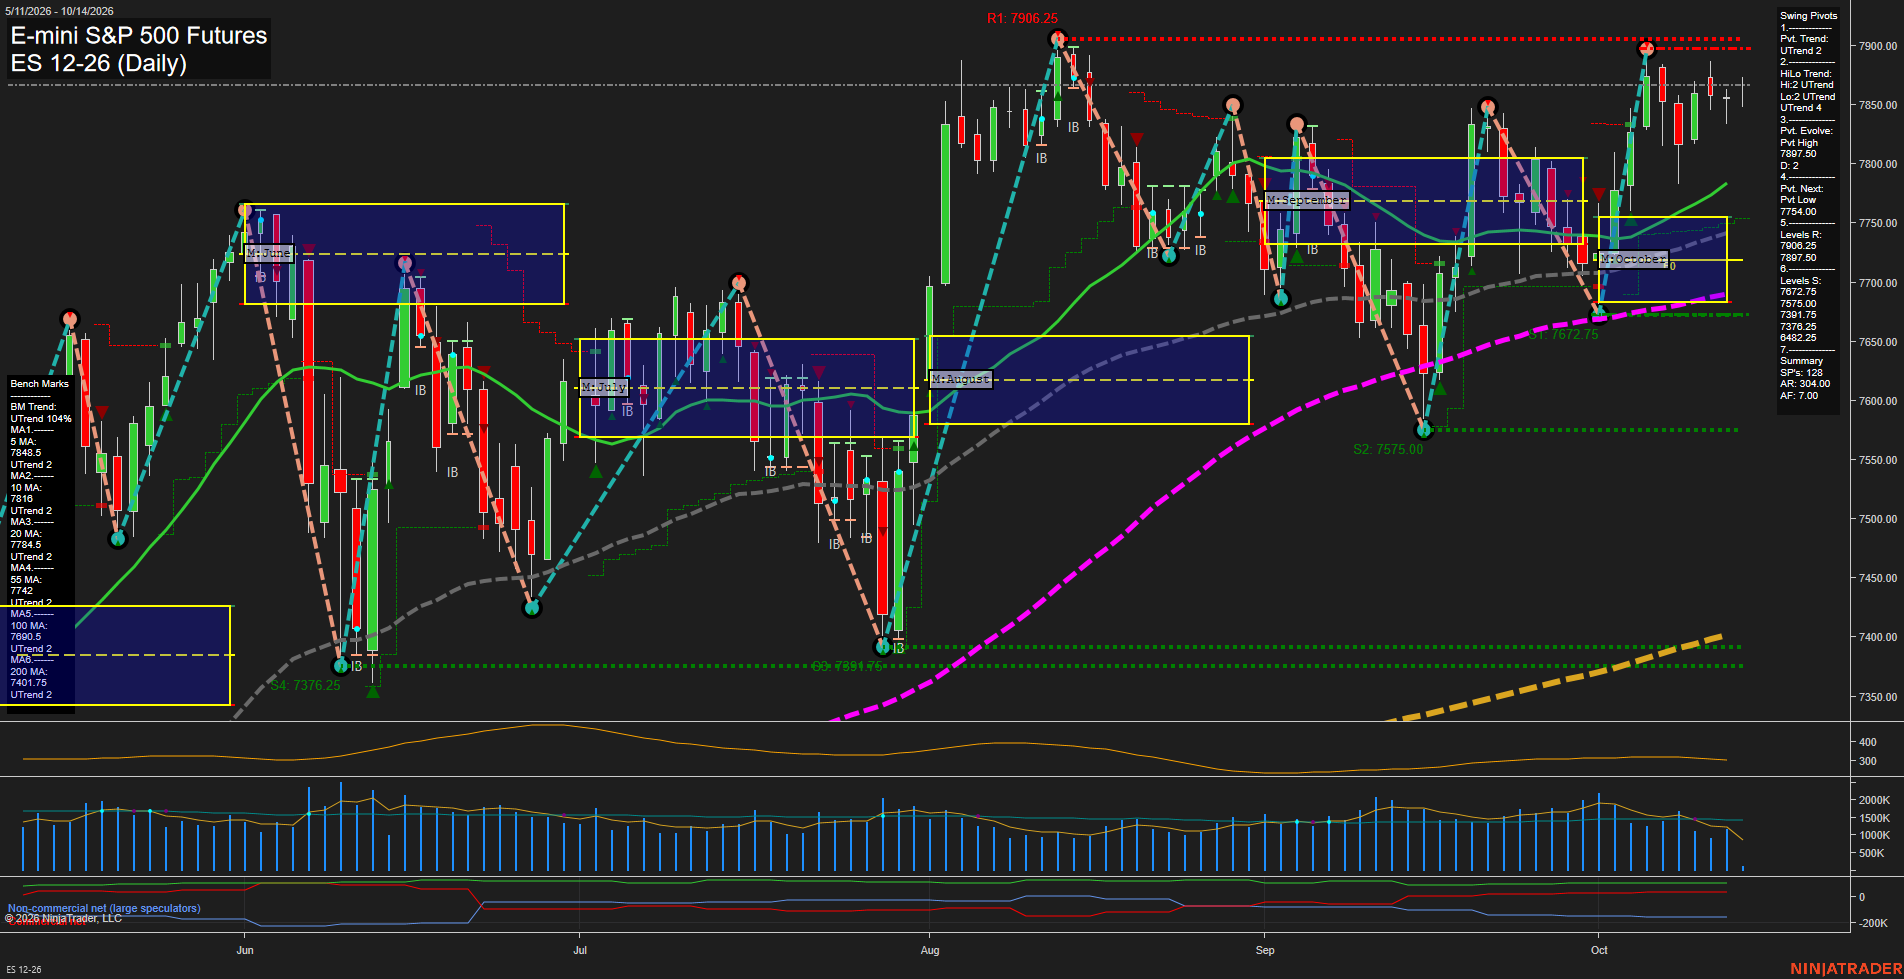
- ES: YSFG/MSFG upward, WSFG below F0%, benchmarks rising beneath price; 7906 resistance, 7754-7673 support, 7588 swing-low pivot.
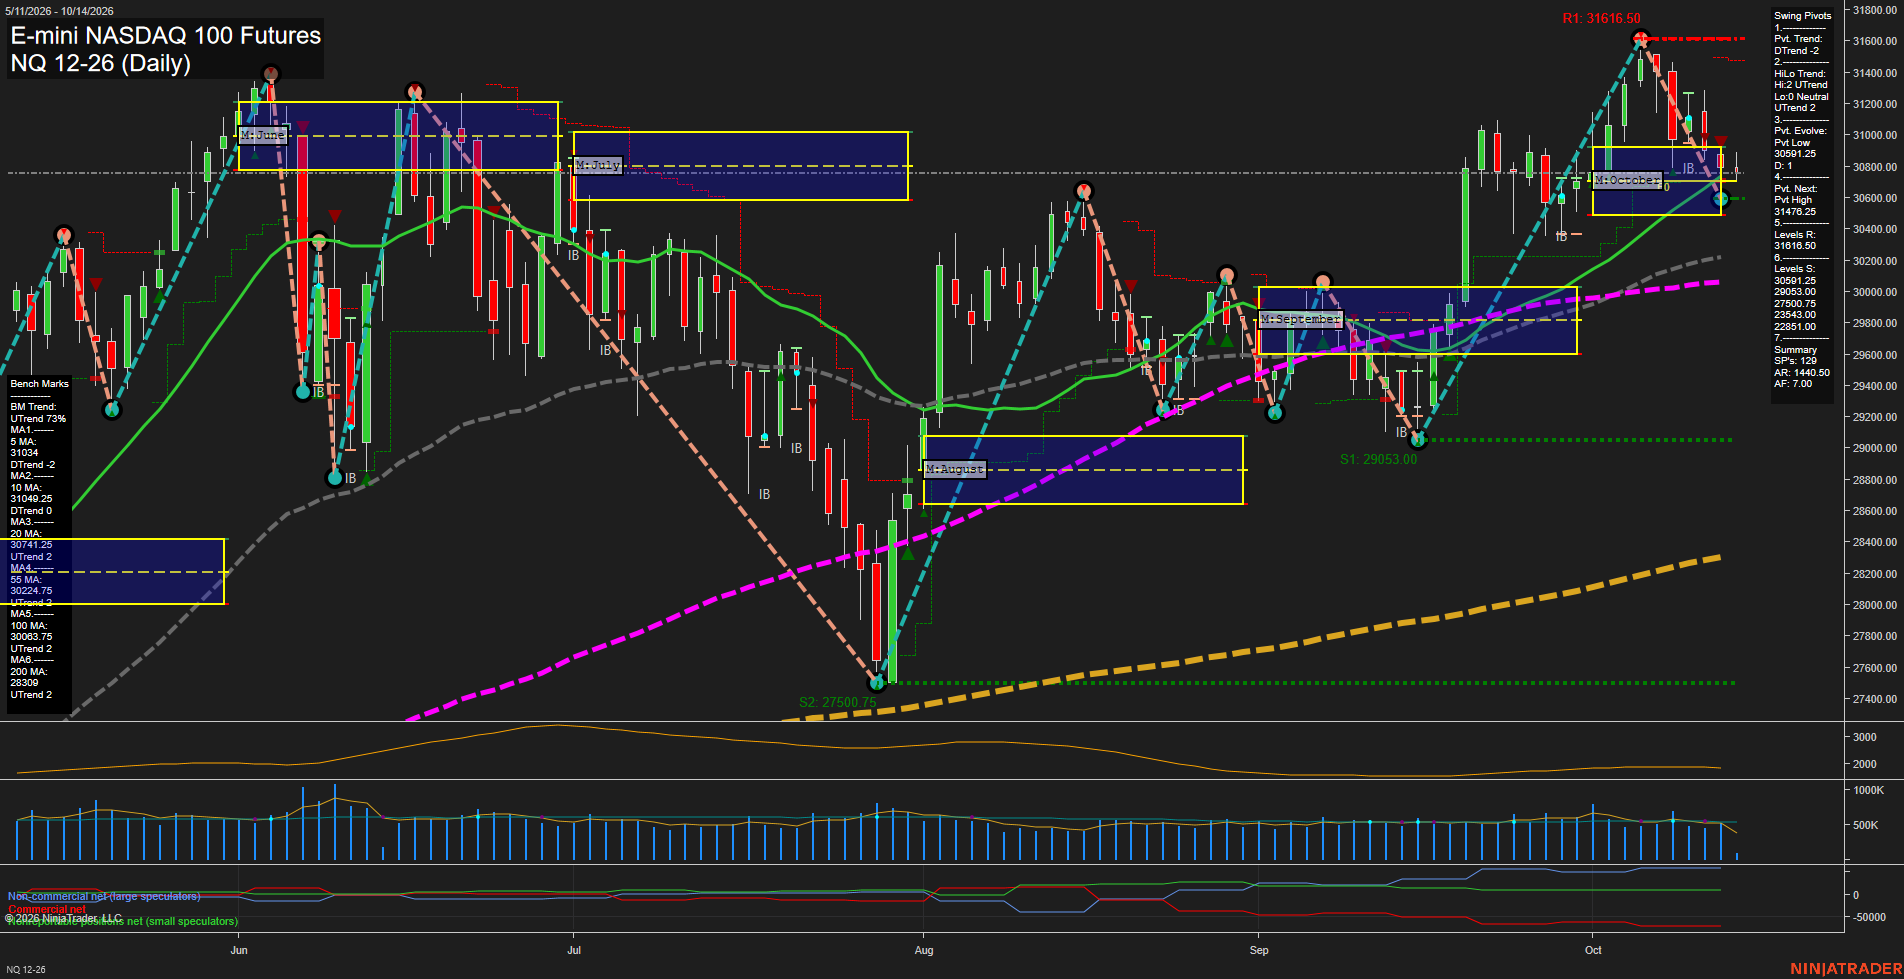
- NQ: YSFG above F0%, MSFG/WSFG below centers; benchmarks broadly rising, 31617 pivot-high resistance, 30512-30591 support, 29459 pivot-low.
- YM: YSFG/MSFG upward, WSFG corrective; short benchmarks recovering, longer benchmarks rising; 52612-52849 resistance, 51470 reversal, 50859 support.
- EMD: YSFG/MSFG above F0%, WSFG below F0%; short benchmarks declining, longer weekly benchmarks rising; 3716-3738 resistance, 3624-3600 support.
- RTY: YSFG above F0%, MSFG/WSFG below F0%; price below daily benchmarks, 2858 reversal, 2887-2931 resistance, 2779-2768 support.
- FDAX: YSFG/MSFG/WSFG upward; short daily benchmarks rising, intermediate benchmarks declining; 25589 resistance, 24925 pivot-low support, 26243 reversal.
Overall State
- Short-Term: Bearish
- Intermediate-Term: Neutral
- Long-Term: Bullish
Conclusion
HTF alignment remains broadly upward in ES, NQ, YM, and FDAX through YSFG/MSFG positioning and longer benchmark structure. NQ, EMD, and RTY retain short-term downward pivot alignment, while ES consolidates below resistance. YM and FDAX show short-term recovery structures. RTY remains the weakest correlation, holding below MSFG/WSFG reference areas and daily benchmarks. Key swing support zones are active across EMD and RTY, while ES and NQ remain positioned beneath major pivot-high resistance.
Note: Intra-day counter-trend pullbacks or retracements may occur, HTF is context for informational usage and market structure. Glossary: Session Fib Grids periods of YSFG:’Yearly’, MSFG:’Monthly’, WSFG:’Weekly’
For full details visit: AlphaWebTrader Technicals
ES Daily View
Overall Rating
- Short-Term: Neutral
- Intermediate-Term: Bullish
- Long-Term: Bullish.
Key Insights Summary
Price is consolidating beneath the 7897.50-7902.25 pivot-resistance band after a sharp October recovery. Short-term structure remains mixed because price is below the weekly Fib-grid center zone and momentum has slowed, while the pivot trend remains upward and price holds above all daily benchmark averages. Intermediate and long-term conditions remain constructive, supported by rising 20-, 55-, 100-, and 200-day averages, an upward monthly and yearly Fib-grid position, and a sequence of higher-level support zones. The 7754 pivot-reversal area and 7672.75 support are the principal downside structure levels beneath the current consolidation.
View charts on: AlphaWebTrader HTF Charts
NQ Daily View
Overall Rating
- Short-Term: Bearish
- Intermediate-Term: Neutral
- Long-Term: Bullish.
Key Insights Summary
Price remains below the weekly and monthly Fibonacci center zones and beneath the declining 5-day and 10-day benchmarks, reflecting a short-term pullback from the 31616.50 pivot high. The developing 30512 pivot low and nearby 30591.25 support define the immediate downside structure, while 31476.25 is the reversal threshold for a new short-term pivot high. Intermediate structure remains constructive because price is holding near the rising 20-day average and above the rising 55-day, 100-day, and 200-day benchmarks. The recent decline is a counter-trend retracement within the broader 2026 uptrend, with elevated ATR indicating a wide daily swing environment.
View charts on: AlphaWebTrader HTF Charts
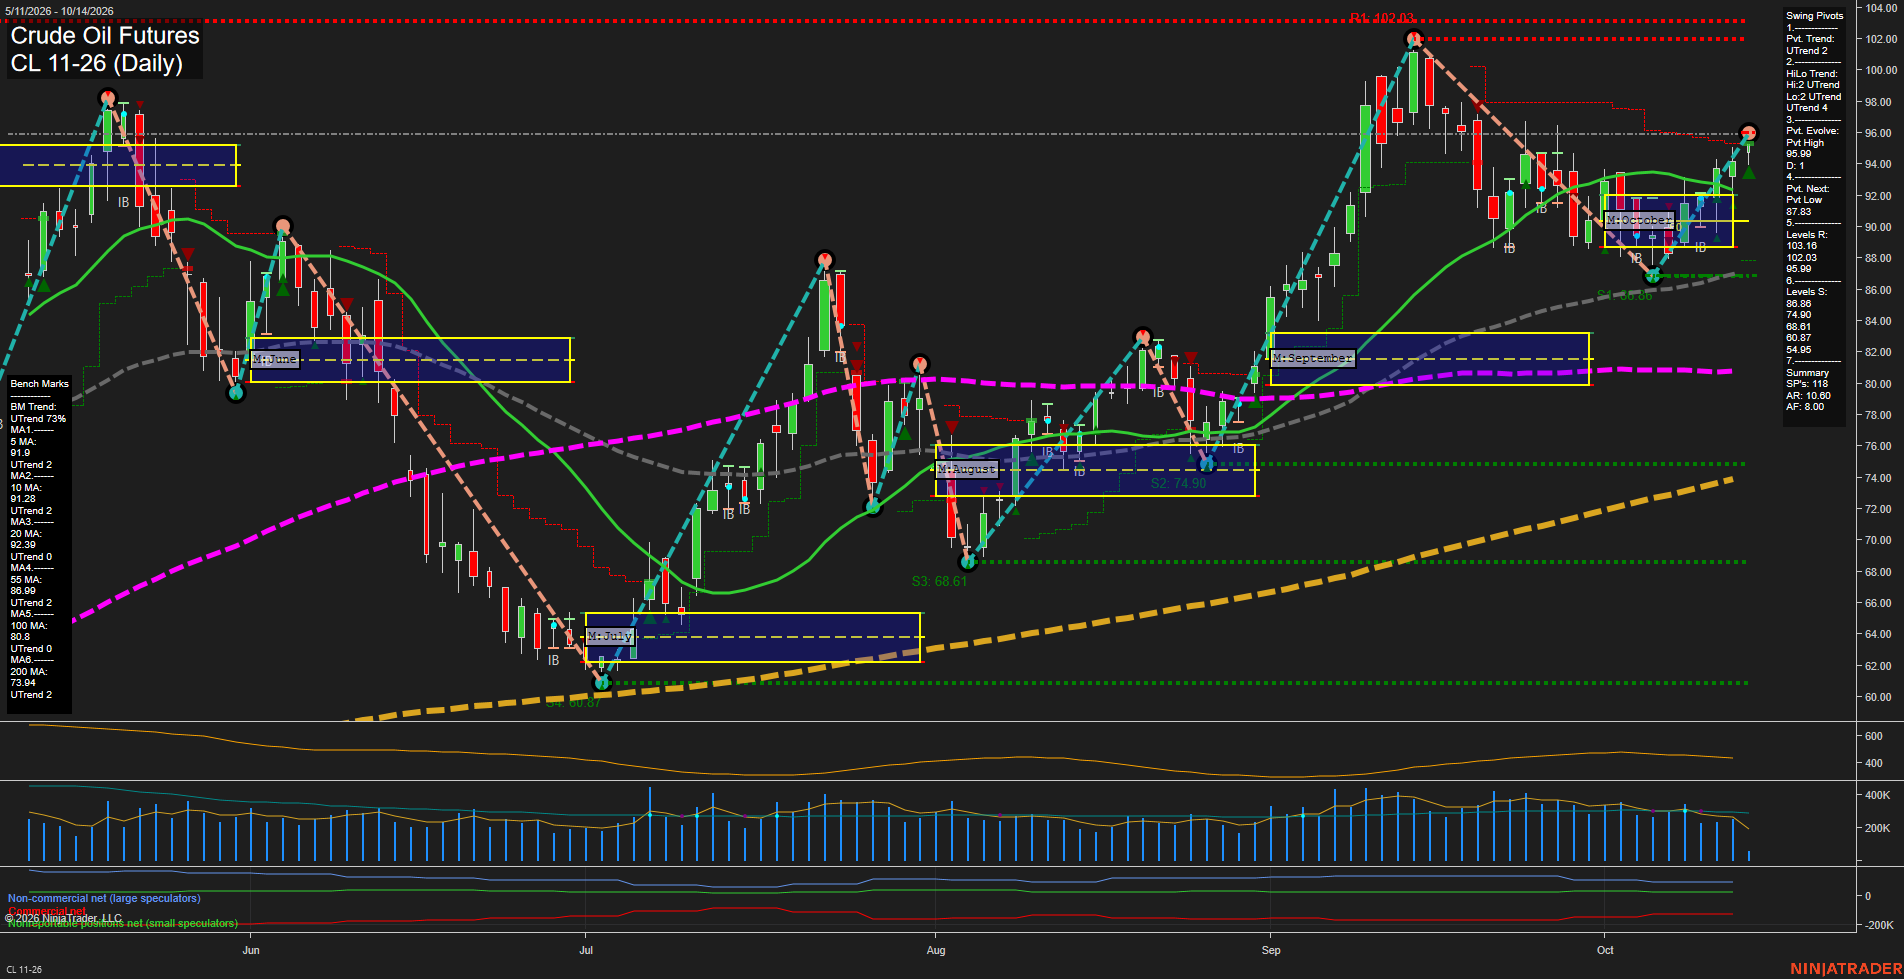
CL Daily View
Overall Rating
- Short-Term: Bullish
- Intermediate-Term: Bullish
- Long-Term: Bullish.
Key Insights Summary
Price is in a broad bullish swing structure, with the latest recovery extending from the 87.83 pivot low to a new evolving pivot high at 95.99. Price is above all six rising daily benchmarks and above both weekly and monthly F0%/NTZ reference areas. The near-term structure shows higher lows and renewed upside momentum after the early-October pullback, while 95.99 is the immediate pivot resistance and 102.03 is the larger overhead swing-resistance level. The 86.86 to 87.83 area remains the defining lower swing reference beneath the current advance.
View charts on: AlphaWebTrader HTF Charts
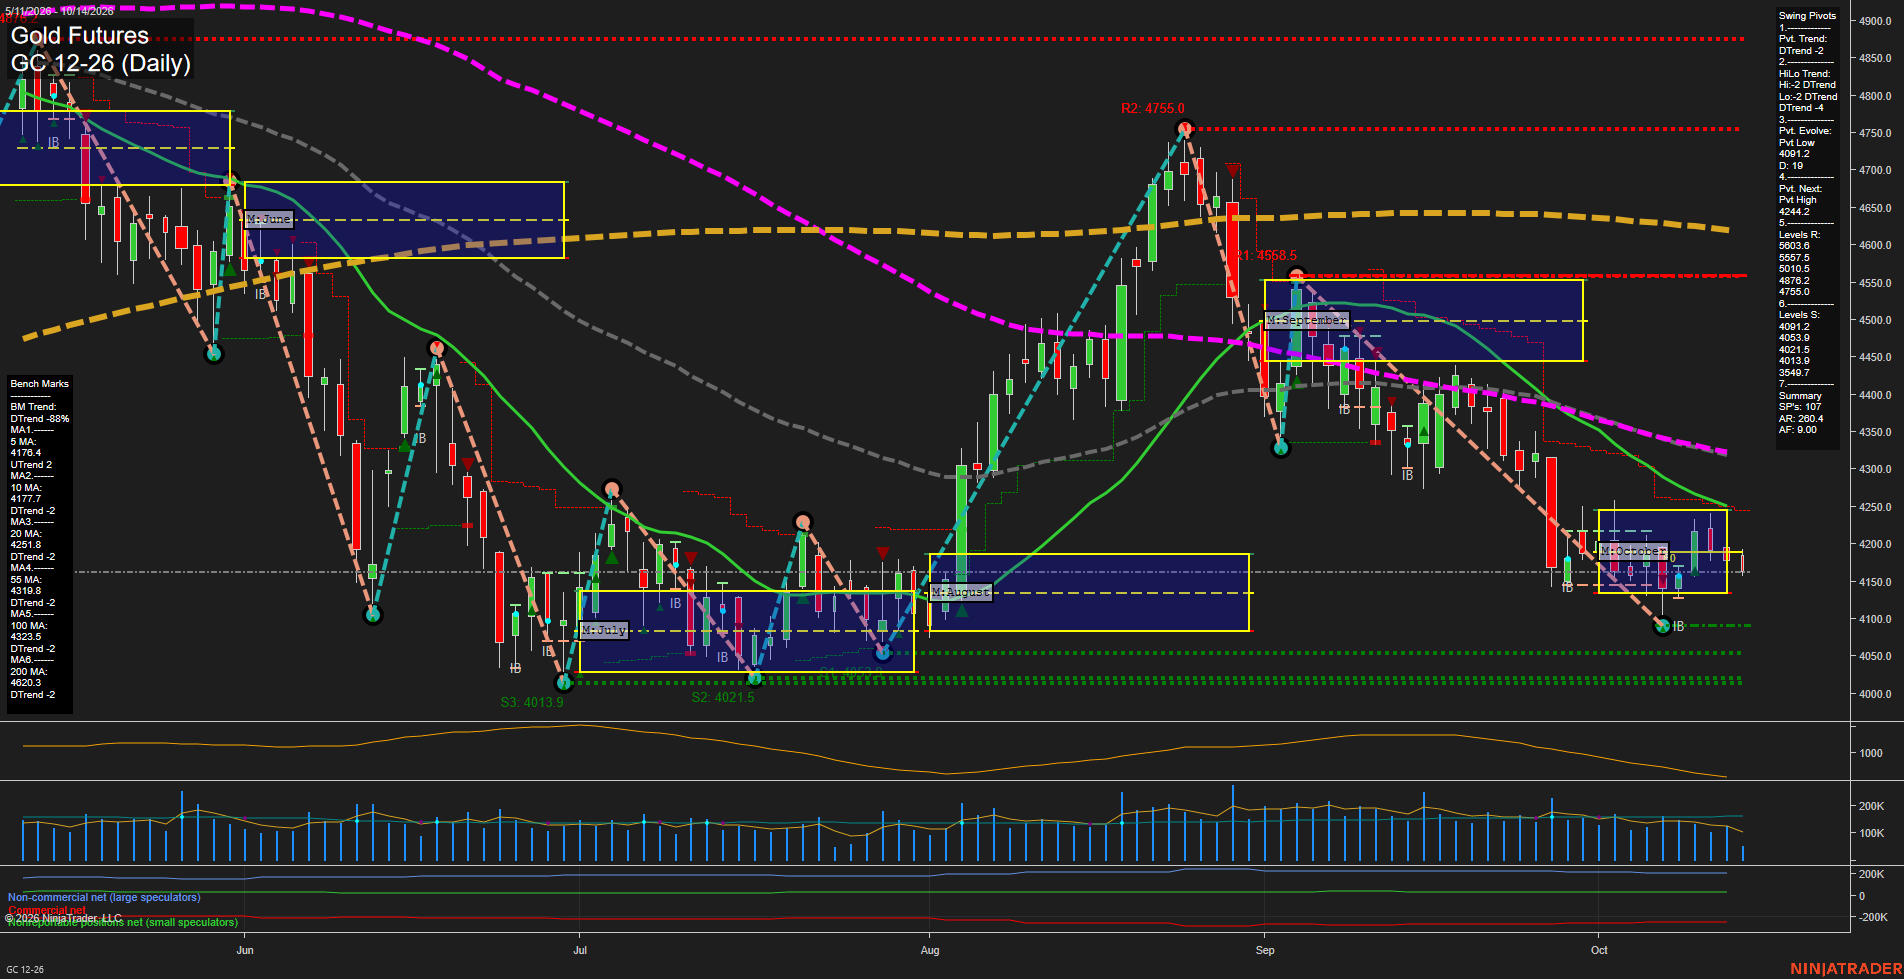
GC Daily View
Overall Rating
- Short-Term: Bearish
- Intermediate-Term: Bearish
- Long-Term: Bearish.
Key Insights Summary
Gold remains in a broad daily-chart decline following the rejection from the 4755 pivot high. Price is below the weekly, monthly, and yearly Fib-grid reference zones and below every intermediate- and long-term benchmark, while both pivot trend measures remain in DTrend. Recent candles show a narrow, choppy consolidation around the October grid near 4150-4200 after the sharp late-September selloff. The 4091.2 pivot low is the nearest structural support, while 4244.2 is the next pivot-reversal threshold and the 4251.8 20-day average closely reinforces that overhead area. The short-term 5-day average has turned higher near price, indicating a modest countertrend stabilization, but the 10-day and all broader averages remain declining. Volume has moderated from the September expansion, consistent with consolidation rather than a confirmed upside trend transition.
View charts on: AlphaWebTrader HTF Charts
ZB Daily View
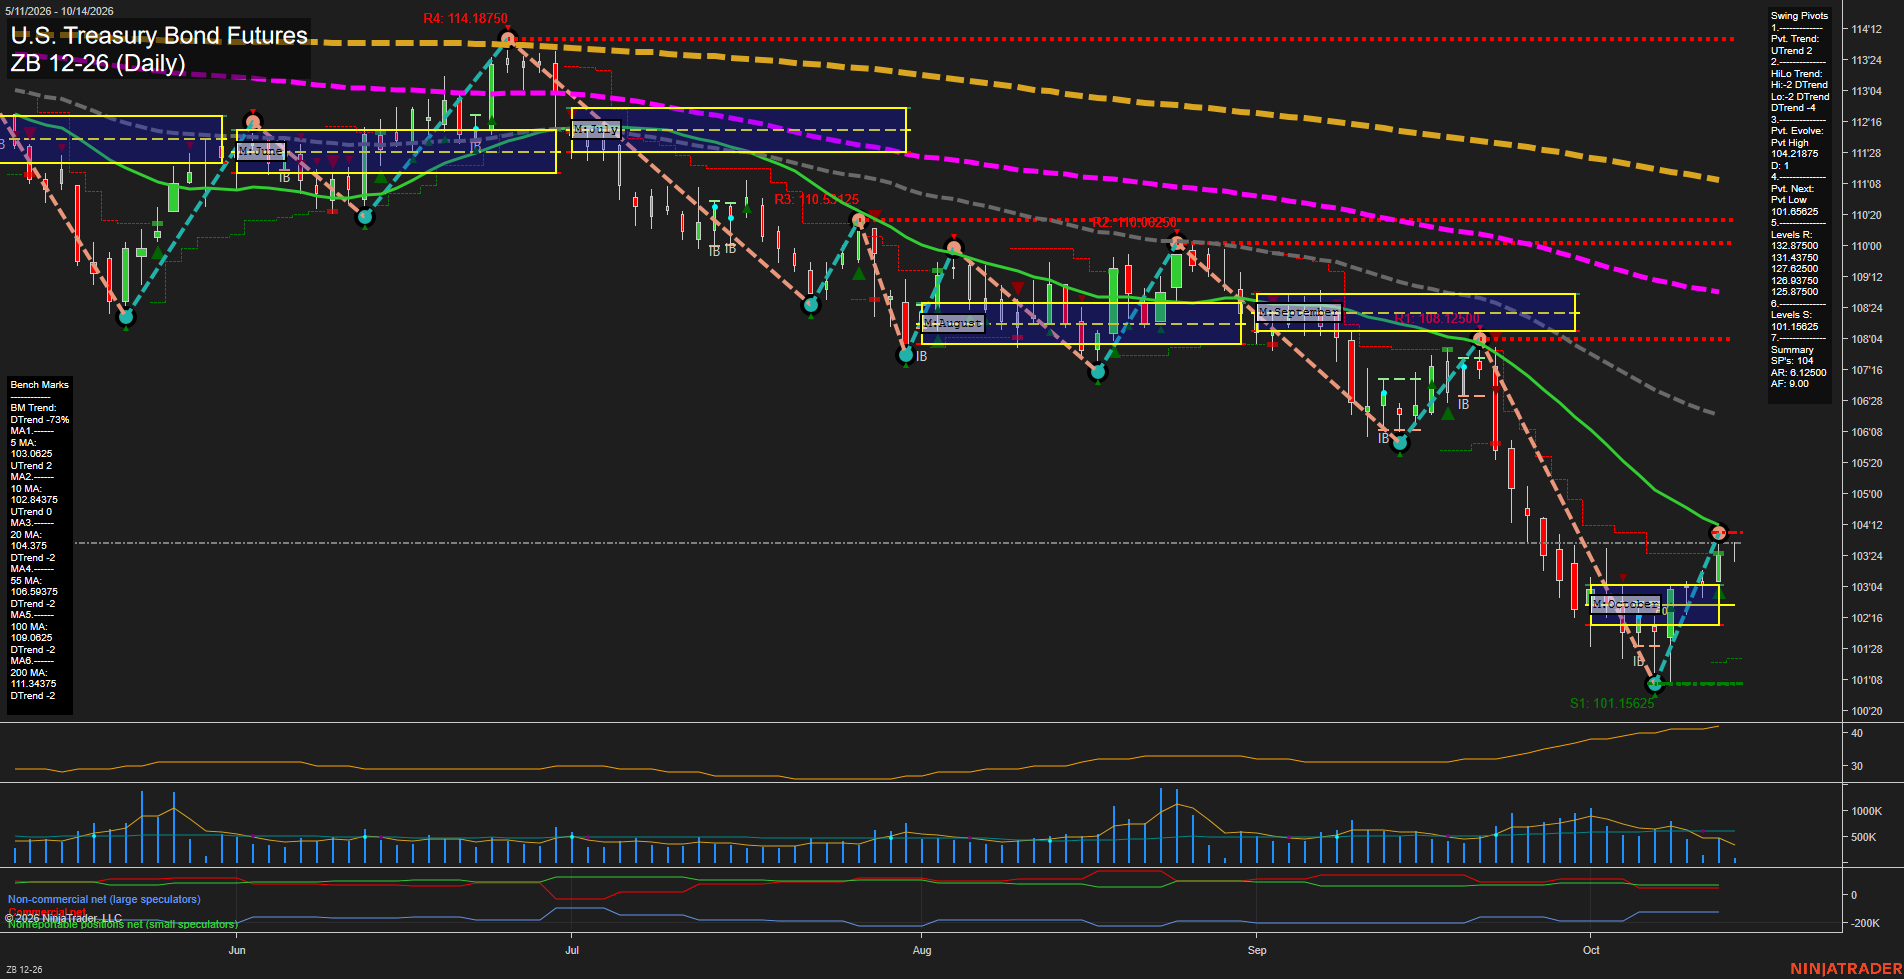
Overall Rating
- Short-Term: Bullish
- Intermediate-Term: Bearish
- Long-Term: Bearish.
Key Insights Summary
Price is staging a sharp short-term V recovery from the early-October 101.15625 swing-low area, supported by an UTrend pivot structure, rising weekly and monthly fib-grid alignment, and closes above the 5-day and 10-day benchmarks. The rebound has reached the 104.37500 pivot-high and 20-day moving-average area, where the latest small bars indicate consolidation after fast upside momentum. The broader structure remains a countertrend rally within an intermediate and long-term decline: the HiLo trend is down and price remains below the falling 20-, 55-, 100
View charts on: AlphaWebTrader HTF Charts