NYSE pre-market futures are mixed as ES and NQ pull back, YM rebounds, and markets track bank earnings, CPI, oil and Middle East risks.
Fundamentals: U.S. equity futures showed a mixed tone before the open, with Dow futures firmer while S&P 500 and Nasdaq 100 contracts were muted to lower. Third-quarter results from Goldman Sachs, JPMorgan Chase and Wells Fargo focused attention on banks as technology shares weakened. Oil eased on Russian diesel-supply news, while Middle East tensions, CPI and yields remained key market variables.
Technicals: U.S. index futures enter the NYSE pre-market session with diverging short-term conditions. ES and NQ remain in pullbacks beneath recent highs despite constructive longer-term trends, while YM has rebounded. EMD and RTY retain weaker near-term structures; FDAX shows a short-term recovery within a broader consolidation. Key pivot, average and Fib-grid levels frame the session.
Pre-Market Trading 360° view Market Radar of: holidays, earnings, eco-news, market-news summary, news sentiment, prior session major ETFs, MAG7, Higher Time Frame Analysis Indices Futures Summary, and E-mini S&P500, Nasdaq 100, NYMEX Crude, Gold Futures Daily Chart analysis.
As of: October 13, 2026 07:16 CT
Earnings Radar
Monitoring for earnings releases by the Magnificent 7, AI-tech-related firms, and major financial institutions.
- BAC Release: 2026-10-14 T:BMO
- MS Release: 2026-10-14 T:BMO
- C Release: 2026-10-13 T:BMO
- GS Release: 2026-10-13 T:BMO
- JPM Release: 2026-10-13 T:BMO
- WFC Release: 2026-10-13 T:BMO
Conclusion: JPM, GS, C and WFC reported before the 2026-10-13 open, concentrating financial-sector index sensitivity at the start of the session. BAC and MS report before the 2026-10-14 open, extending bank and broker earnings-driven market focus into the next day; no MAG7, AI, semiconductor, or major tech releases are listed.
For full details visit: Yahoo Earnings Calendar
EcoNews Radar U.S. Events
| Day | Time | Impact | Event |
|---|---|---|---|
| Wed | 08:30 | High | Core CPI m/m |
| Wed | 08:30 | High | Core CPI y/y |
| Wed | 08:30 | High | CPI m/m |
| Wed | 08:30 | High | CPI y/y |
| Thu | 08:30 | High | Core PPI m/m |
| Thu | 08:30 | High | Core Retail Sales m/m |
| Thu | 08:30 | High | PPI m/m |
| Thu | 08:30 | High | Retail Sales m/m |
| Thu | 08:30 | Medium | Philly Fed Manufacturing Index |
| Thu | 08:30 | Medium | Unemployment Claims |
| Thu | 12:00 | Low | Crude Oil Inventories |
| Thu | 23:30 | High | Fed Chairman Warsh Speaks |
EcoNews Summary
Wednesday’s 08:30 CPI release is the week’s central high-impact macro event, followed by Thursday’s 08:30 inflation, consumer-spending, and activity data. These releases provide key inputs on price pressures, household demand, and the economic backdrop monitored across index futures markets. Thursday night’s Fed Chairman Warsh remarks add a policy-communication risk event.
Event Notes:
- Wednesday 08:30 – Core CPI m/m and y/y: Measures monthly and annual consumer-price changes excluding food and energy. Traders monitor underlying inflation pressure and its relevance for monetary-policy expectations.
- Wednesday 08:30 – CPI m/m and y/y: Measures monthly and annual changes in broad consumer prices. It is a major inflation gauge with broad implications for interest-rate expectations and equity-index valuation.
- Thursday 08:30 – Core PPI m/m: Measures monthly producer-price changes excluding food and energy. It tracks underlying cost pressures within the supply chain.
- Thursday 08:30 – PPI m/m: Measures monthly changes in prices received by domestic producers. Traders monitor it for evidence of upstream inflation pressure.
- Thursday 08:30 – Core Retail Sales m/m: Measures monthly retail-sales growth excluding volatile components. It provides a view of underlying consumer spending.
- Thursday 08:30 – Retail Sales m/m: Measures monthly changes in retail spending. It is a timely indicator of consumer demand and economic activity.
- Thursday 23:30 – Fed Chairman Warsh Speaks: Public remarks from the Federal Reserve Chairman. Traders monitor policy-related comments, inflation discussion, and economic assessments for changes in rate-expectation pricing.
Conclusion:
The single most important event is Wednesday’s 08:30 CPI release. Market momentum and volume often slow ahead of CPI, with increased volatility at release time. Thursday’s 08:30 cluster of PPI and retail-sales data extends the focus on inflation and consumer-demand conditions, while Chairman Warsh’s remarks close the listed high-impact schedule.
For full details visit: Forex Factory EcoNews
Market News Summary:
Index futures were muted to mixed as investors weighed bank earnings, technology-sector weakness, geopolitical tensions, and energy supply developments.
Primary Drivers & Risks:
- Primary Driver: Bank earnings and technology rotation
- Primary Risk: Geopolitical escalation and energy disruption
Tone:
Cautious, with sector rotation and event-driven cross-currents.
Stock Market / ETFs / Indices:
S&P 500 and Nasdaq 100 futures were lower or muted, while Dow futures gained early Tuesday. Chip weakness and a technology selloff accompanied rotation toward banks as third-quarter bank earnings began. Japan’s Nikkei fell 2.0% amid geopolitical tensions, while China A-shares faced a sharp correction tied to tighter liquidity and weak buying interest.
Geopolitical:
Risk appetite was pressured by Middle East tensions following strikes on Riyadh’s airport and Saudi-Houthi conflict concerns. Safe-haven demand supported the U.S. dollar against Asian currencies. A reported Russia-Ukraine energy ceasefire added a separate geopolitical and commodity-market variable.
Oil / Energy:
Crude prices eased after prior gains as traders assessed Russia’s agreement to increase diesel supplies to global markets. The decline was tempered by shipping risks, Saudi-Houthi tensions, and broader Middle East supply concerns. OPEC raised its 2027 oil-demand view, citing the need to rebuild inventories.
Gold / Metals:
Gold declined in early Asian trade as markets awaited U.S. inflation data and major bank earnings. Later commentary cited easing Treasury yields ahead of CPI, with gold holding above $4,155; silver tested trendline resistance amid investment demand.
Fed / Financials:
Major bank earnings were the main near-term equity catalyst. Rate uncertainty remained relevant in fixed income, with short-duration Treasury exposure presented as less price-volatile than long-duration bonds. Inflation data remained a key macro event for yields and precious metals.
Macro / Other:
China smartphone shipments declined for a sixth consecutive quarter, adding evidence of continued weakness in that consumer-electronics market. European carmakers were also reported to be adapting strategy to compete with Chinese electric-vehicle rivals.
Conclusion:
Bank earnings, technology weakness, and the inflation-data wait shaped U.S. index-futures sentiment. Asian equity declines and mixed U.S. futures reflected restrained risk appetite.
Oil’s pullback on prospective Russian diesel supply offset some energy-risk pressure, while Middle East conflict and shipping risks remained active cross-currents. Dollar safe-haven demand, yields, and gold pricing remained sensitive to geopolitical and CPI developments.
Market News Sentiment
Market News Articles: 47
- Neutral: 57.45%
- Negative: 25.53%
- Positive: 17.02%
Sentiment Summary: Among 47 market news articles, 57% were neutral, 26% negative, and 17% positive, indicating predominantly neutral coverage with a negative skew over positive items.
Conclusion: Indices futures day traders are facing a largely neutral news environment, with negative articles outnumbering positive articles.
GLD,Gold Articles: 9
- Negative: 44.44%
- Neutral: 33.33%
- Positive: 22.22%
Sentiment Summary: Gold coverage is predominantly negative (44%), with 33% neutral and 22% positive across 9 articles.
Conclusion: The gold news tone is negative overall, while neutral coverage remains a significant share.
USO,Oil Articles: 15
- Negative: 40.00%
- Positive: 33.33%
- Neutral: 26.67%
Sentiment Summary: USO/Oil coverage is mixed with a negative tilt: 40% negative, 33% positive, and 27% neutral across 15 articles.
Conclusion: For indices futures day traders, oil-related news tone is modestly negative overall, with substantial positive and neutral coverage also present.
Market Data Snapshot
ETF Snapshot of major stock market ETFs, Mag7, and others as of: October 13, 2026 07:16
Top Movers & Losers
- META 742.96 Bullish 3.38% ▲
- USO 151.03 Bullish 1.91% ▲
- AAPL 340.97 Bullish 1.29% ▲
- AMZN 259.53 Bearish -1.11% ▼
- TSLA 378.03 Bearish -1.22% ▼
- NVDA 226.32 Bearish -1.29% ▼
Major Index ETFs: SPY, QQQ, DIA, IWM, IJH
- DIA 517.91 Bullish 0.35% ▲
- SPY 778.10 Bearish -0.06% ▼
- IJH 73.16 Bearish -0.37% ▼
- IWM 277.90 Bearish -0.37% ▼
- QQQ 746.04 Bearish -0.70% ▼
Mixed index ETF snapshot: DIA is the most bullish mover at +0.35%, while QQQ is the most bearish mover at -0.70%. SPY is marginally Bearish at -0.06%; IJH and IWM are Bearish, each at -0.37%.
Mag 7 Stocks: AAPL, MSFT, GOOG, AMZN, META, NVDA, TSLA
- META 742.96 Bullish 3.38% ▲
- AAPL 340.97 Bullish 1.29% ▲
- MSFT 541.15 Bullish 1.14% ▲
- GOOG 348.97 Bullish 0.32% ▲
- AMZN 259.53 Bearish -1.11% ▼
- TSLA 378.03 Bearish -1.22% ▼
- NVDA 226.32 Bearish -1.29% ▼
Mixed Mag7 snapshot: META is the most bullish mover at +3.38%, followed by AAPL +1.29% and MSFT +1.14%; GOOG is modestly Bullish at +0.32%. NVDA is the most bearish mover at -1.29%, with TSLA at -1.22% and AMZN at -1.11%.
Cross-Market ETFs: TLT, GLD, USO, IBIT
- USO 151.03 Bullish 1.91% ▲
- IBIT 46.86 Bullish 0.67% ▲
- TLT 78.05 Bullish 0.09% ▲
- GLD 382.15 Bearish -0.63% ▼
USO is the most bullish mover at +1.91%, while IBIT adds +0.67%. TLT is marginally bullish at +0.09%. GLD is the most bearish mover, down -0.63%, leaving the group Mixed.
ETF, Mag7, and Cross-Market ETF Insights
Overall Tone
Mixed: large-cap leadership is selective while broad index ETFs and several major technology names are Bearish.
Equity ETFs and Mag7:
Major Index ETFs are mixed, with DIA +0.35% leading while SPY -0.06% is marginal, IJH and IWM each fall -0.37%, and QQQ declines -0.70%. Mag7 performance is selective: META is the most bullish mover at +3.38%, followed by AAPL +1.29%, MSFT +1.14%, and GOOG +0.32%; NVDA is the most bearish mover at -1.29%, with TSLA -1.22% and AMZN -1.11% also Bearish. Equities are selective rather than broadly aligned, with DIA positive but QQQ and smaller-cap ETFs negative.
Cross-Market ETFs:
Cross-market ETFs are mixed, led by USO as the most bullish mover at +1.91%, while IBIT gains +0.67% and TLT is marginally positive at +0.09%. GLD is the most bearish mover at -0.63%, diverging from gains in oil and bitcoin-linked exposure while equity index ETFs remain mixed.
Futures Indices – Higher Time Frame Analysis
Summary of the current state of US Indices Futures based on higher time-frame (HTF) technical analysis as of: 2026-10-13: 07:16 CT.
US Indices Futures
- ES YSFG/MSFG above F0%, WSFG short; benchmarks rising; 7906.25 resistance, 7749.50 and 7587.75 pivot support.
- NQ YSFG constructive, MSFG/WSFG below F0%; benchmarks broadly rising; 31616.50 resistance, 30804.75 and 29459.50 pivot supports.
- YM YSFG/MSFG/WSFG above F0%; recovery above short benchmarks; 52583-52844 resistance, 51421 and 50859 support.
- EMD YSFG/MSFG constructive, WSFG below F0%; declining short benchmarks; 3737.8 resistance, 3624.2 and 3600.3 support.
- RTY YSFG above F0%, MSFG/WSFG below; daily benchmarks and pivots bearish; 2859-2887.2 resistance, 2778.6-2768.4 support.
- FDAX YSFG/MSFG/WSFG above F0%; short rebound beneath intermediate benchmarks; 25589-25990 resistance, 24925-24897 support.
Overall State
- Short-Term: Bearish
- Intermediate-Term: Bullish
- Long-Term: Bullish
Conclusion
Higher-time-frame structure remains broadly bullish, led by ES, NQ, YM, and FDAX long-term benchmark and yearly-grid alignment. Short-term conditions are mixed to bearish, with ES and NQ consolidating below pivot highs, EMD and RTY retaining weaker daily pivot structures, and YM and FDAX rebounding from support. RTY remains the comparatively weaker instrument across daily and weekly structures. Key resistance remains near recent swing highs, while listed pivot-low areas define active support references.
Note: Intra-day counter-trend pullbacks or retracements may occur, HTF is context for informational usage and market structure. Glossary: Session Fib Grids periods of YSFG:’Yearly’, MSFG:’Monthly’, WSFG:’Weekly’
For full details visit: AlphaWebTrader Technicals
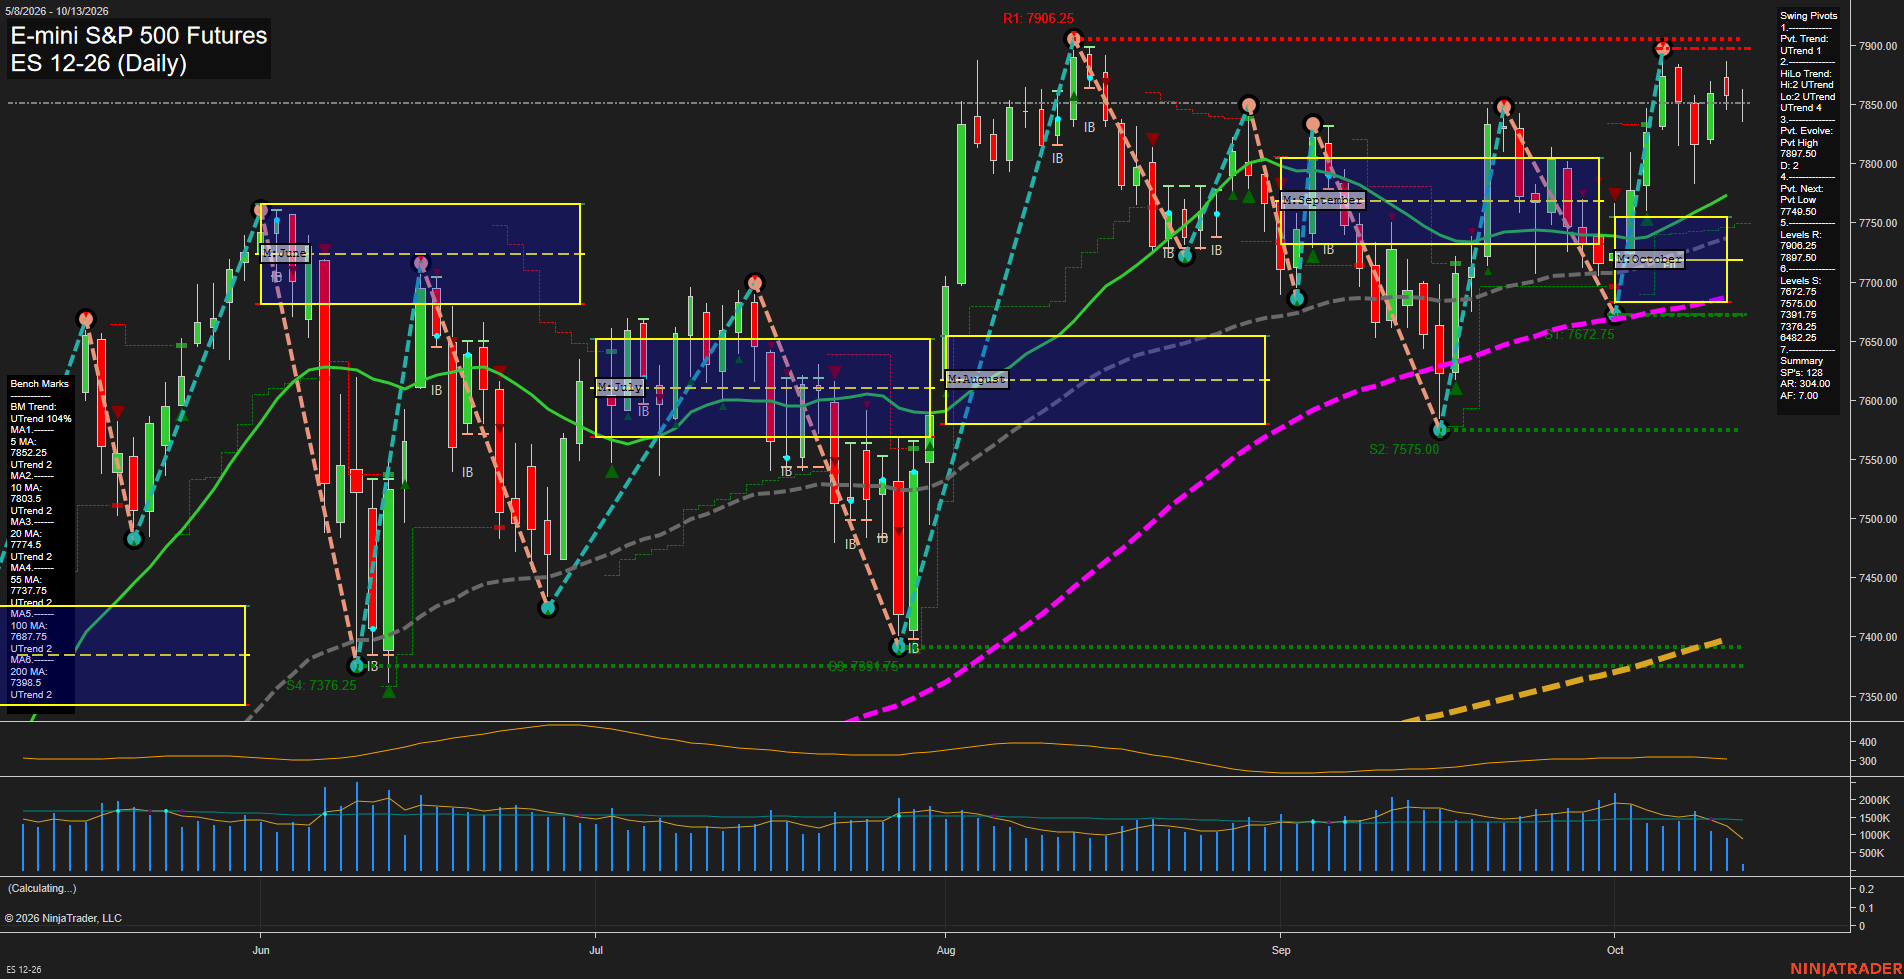
ES Daily View
Overall Rating
- Short-Term: Neutral
- Intermediate-Term: Bullish
- Long-Term: Bullish.
Key Insights Summary
Daily structure remains constructive, with both pivot trends rising and price holding above the rising 10-, 20-, 55-, 100-, and 200-day benchmarks. The near-term condition is mixed: price is slightly below the 5-day average, below the weekly F0%/NTZ area, and beneath clustered 7897.50-7906.25 pivot resistance following rejection from the recent high. This reflects a short-term consolidation/pullback within an intermediate and long-term uptrend. The 7749.50 pivot-next level and the rising 20-/55-day averages define the active lower structural area, while the October MSFG and yearly grid remain positively aligned above their F0% zones.
View charts on: AlphaWebTrader HTF Charts
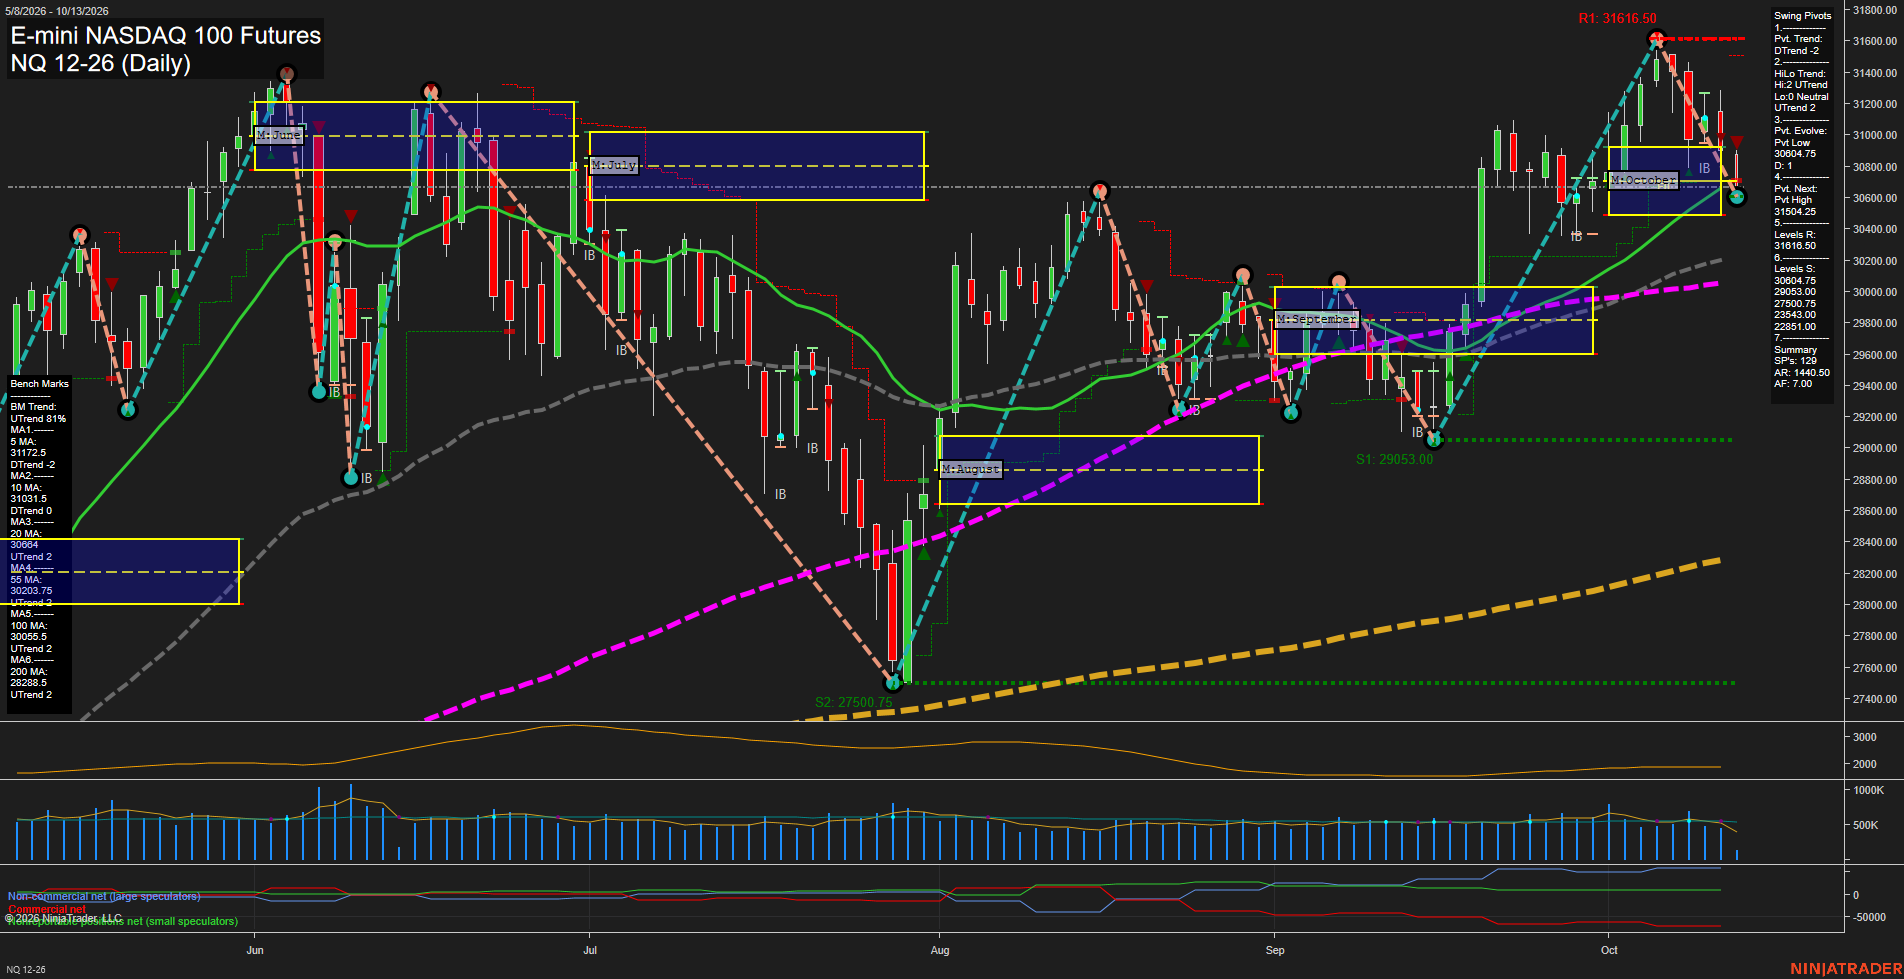
NQ Daily View
Overall Rating
- Short-Term: Bearish
- Intermediate-Term: Bullish
- Long-Term: Bullish.
Key Insights Summary
Price is in a short-term corrective downswing after rejecting the 31616.50 pivot high, with lower short-term benchmarks and negative weekly and monthly fib-grid positioning defining the immediate tone. The decline has reached the rising 20-day average area and the 30804.75 pivot-low reference, producing a bounce but not yet reversing the short-term DTrend. Intermediate and long-term structure remains constructive because price holds above the rising 20-, 55-, 100-, and 200-day averages, while the yearly grid remains strongly positive. The chart reflects a pullback within the broader advance, with 31504.25 to 31616.50 marking the principal overhead pivot-resistance zone and 29053.00 representing the next major structural support below the current swing area.
View charts on: AlphaWebTrader HTF Charts
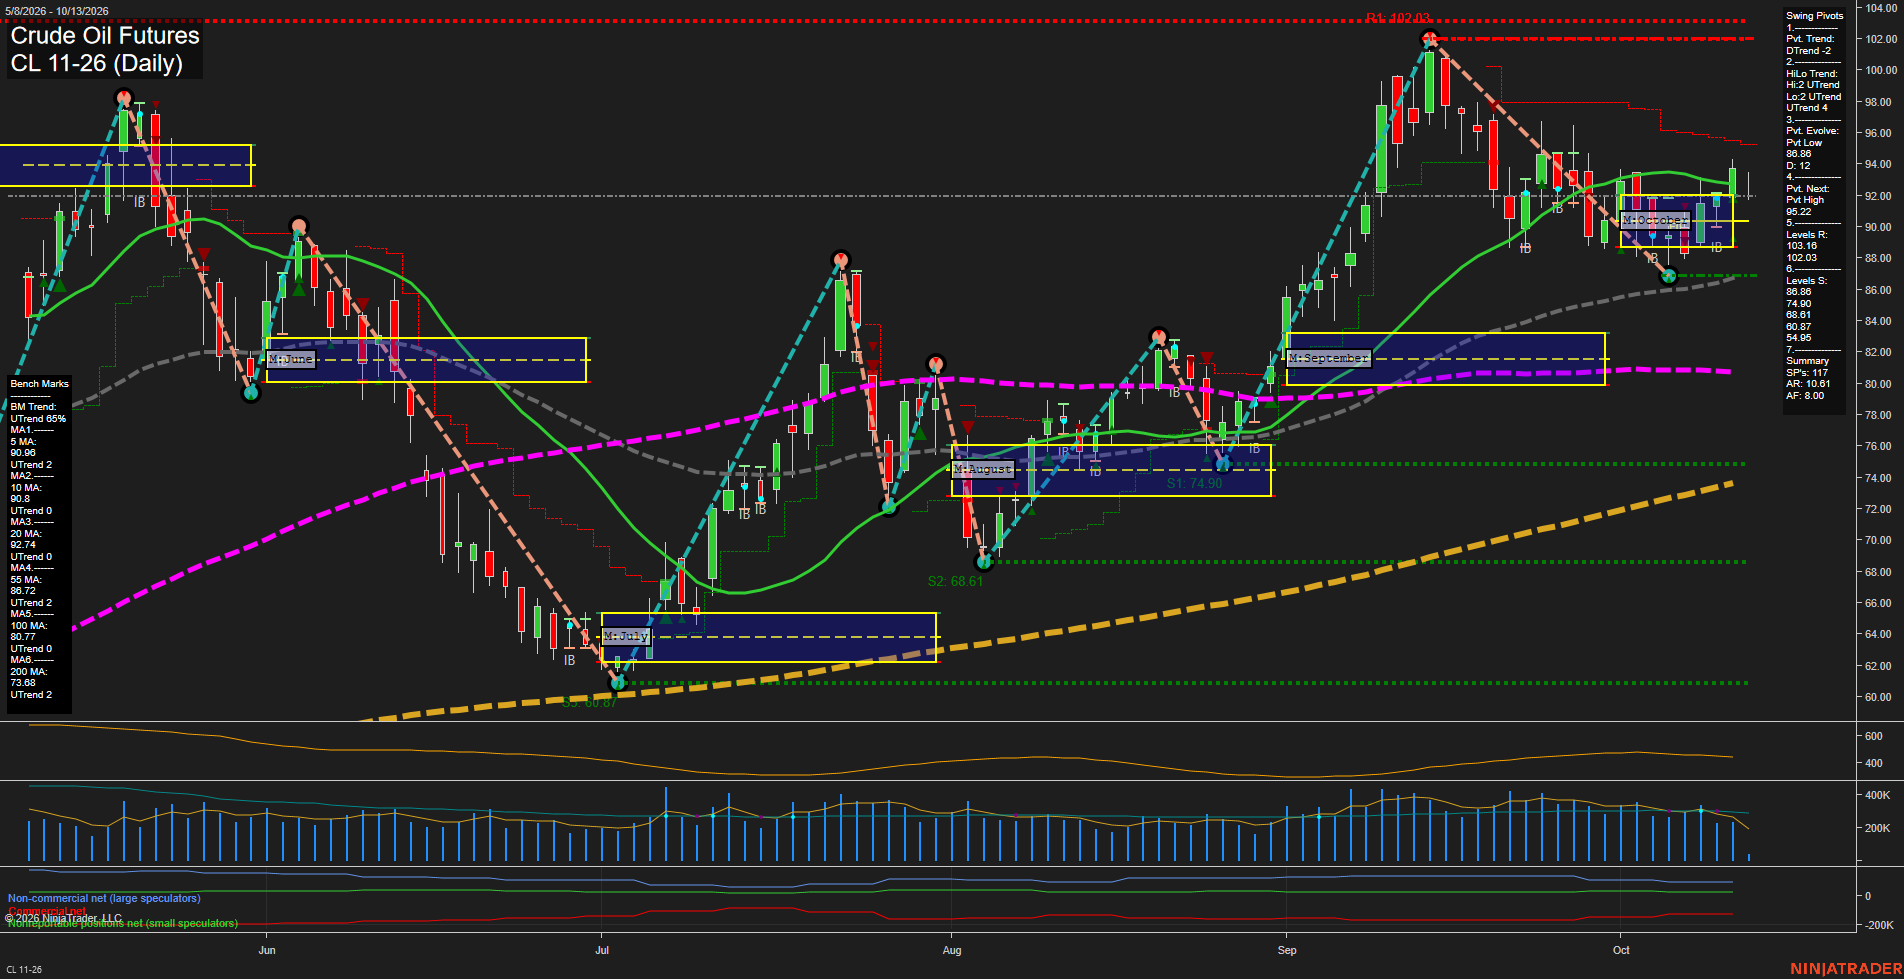
CL Daily View
Overall Rating
- Short-Term: Bullish
- Intermediate-Term: Bullish
- Long-Term: Bullish.
Key Insights Summary
Price has stabilized above the October monthly F0% area and is consolidating near the 20-day benchmark after the sharp September advance and subsequent pullback. The short-term pivot remains in DTrend from the 102.03 swing high, while the intermediate HiLo structure remains UTrend following the 86.86 higher low. Rising 5-, 10-, 20-, 55-, 100-, and 200-day benchmarks align with the positive weekly, monthly, and yearly fib-grid trends. The current structure is a recovery within a broader uptrend, with 95.22 defining the next upside pivot threshold, 102.03 the major overhead swing resistance, and 86.86 the principal nearby structural support.
View charts on: AlphaWebTrader HTF Charts
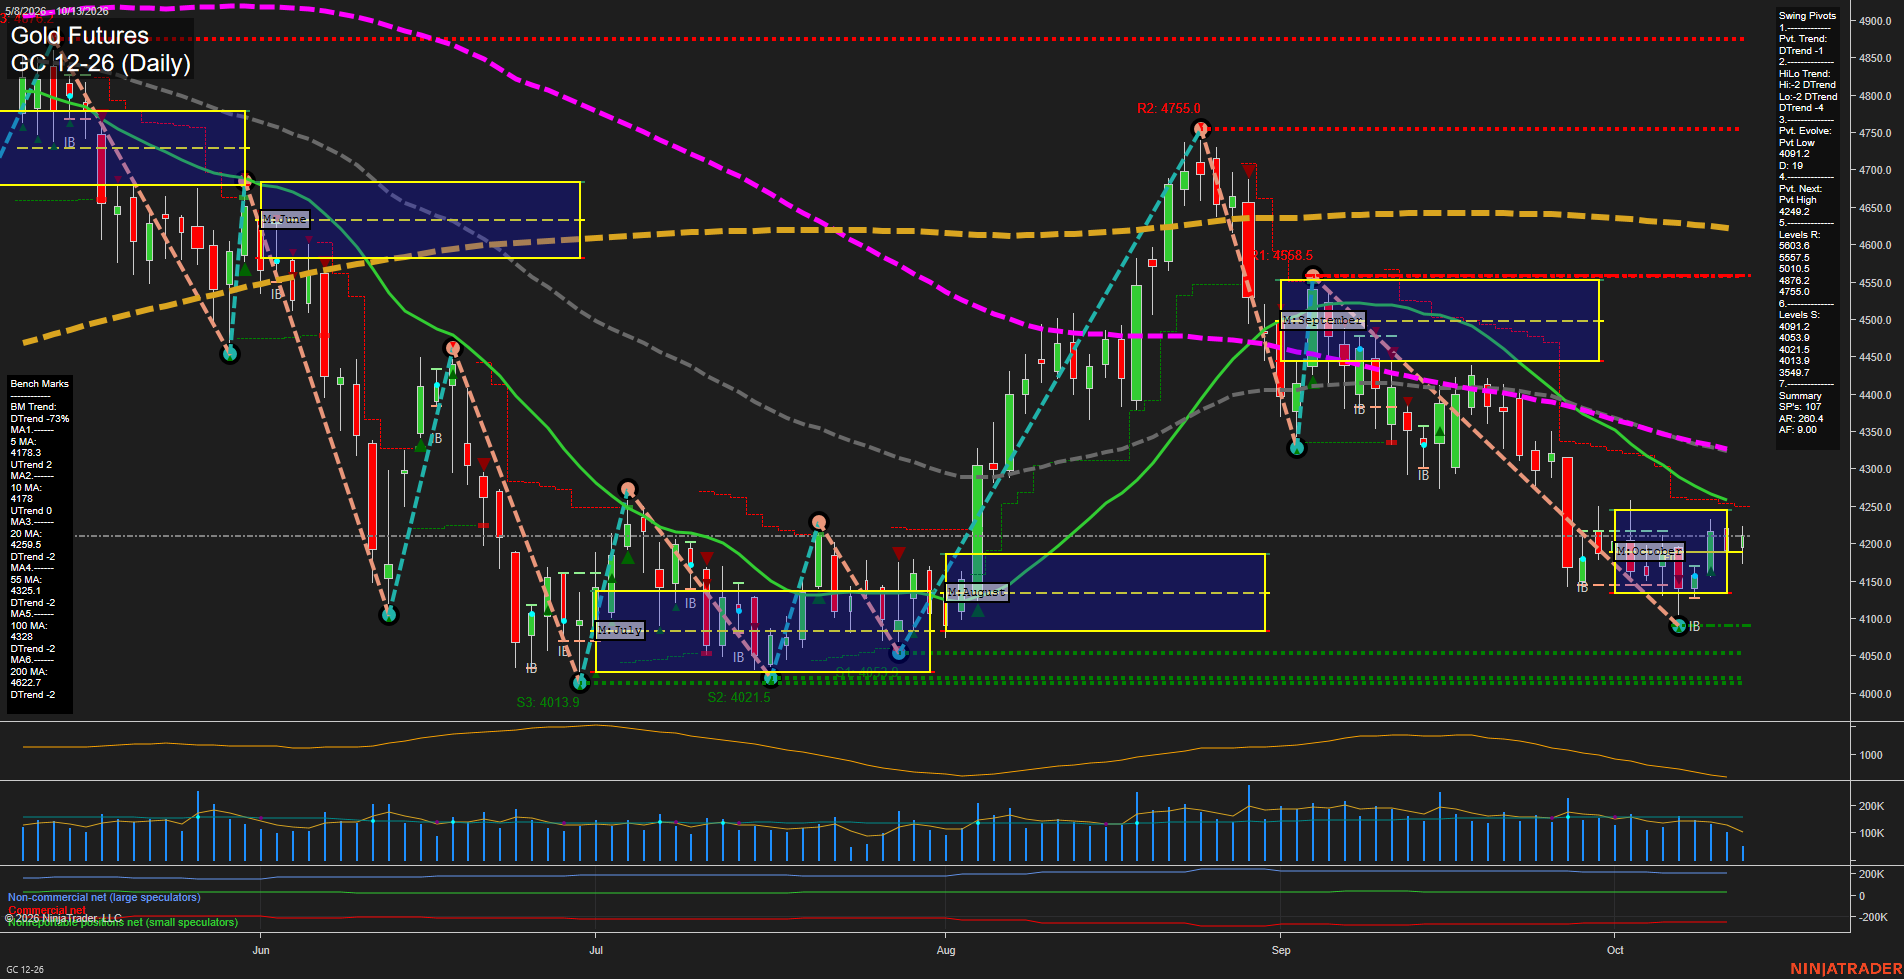
GC Daily View
Overall Rating
- Short-Term: Bearish
- Intermediate-Term: Bearish
- Long-Term: Bearish.
Key Insights Summary
Price is consolidating above the 4091.2 pivot low after a sharp September-to-October selloff, but the swing-pivot structure remains in DTrend and price remains beneath the declining 20, 55, 100, and 200-day benchmarks. The short-term 5 and 10-day averages have turned higher, reflecting a modest rebound from the October low, while the weekly grid remains below its F0% reference. The 4249.2 pivot-next level and declining 20-day average near 4259.5 define the nearby rebound ceiling; 4091.2, 4053.9, and the 4021.5-4013.9 support cluster frame the lower consolidation boundary. ATR remains elevated, indicating that daily swings are still broad despite the recent smaller candles and slowing momentum.
View charts on: AlphaWebTrader HTF Charts
ZB Daily View
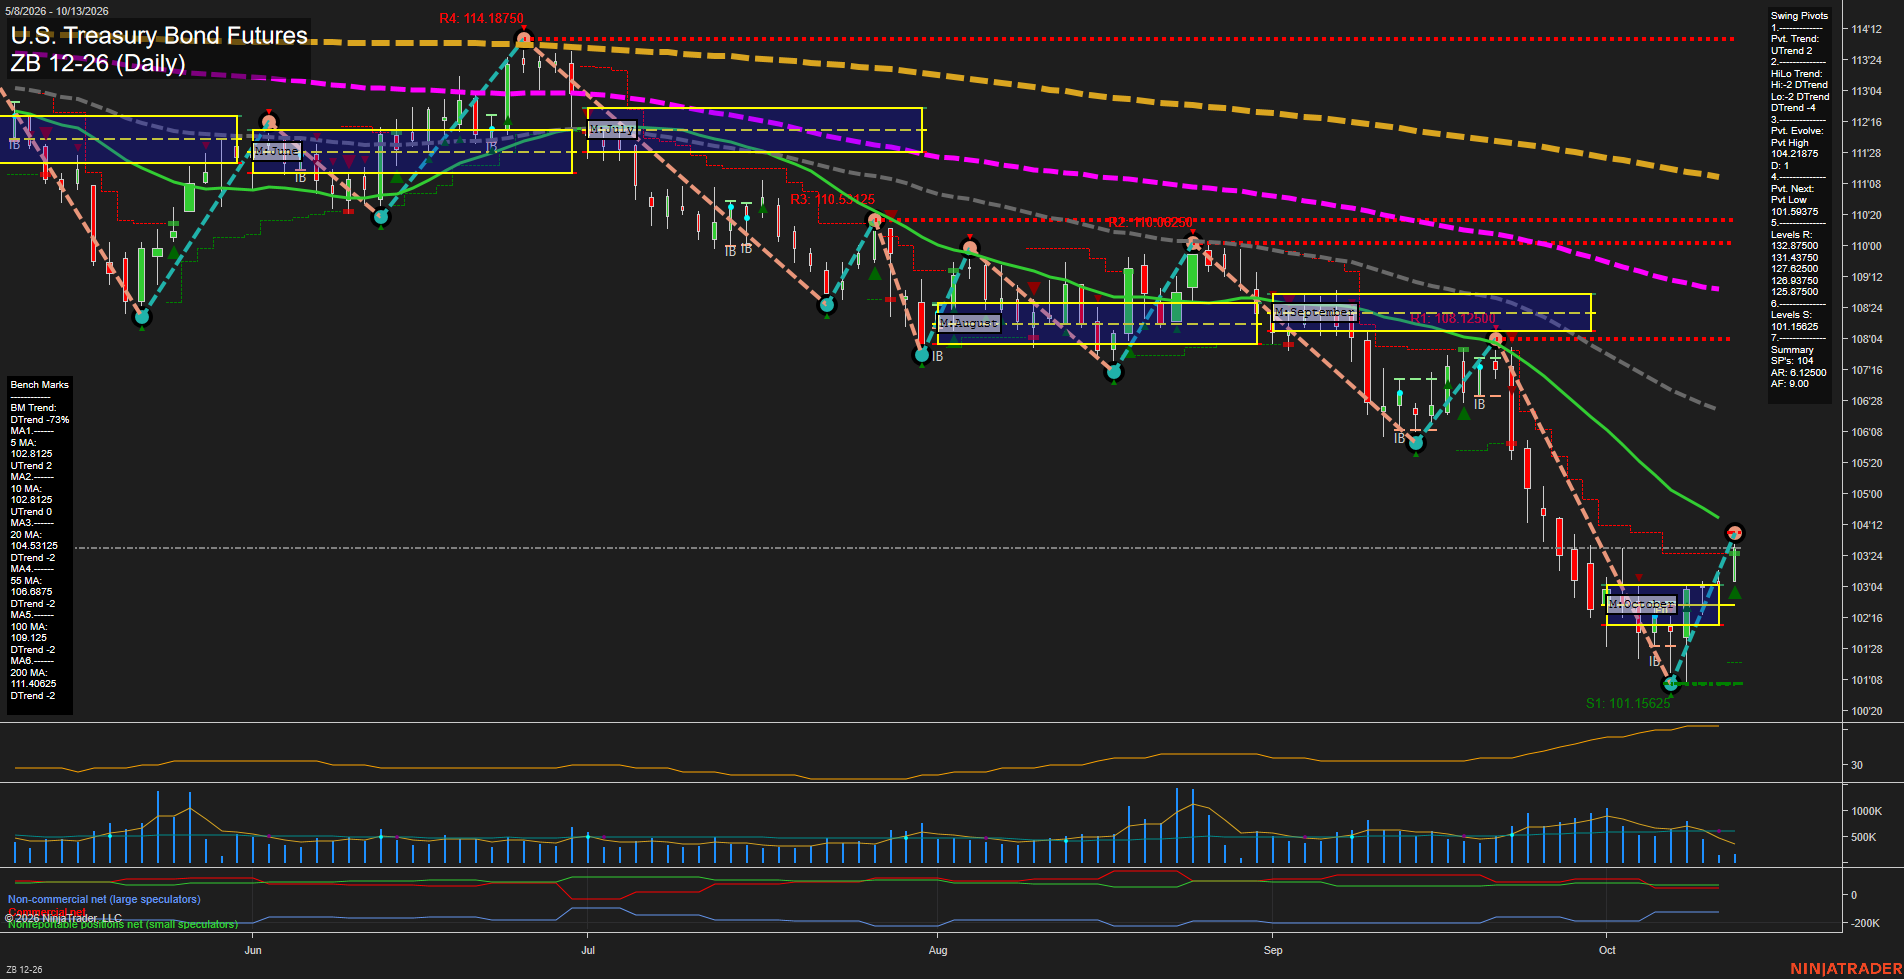
Overall Rating
- Short-Term: Bullish
- Intermediate-Term: Bearish
- Long-Term: Bearish.
Key Insights Summary
The market is in a sharp short-term rebound from the 101.15625 swing low, with price above the weekly F0% level, rising short-term benchmarks, and a current UTrend pivot sequence. The recovery remains a counter-trend rally within a broader intermediate- and long-term decline: price remains beneath the falling 20-, 55-, 100-, and 200-day averages, while the HiLo pivot trend and yearly grid remain down. The 104.1250 pivot-high area is the immediate structural ceiling, and the recent large-range advance reflects fast upside momentum after the October washout.
View charts on: AlphaWebTrader HTF Charts