U.S. stocks rose as immediate Iran-strike fears eased, while elevated yields, energy disruptions, AI concentration and earnings risks remained in focus.
Fundamentals: U.S. equities advanced Friday after concerns about an immediate U.S. strike on Iran eased, though market leadership remained uneven. AI-linked shares showed divergence, while elevated Treasury yields, concentrated S&P 500 valuations and energy-supply risks continued to pressure sentiment. Oil and gold gained amid Middle East tanker-security concerns and softer consumer sentiment.
Technicals: Technology-linked ETFs led the day’s advances, with AMZN, MSFT and TSLA higher, while META, NVDA and AAPL declined. Futures analysis showed broad bullish weekly and long-term structures in ES and NQ, though both were consolidating near resistance. YM, EMD, RTY and FDAX remained under short-term corrective pressure despite generally constructive longer-term frameworks.
After Market Close daily snapshot: market news summary and sentiment, major ETFs, Magnificent 7 analysis, Indices Futures Higher Time Frame Analysis, and E-mini S&P500, Nasdaq 100, NYMEX Crude, Gold Futures Daily Chart analysis.
As of: October 9, 2026 05:00 CT
Market News Summary:
U.S. equities rose Friday, while AI concentration, elevated yields, energy disruption, and earnings sensitivity remained key cross-currents.
Primary Drivers & Risks:
- Primary Driver: Equity gains amid easing Iran fears
- Primary Risk: Earnings, yields, and energy pressures
Tone:
Constructive index tone with concentrated and rate-sensitive risks.
Stock Market / ETFs / Indices:
U.S. stocks advanced, with the Nasdaq gaining more than 100 points intraday, as concern over an immediate U.S. strike on Iran eased. The AI trade showed sharp internal divergence: semiconductor ETFs fell more than 3% during an October 8 selloff while the equal-weight S&P 500 gained 0.60%. The S&P 500’s top 10 constituents represent 40% of market capitalization, and high valuation levels leave the index sensitive to earnings disappointment. The Russell 2000 ended a fifth consecutive losing week as yields rose.
Geopolitical:
Middle East escalation risks remained centered on attacks against commercial tankers in the Strait of Hormuz, where 11 tankers were attacked in the week ended October 4. U.S. stocks strengthened after Trump said there would be no U.S. strike on Iran before the midterm elections.
Oil / Energy:
WTI and Brent advanced as traders focused on Middle East escalation and tanker-security risks. Hurricane Isaias was cited as an additional supply-disruption concern amid tight fuel supplies. A U.S.-Russia diesel supply agreement was announced to increase global fuel availability, though commentators questioned its near-term effect on prices.
Gold / Metals:
Gold rose more than 1% and tested $4,200, supported by a softer dollar, a retreat from Treasury-yield extremes, weak consumer sentiment, and bargain buying after a midweek decline. Gold held above $4,100 support, while silver and platinum also gained. Gold-mining stocks returned 17.4% in the third quarter, outperforming every S&P 500 sector.
Fed / Financials:
Bond-market selling and elevated Treasury yields remained a concern despite the equity rally. The S&P 500’s yield gap versus Treasuries was described as near zero, increasing its dependence on earnings growth. The White House formed a committee to investigate allegations involving Federal Reserve Governor Lisa Cook.
Macro / Other:
U.S. consumer sentiment declined. Persistent inflation and higher bond yields continued to shape hawkish interest-rate expectations and weigh on rate-sensitive market segments.
Conclusion:
Friday’s index strength reflected reduced near-term Iran escalation fears and continued confidence in corporate earnings. AI-linked leadership remained important but uneven across technology exposures.
Higher Treasury yields, elevated energy prices, and concentration in the largest S&P 500 stocks remain significant cross-currents. Earnings results and oil-supply developments remain central market catalysts.
Market News Sentiment
Market News Articles: 35
- Neutral: 51.43%
- Negative: 25.71%
- Positive: 22.86%
Sentiment Summary: Among 35 market news articles, 51% were neutral, 26% negative, and 23% positive, indicating predominantly neutral coverage with a negative skew over positive items.
Conclusion: Indices futures day traders are facing a largely neutral news environment, with negative articles modestly outnumbering positive articles.
GLD,Gold Articles: 13
- Positive: 76.92%
- Neutral: 23.08%
Sentiment Summary: Gold-related coverage was 77% positive and 23% neutral across 13 articles.
Conclusion: The snapshot shows predominantly positive sentiment toward gold, with no negative articles recorded.
USO,Oil Articles: 11
- Neutral: 36.36%
- Negative: 36.36%
- Positive: 27.27%
Sentiment Summary: Oil-related coverage is mixed to slightly negative, with 36% neutral, 36% negative, and 27% positive articles.
Conclusion: For indices futures day traders, oil news tone is balanced between neutral and negative coverage, with positive sentiment less represented.
Market Data Snapshot
ETF Snapshot of major stock market ETFs, Mag7, and others as of: October 9, 2026 05:00
Top Movers & Losers
- AMZN 262.43 Bullish 3.29% ▲
- MSFT 535.07 Bullish 2.38% ▲
- TSLA 382.70 Bullish 2.05% ▲
- META 718.67 Bearish -0.31% ▼
- NVDA 229.28 Bearish -0.52% ▼
- AAPL 336.64 Bearish -1.11% ▼
Major Index ETFs: SPY, QQQ, DIA, IWM, IJH
- DIA 516.11 Bullish 0.87% ▲
- SPY 778.57 Bullish 0.60% ▲
- IJH 73.43 Bullish 0.55% ▲
- QQQ 751.27 Bullish 0.49% ▲
- IWM 278.94 Bullish 0.49% ▲
Major index ETFs were Bullish across the group. DIA was the most bullish mover at +0.87%, followed by SPY at +0.60% and IJH at +0.55%. QQQ and IWM were the least positive movers, each at +0.49%.
Mag 7 Stocks: AAPL, MSFT, GOOG, AMZN, META, NVDA, TSLA
- AMZN 262.43 Bullish 3.29% ▲
- MSFT 535.07 Bullish 2.38% ▲
- TSLA 382.70 Bullish 2.05% ▲
- GOOG 347.86 Bullish 0.87% ▲
- META 718.67 Bearish -0.31% ▼
- NVDA 229.28 Bearish -0.52% ▼
- AAPL 336.64 Bearish -1.11% ▼
Mixed: AMZN is the most bullish mover at +3.29%, followed by MSFT at +2.38% and TSLA at +2.05%. GOOG is also Bullish at +0.87%. AAPL is the most bearish mover at -1.11%, with NVDA Bearish at -0.52% and META Bearish at -0.31%.
Cross-Market ETFs: TLT, GLD, USO, IBIT
- GLD 384.58 Bullish 1.57% ▲
- IBIT 46.55 Bullish 0.63% ▲
- USO 148.20 Bullish 0.42% ▲
- TLT 77.98 Bullish 0.14% ▲
Other ETFs were Bullish across the group: GLD led as the most bullish mover at +1.57%, followed by IBIT at +0.63% and USO at +0.42%. TLT was the least positive mover at +0.14%, a modest gain.
ETF, Mag7, and Cross-Market ETF Insights
Overall Tone
Mixed tone: broad equity ETFs were Bullish while Mag7 participation was selective, with GLD also Bullish.
Equity ETFs and Mag7:
Major Index ETFs were broadly Bullish, led by DIA at +0.87%, while QQQ and IWM were the least positive at +0.49% each; SPY gained +0.60% and IJH rose +0.55%. Mag7 action was selective: AMZN was the most bullish mover at +3.29%, followed by MSFT at +2.38% and TSLA at +2.05%, while AAPL was the most bearish mover at -1.11%, with NVDA at -0.52% and META at -0.31%.
Cross-Market ETFs:
Cross-market ETFs were Bullish across the group, led by GLD at +1.57%, the most bullish mover, indicating stronger gold participation than the major equity ETFs. IBIT gained +0.63% and USO rose +0.42%, while TLT was marginally Bullish at +0.14% as the least positive mover.
Futures Indices – Higher Time Frame Analysis
Summary of the current state of US Indices Futures based on higher time-frame (HTF) technical analysis as of: 2026-10-09: 17:00 CT.
US Indices Futures
- ES YSFG/MSFG/WSFG rising, above six benchmarks, UTrend pivots; 7906.25 resistance, 7572.25 reversal support; weekly bullish, daily consolidation.
- NQ YSFG/MSFG/WSFG aligned higher, above rising benchmarks, UTrend pivots; 31689.25 resistance, 30898.50 reversal level, 29330.50 support.
- YM grids above F0%, short-term DTrend below fast benchmarks; 50859 support, 51995/53253 reversal levels, 52842 and 55316 resistance.
- EMD YSFG/MSFG constructive, WSFG below F0%; short-term DTrend below fast benchmarks; 3600.3 support, 3797.3 reversal, 3896.8 resistance.
- RTY YSFG constructive, MSFG/WSFG below F0%, DTrend below benchmarks; 2778.6/2768.4 support, 2943.2 reversal, 3003.3 resistance.
- FDAX YSFG/MSFG above F0%, WSFG below; short-term DTrend beneath fast benchmarks; 24925/24897 support, 25585 reversal, 26267 resistance.
Overall State
- Short-Term: Bearish
- Intermediate-Term: Neutral
- Long-Term: Bullish
Conclusion
ES and NQ retain aligned bullish YSFG, MSFG, WSFG, benchmark, and pivot structures near resistance. YM, EMD, RTY, and FDAX show short-term corrective DTrends, with support pivots defining current structure. Long-term benchmark and yearly-grid correlations remain broadly upward.
Note: Intra-day counter-trend pullbacks or retracements may occur, HTF is context for informational usage and market structure. Glossary: Session Fib Grids periods of YSFG:’Yearly’, MSFG:’Monthly’, WSFG:’Weekly’
For full details visit: AlphaWebTrader Technicals
ES Daily View
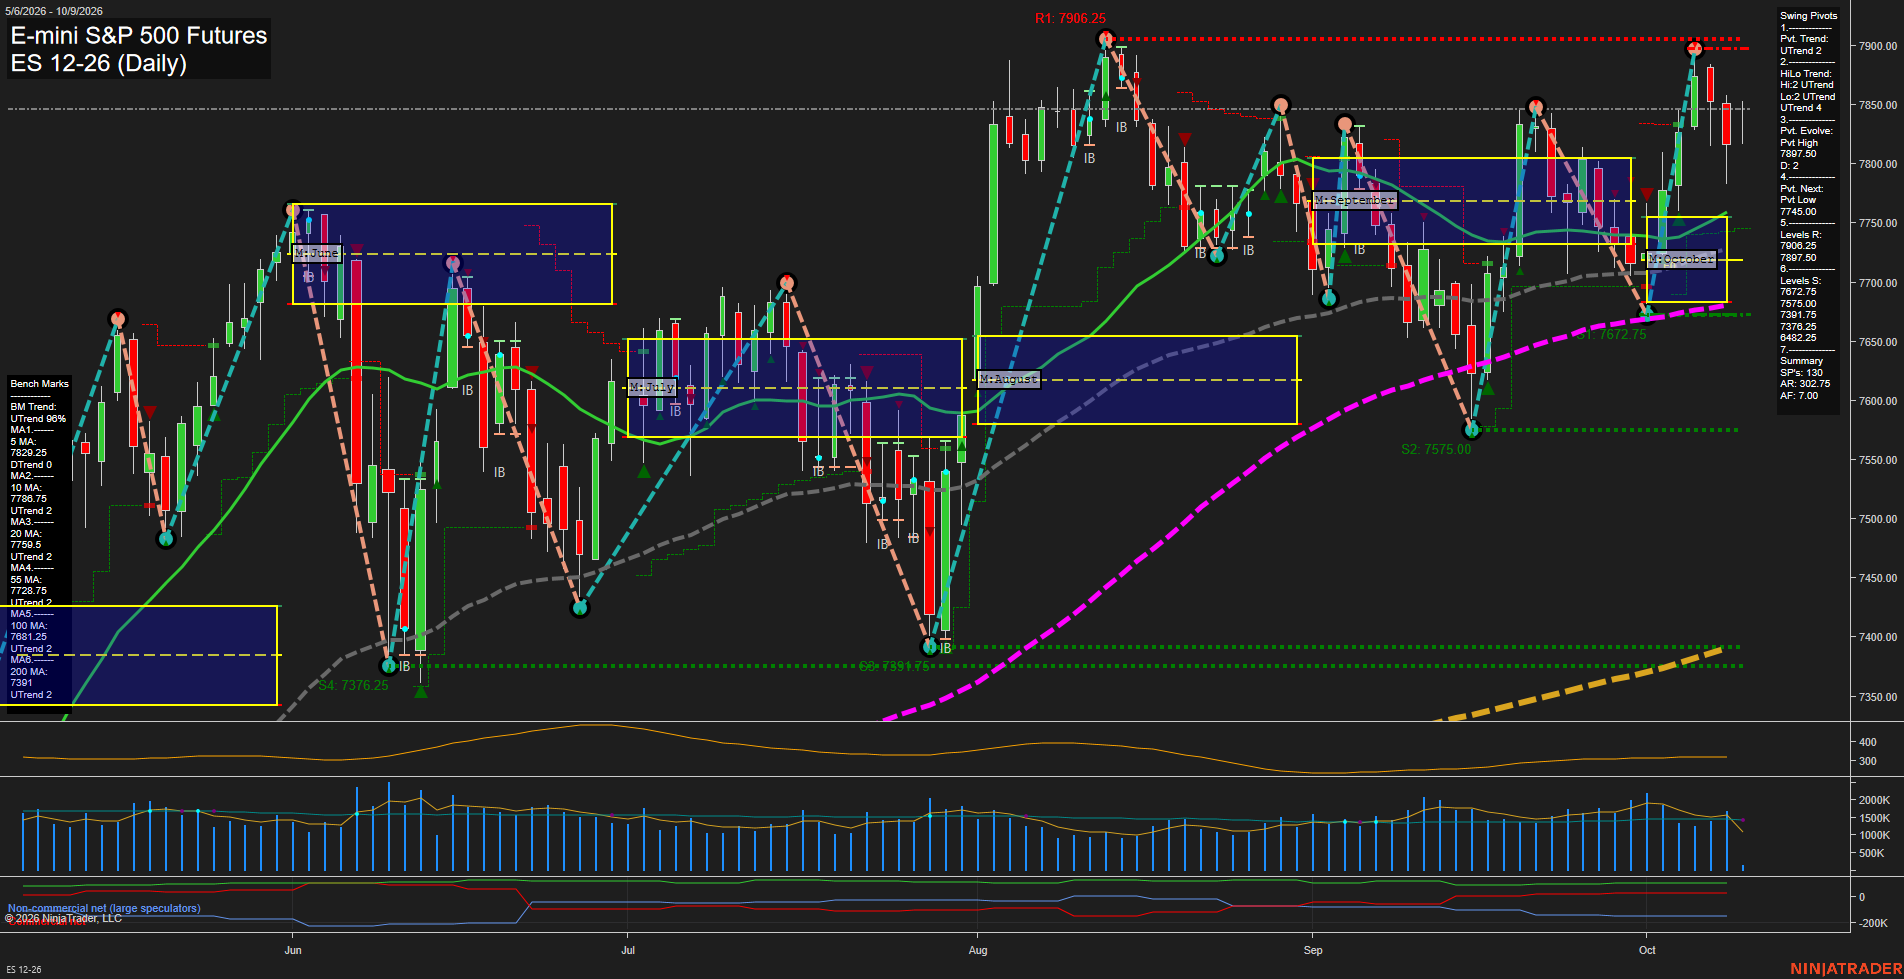
Overall Rating
- Short-Term: Neutral
- Intermediate-Term: Bullish
- Long-Term: Bullish.
Key Insights Summary
ES remains structurally upward across the weekly, monthly, and yearly fib grids, with all six benchmark averages rising and stacked beneath price. The latest swing sequence established a 7897.00 pivot high and a nearby 7906.25 resistance zone, followed by a medium-sized pullback that places short-term momentum in consolidation rather than a clean continuation phase. Price remains above the 10-, 20-, and 55-day benchmarks, preserving the intermediate higher-low structure, while 7745.00 is the active opposite-pivot level and 7672.75 is the larger support reference. Elevated ATR near 319 reflects a wide daily swing environment, and the recent short-term signal contrasts with the broader bullish benchmark and fib-grid alignment.
View charts on: AlphaWebTrader HTF Charts
NQ Daily View
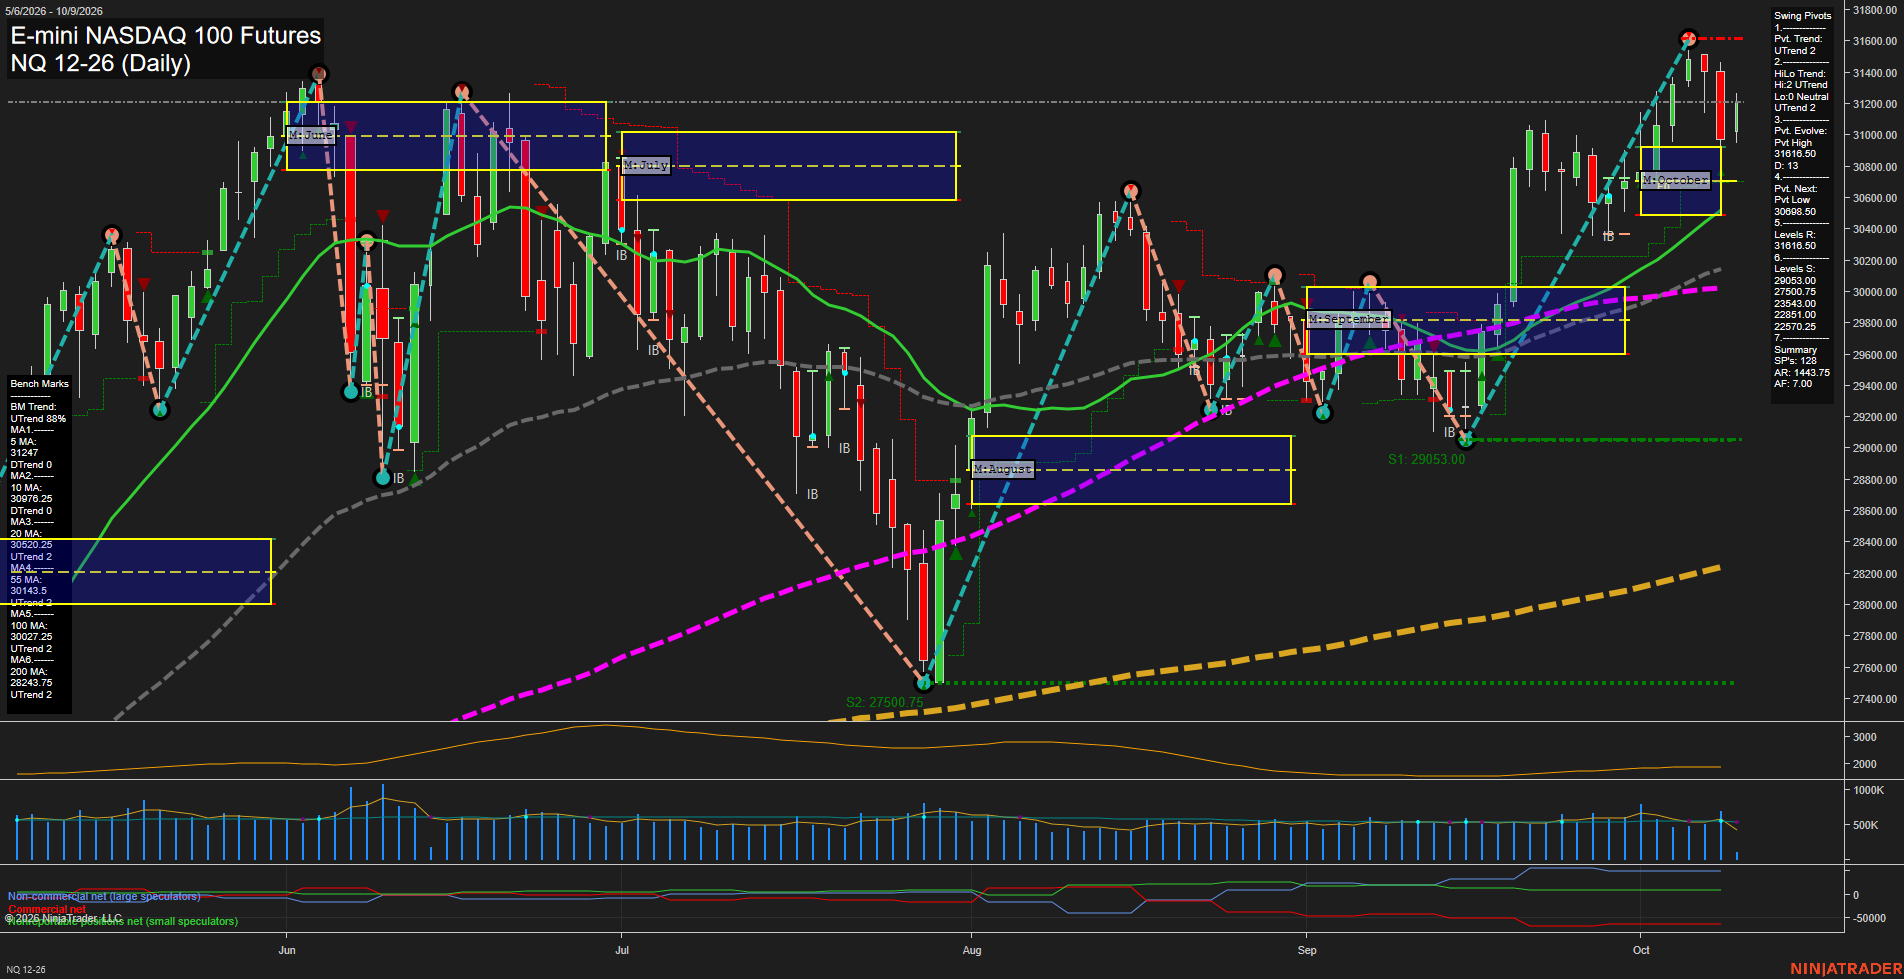
Overall Rating
- Short-Term: Bullish
- Intermediate-Term: Bullish
- Long-Term: Bullish.
Key Insights Summary
NQ remains in a broad multi-timeframe advance, with price above the weekly, monthly, and yearly F0% references and above the rising 20-, 55-, 100-, and 200-day benchmarks. The short-term structure is constructive but mixed: price is slightly below the rising 5-day average while remaining above the 10-day average, following a pullback from the 31616.50 pivot-high resistance. The current swing sequence retains higher lows and an UTrend pivot structure, while 30898.50 defines the next pivot-low reversal reference. Recent medium-range bars and elevated ATR reflect active two-way price discovery beneath the prior high rather than a completed trend failure.
View charts on: AlphaWebTrader HTF Charts
CL Daily View
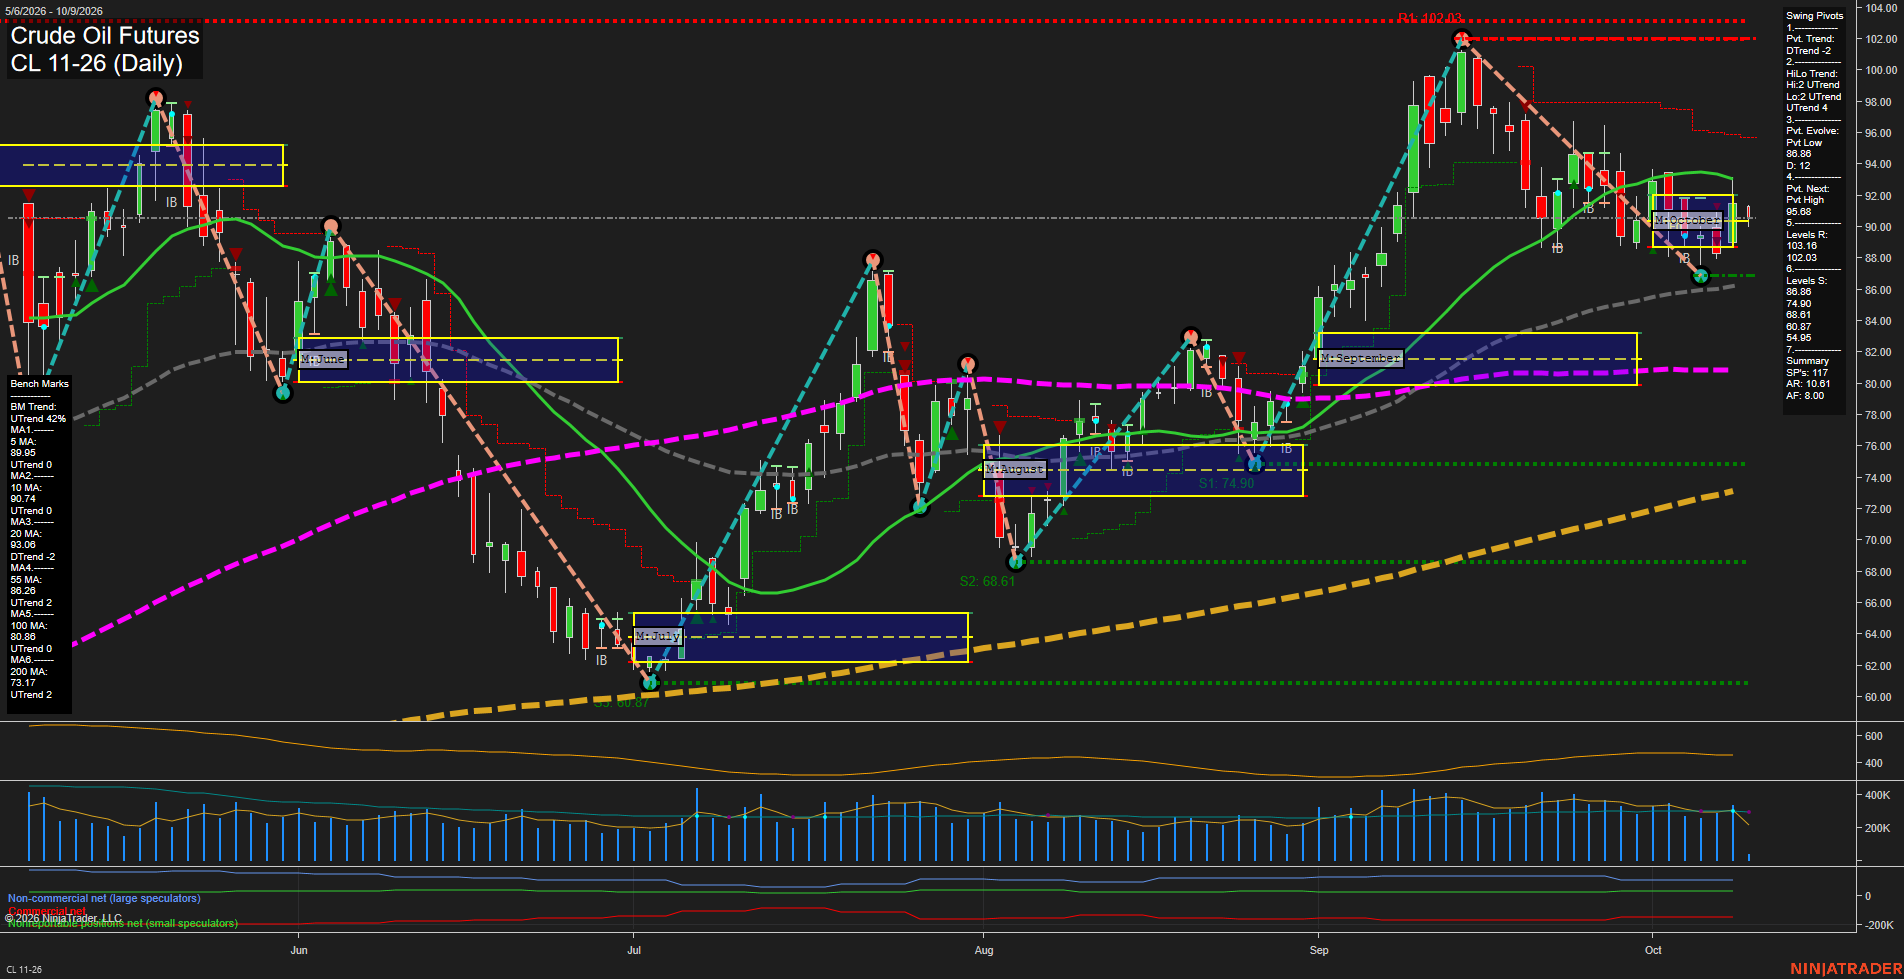
Overall Rating
- Short-Term: Bearish
- Intermediate-Term: Bullish
- Long-Term: Bullish.
Key Insights Summary
Price is consolidating near 90 following a sharp September advance and a retracement from the 102.03 pivot high. The short-term pivot structure remains in a DTrend and price is below the weekly F0% area, while small daily bars reflect slowed downside momentum and range-bound trade above the 86.86 pivot-low support. Intermediate and long-term structure remains constructive: price holds above the rising 55-, 100-, and 200-day benchmarks, the monthly grid remains positive, and the HiLo pivot trend is still upward. Near-term action is defined by the 86.86 support and 95.68 pivot-reversal level, with major overhead swing resistance at 102.03 and 103.16.
View charts on: AlphaWebTrader HTF Charts
GC Daily View
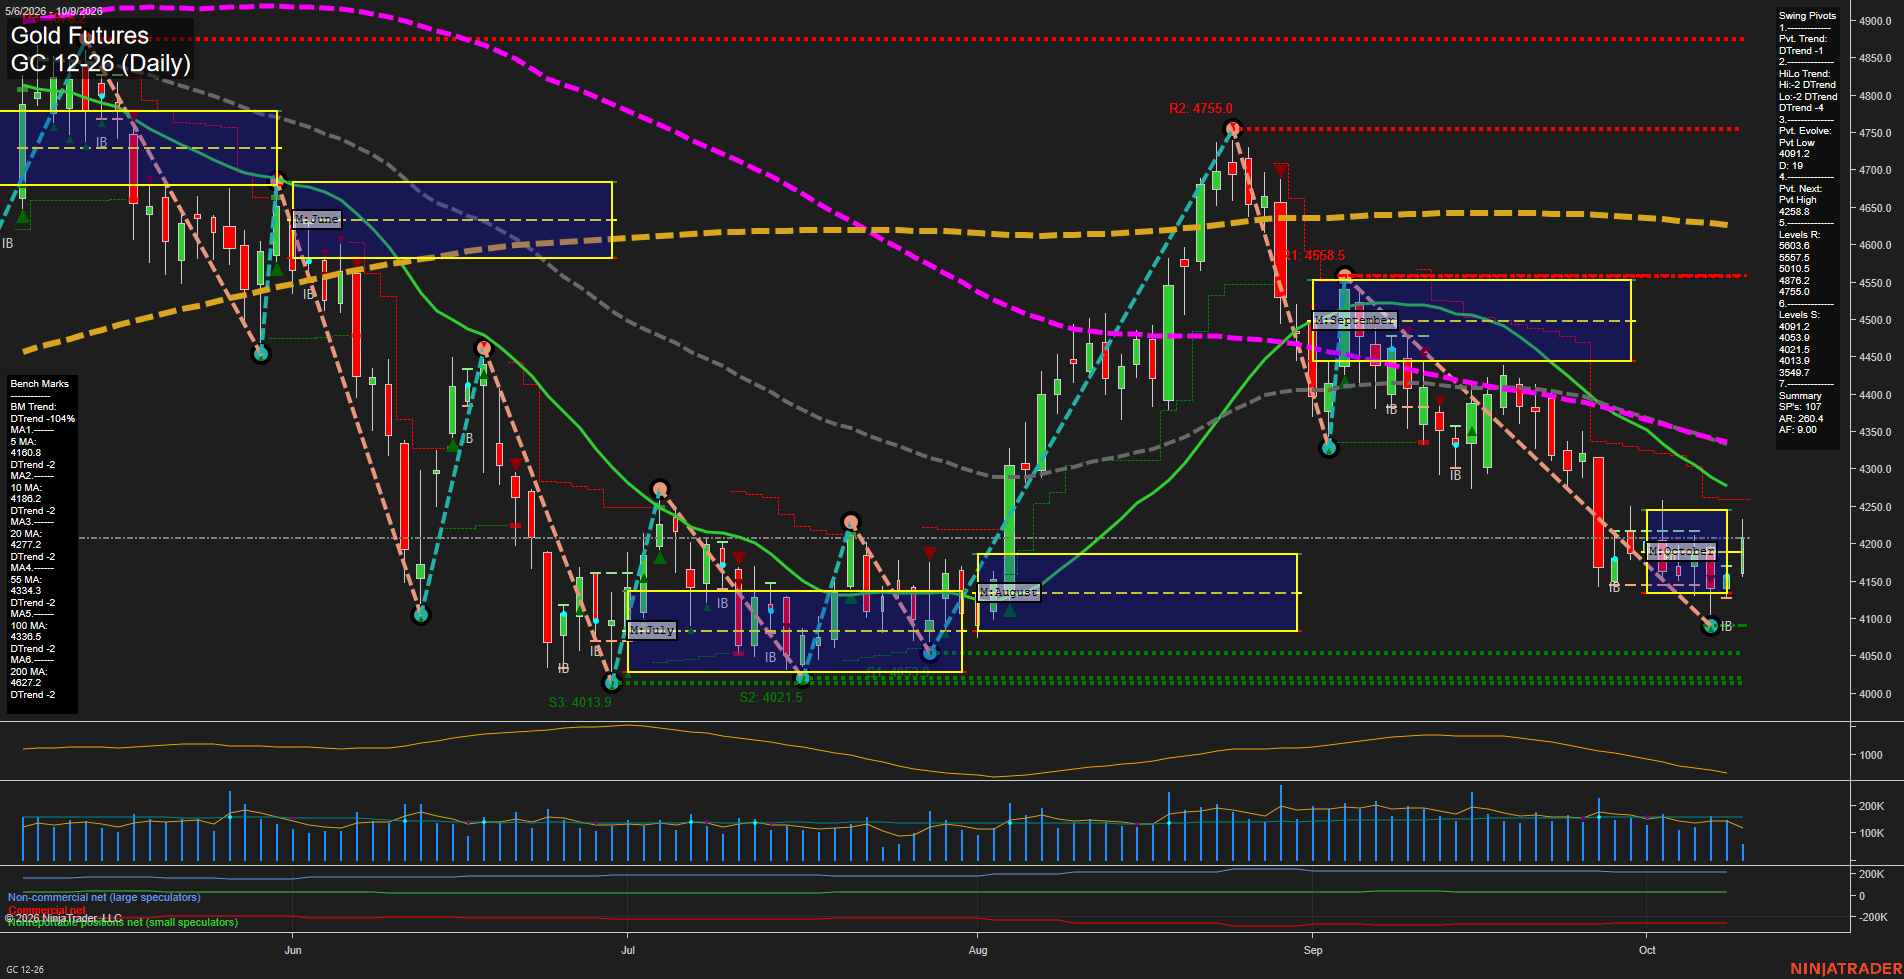
Overall Rating
- Short-Term: Bearish
- Intermediate-Term: Bearish
- Long-Term: Bearish.
Key Insights Summary
Price is holding just above the October monthly F0% area and the weekly grid remains positive, but the broader swing structure remains bearish. The current 4091.2 pivot low produced a sharp rebound toward 4200, yet price remains below the declining 10-, 20-, 55-, 100-, and 200-day benchmarks. The 4258.8 pivot-next level defines the nearby reversal threshold, while 4091.2 and the clustered 4053.9 to 4013.9 supports mark the lower swing range. Elevated ATR reflects a volatile, choppy countertrend bounce within a larger decline from the August 4755.0 swing high.
View charts on: AlphaWebTrader HTF Charts
ZB Daily View
Overall Rating
- Short-Term: Neutral
- Intermediate-Term: Bearish
- Long-Term: Bearish.
Key Insights Summary
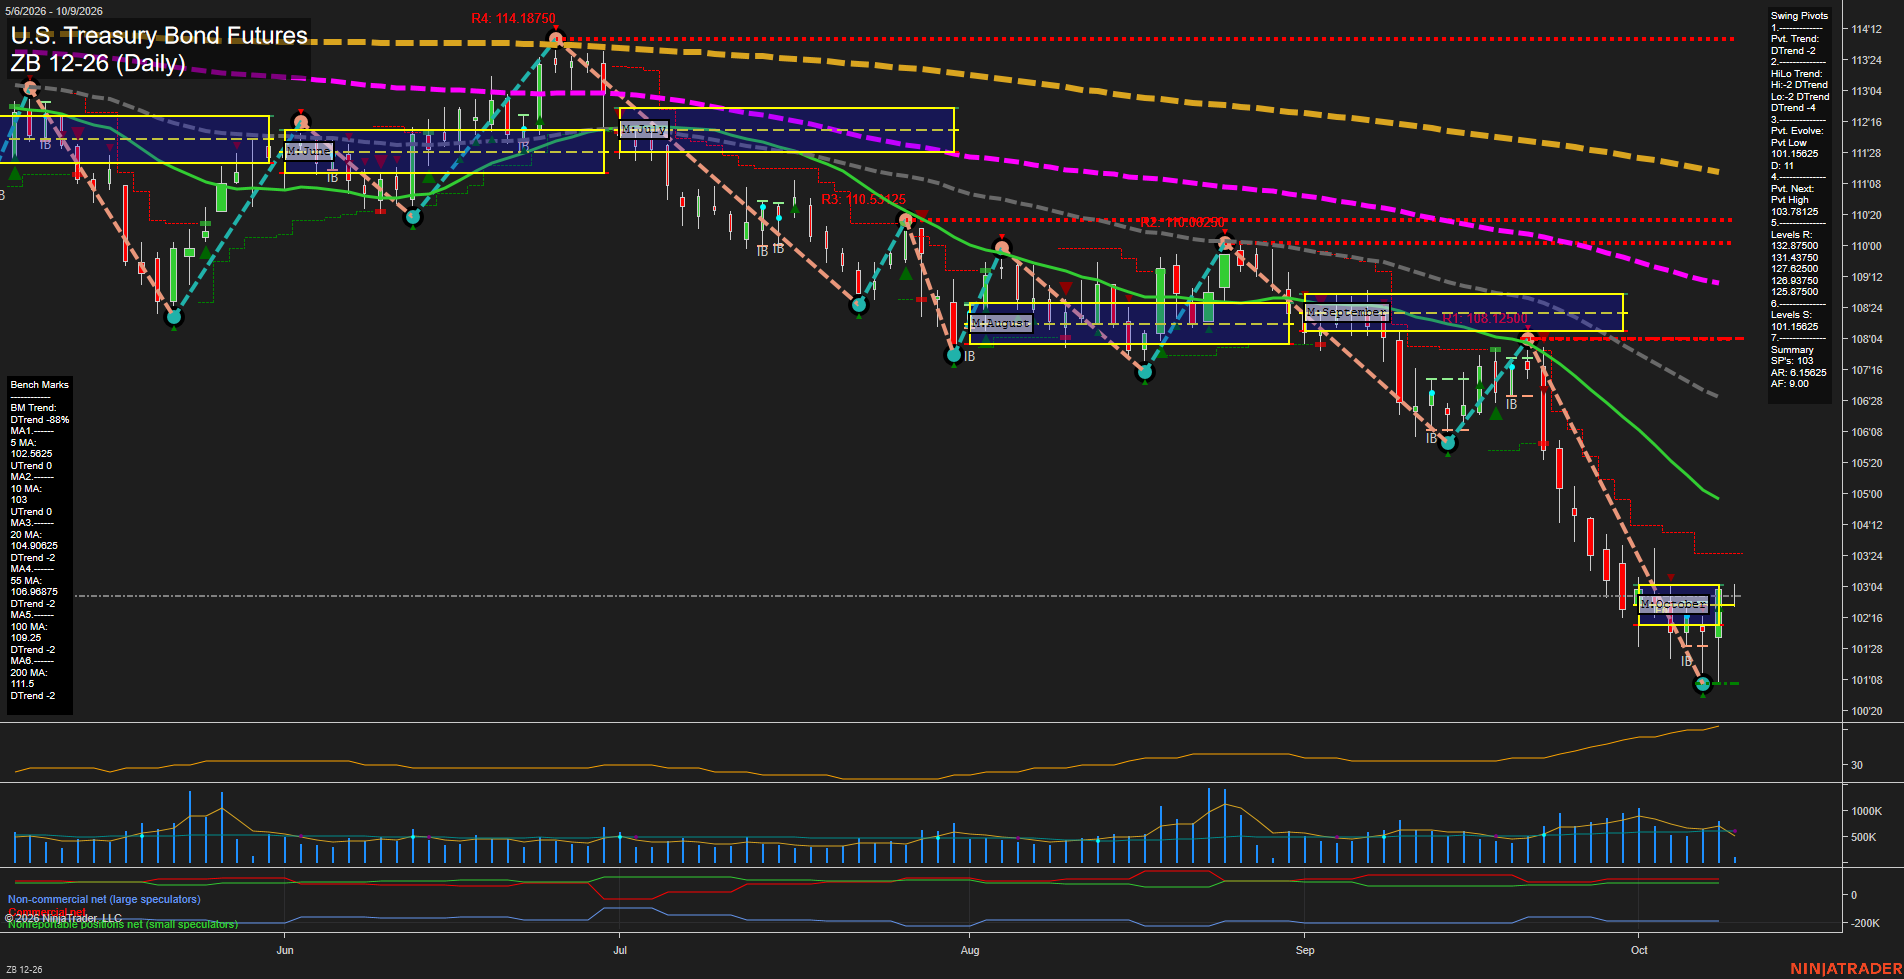
ZB remains in a broad daily-chart decline, confirmed by DTrend readings in both pivot structures and price trading beneath the 20-, 55-, 100-, and 200-day benchmarks. The sharp September-to-October selloff reached a new pivot low at 101.15625, followed by a small-bar stabilization and rebound toward 103'00. This creates a short-term recovery phase above the weekly and monthly F0% areas, while the larger trend remains lower. The next pivot reversal threshold is 103.78125; until that level is exceeded, the rebound reads as a counter-trend base within a bearish intermediate and long-term structure. Expanding ATR and recently elevated volume reflect an active volatility regime following the decline.
View charts on: AlphaWebTrader HTF Charts