U.S. stocks ended mixed as oil above $105, Treasury yields near 5% and AI-sector selling pressured sentiment, while a strong bond auction eased rates.
Fundamentals: U.S. equity indexes closed mixed as higher oil prices, elevated Treasury yields and weakness in AI shares weighed on risk appetite. The Nasdaq led declines while the S&P 500 fell modestly and the Dow was broadly steady. Brent crude topped $105 amid U.S.-Iran tensions, while a strong 30-year Treasury auction helped yields retreat from intraday highs.
Technicals: Market internals were mixed at the NYSE close, with USO, Apple and TLT advancing while IBIT, Amazon and Nvidia declined. ES and NQ retained bullish daily and weekly trend structures despite pullbacks near resistance. Dow, Russell 2000, EMD and FDAX charts reflected short-term bearish momentum, with several markets testing nearby support after sharp retracements.
After Market Close daily snapshot: market news summary and sentiment, major ETFs, Magnificent 7 analysis, Indices Futures Higher Time Frame Analysis, and E-mini S&P500, Nasdaq 100, NYMEX Crude, Gold Futures Daily Chart analysis.
As of: October 8, 2026 05:00 CT
Market News Summary:
Equity indexes finished mixed as an oil-driven inflation shock, elevated Treasury yields, and AI-sector selling pressured risk appetite.
Primary Drivers & Risks:
- Primary Driver: Oil surge and inflation concerns
- Primary Risk: Rising yields pressure valuations
Tone:
Cautious risk-off tone, with mixed index performance.
Stock Market / ETFs / Indices:
U.S. stocks ended mixed: the Nasdaq fell 1.24% as AI shares weakened, while the S&P 500 declined 0.46% after recently reaching record highs. Concerns over AI profitability, concentration in mega-cap equity exposure, and upcoming earnings added pressure, although market breadth showed early improvement.
Geopolitical:
Escalating U.S.-Iran tensions and concerns around the Strait of Hormuz supported elevated oil prices. European debt concerns also contributed to broader global-market caution.
Oil / Energy:
Brent crude topped $105 and WTI registered a bullish technical breakout. Energy prices remained elevated despite improving supply conditions, with refinery outages, war-related damage, and high diesel crack spreads cited as constraints.
Gold / Metals:
Gold firmed after a strong 30-year Treasury auction helped yields retreat from intraday highs. Earlier gains faced resistance from a firm dollar and Treasury yields above 5%, while central-bank diversification and ETF inflows supported the longer-term gold backdrop.
Fed / Financials:
Real yields drove the September increase in 10-year Treasury yields, reflecting a higher global hurdle for capital. The 10-year yield moved above 5%, mortgage rates reached 7.4%, and Fed officials flagged inflation and oil prices as factors behind further tightening concerns. A strong 30-year Treasury auction later eased yield pressure.
Macro / Other:
Higher mortgage rates for a seventh consecutive week intensified housing-affordability pressure. CPI data and big-bank earnings are among the next scheduled market focal points, while Bitcoin ETF outflows and broader crypto weakness signaled softer speculative appetite.
Conclusion:
Oil prices, Treasury yields, and AI-stock weakness were the main forces behind mixed U.S. equity performance. The Nasdaq led declines, while the Dow held broadly steady.
Inflation concerns tied to energy prices sharpened attention on Fed policy and bond-market volatility. A strong long-bond auction provided some relief to yields, but high mortgage rates and European debt concerns remained cross-currents.
Market News Sentiment
Market News Articles: 37
- Neutral: 43.24%
- Negative: 40.54%
- Positive: 16.22%
Sentiment Summary: Among 37 market news articles, 43% were neutral, 41% negative, and 16% positive, indicating broadly neutral coverage with a notable negative skew.
Conclusion: Indices futures day traders are facing a news flow where neutral and negative articles dominate, while positive coverage is limited.
GLD,Gold Articles: 11
- Positive: 54.55%
- Negative: 36.36%
- Neutral: 9.09%
Sentiment Summary: Gold coverage was moderately positive, with 55% positive, 36% negative, and 9% neutral articles across 11 items.
Conclusion: The sentiment mix indicates a positive tilt in gold-related news, while a substantial share of negative coverage reflects mixed market narratives.
USO,Oil Articles: 21
- Negative: 42.86%
- Positive: 33.33%
- Neutral: 23.81%
Sentiment Summary: USO and oil coverage is mixed-to-negative, with 43% negative, 33% positive, and 24% neutral articles across 21 items.
Conclusion: The oil news tone presents a modest negative bias, which may remain a relevant cross-market sentiment input for indices futures day traders.
Market Data Snapshot
ETF Snapshot of major stock market ETFs, Mag7, and others as of: October 8, 2026 05:00
Top Movers & Losers
- USO 147.58 Bullish 2.55% ▲
- AAPL 340.42 Bullish 1.11% ▲
- TLT 77.87 Bullish 0.94% ▲
- IBIT 46.26 Bearish -2.01% ▼
- AMZN 254.06 Bearish -2.25% ▼
- NVDA 230.48 Bearish -2.94% ▼
Major Index ETFs: SPY, QQQ, DIA, IWM, IJH
- IJH 73.03 Bullish 0.37% ▲
- DIA 511.65 Bullish 0.12% ▲
- IWM 277.57 Bearish -0.05% ▼
- SPY 773.93 Bearish -0.42% ▼
- QQQ 747.58 Bearish -1.34% ▼
Major index ETFs were Mixed: IJH led the bullish side at +0.37%, while QQQ was the most bearish mover at -1.34%. DIA was marginally bullish at +0.12%; IWM was near-flat bearish at -0.05%, and SPY was bearish at -0.42%.
Mag 7 Stocks: AAPL, MSFT, GOOG, AMZN, META, NVDA, TSLA
- AAPL 340.42 Bullish 1.11% ▲
- META 720.89 Bearish -0.06% ▼
- GOOG 344.86 Bearish -0.72% ▼
- TSLA 375.00 Bearish -0.74% ▼
- MSFT 522.61 Bearish -1.35% ▼
- AMZN 254.06 Bearish -2.25% ▼
- NVDA 230.48 Bearish -2.94% ▼
Mag7 performance is Bearish overall: AAPL is the most bullish mover at +1.11%, while NVDA is the most bearish mover at -2.94%. META is near-flat at -0.06%; GOOG -0.72%, TSLA -0.74%, MSFT -1.35%, and AMZN -2.25% are Bearish.
Cross-Market ETFs: TLT, GLD, USO, IBIT
- USO 147.58 Bullish 2.55% ▲
- TLT 77.87 Bullish 0.94% ▲
- GLD 378.62 Bullish 0.73% ▲
- IBIT 46.26 Bearish -2.01% ▼
Other ETFs were Mixed: USO was the most bullish mover at +2.55%, while IBIT was the most bearish mover at -2.01%. TLT gained +0.94% and GLD added +0.73%, showing bullish moves across rates and gold alongside bearish Bitcoin exposure.
ETF, Mag7, and Cross-Market ETF Insights
Overall Tone
Mixed: large-cap growth and several Mag7 names were Bearish, while energy, Treasury, and gold ETFs were Bullish.
Equity ETFs and Mag7:
Major Index ETFs were selective: IJH was Bullish at +0.37% and DIA added +0.12%, while SPY fell -0.42%, IWM was marginally Bearish at -0.05%, and QQQ lagged at -1.34%. Mag7 performance was broadly Bearish, with AAPL leading higher at +1.11%, while META was near-flat Bearish at -0.06%; NVDA was the most bearish mover at -2.94%, followed by AMZN at -2.25%. The dispersion between positive industrial and value-linked ETFs and Bearish growth leadership kept equities Mixed.
Cross-Market ETFs:
Cross-market ETFs diverged from growth equities: USO was the most bullish mover at +2.55%, while TLT rose +0.94% and GLD gained +0.73%. IBIT was the most bearish mover at -2.01%, contrasting with Bullish energy, Treasury, and gold performance. This showed Mixed cross-market conditions, with commodity and traditional hedge strength alongside crypto weakness.
Futures Indices – Higher Time Frame Analysis
Summary of the current state of US Indices Futures based on higher time-frame (HTF) technical analysis as of: 2026-10-08: 17:00 CT.
US Indices Futures
- ES YSFG/MSFG/WSFG above F0%, benchmarks rising, UTrend pivots, 7906.25 resistance, 7752.25 short-term structural threshold.
- NQ YSFG/MSFG/WSFG above F0%, benchmarks rising, UTrend pivots, 31610.50–31616.50 resistance, 30283.75–29989.45 support.
- YM YSFG above F0%, MSFG/WSFG below centers, declining short benchmarks, 50859/50568 support, 52005 reversal threshold.
- EMD YSFG/MSFG above F0%, WSFG below F0%, DTrend pivots, 3600.3 support, 3797.3 reversal threshold, 3332.6 lower support.
- RTY YSFG above F0%, MSFG/WSFG below F0%, DTrend pivots, 2778.6 support, 2943.2 weekly reversal threshold.
- FDAX YSFG/MSFG/WSFG below F0%, benchmarks declining, bearish pivots, 24897–24935 support, 25593 reversal threshold, 26847 resistance.
Overall State
- Short-Term: Bearish
- Intermediate-Term: Neutral
- Long-Term: Bullish
Conclusion
ES and NQ retain aligned higher-timeframe uptrends above Fib-grid centers and benchmark averages, while YM, EMD, RTY, and FDAX remain in weekly/daily retracements with DTrend pivot structures. YM, EMD, and RTY retain yearly-grid and longer benchmark support; FDAX remains below all grid centers. Index correlation is split between ES/NQ strength and broad weakness across YM, EMD, RTY, and FDAX.
Note: Intra-day counter-trend pullbacks or retracements may occur, HTF is context for informational usage and market structure. Glossary: Session Fib Grids periods of YSFG:’Yearly’, MSFG:’Monthly’, WSFG:’Weekly’
For full details visit: AlphaWebTrader Technicals
ES Daily View
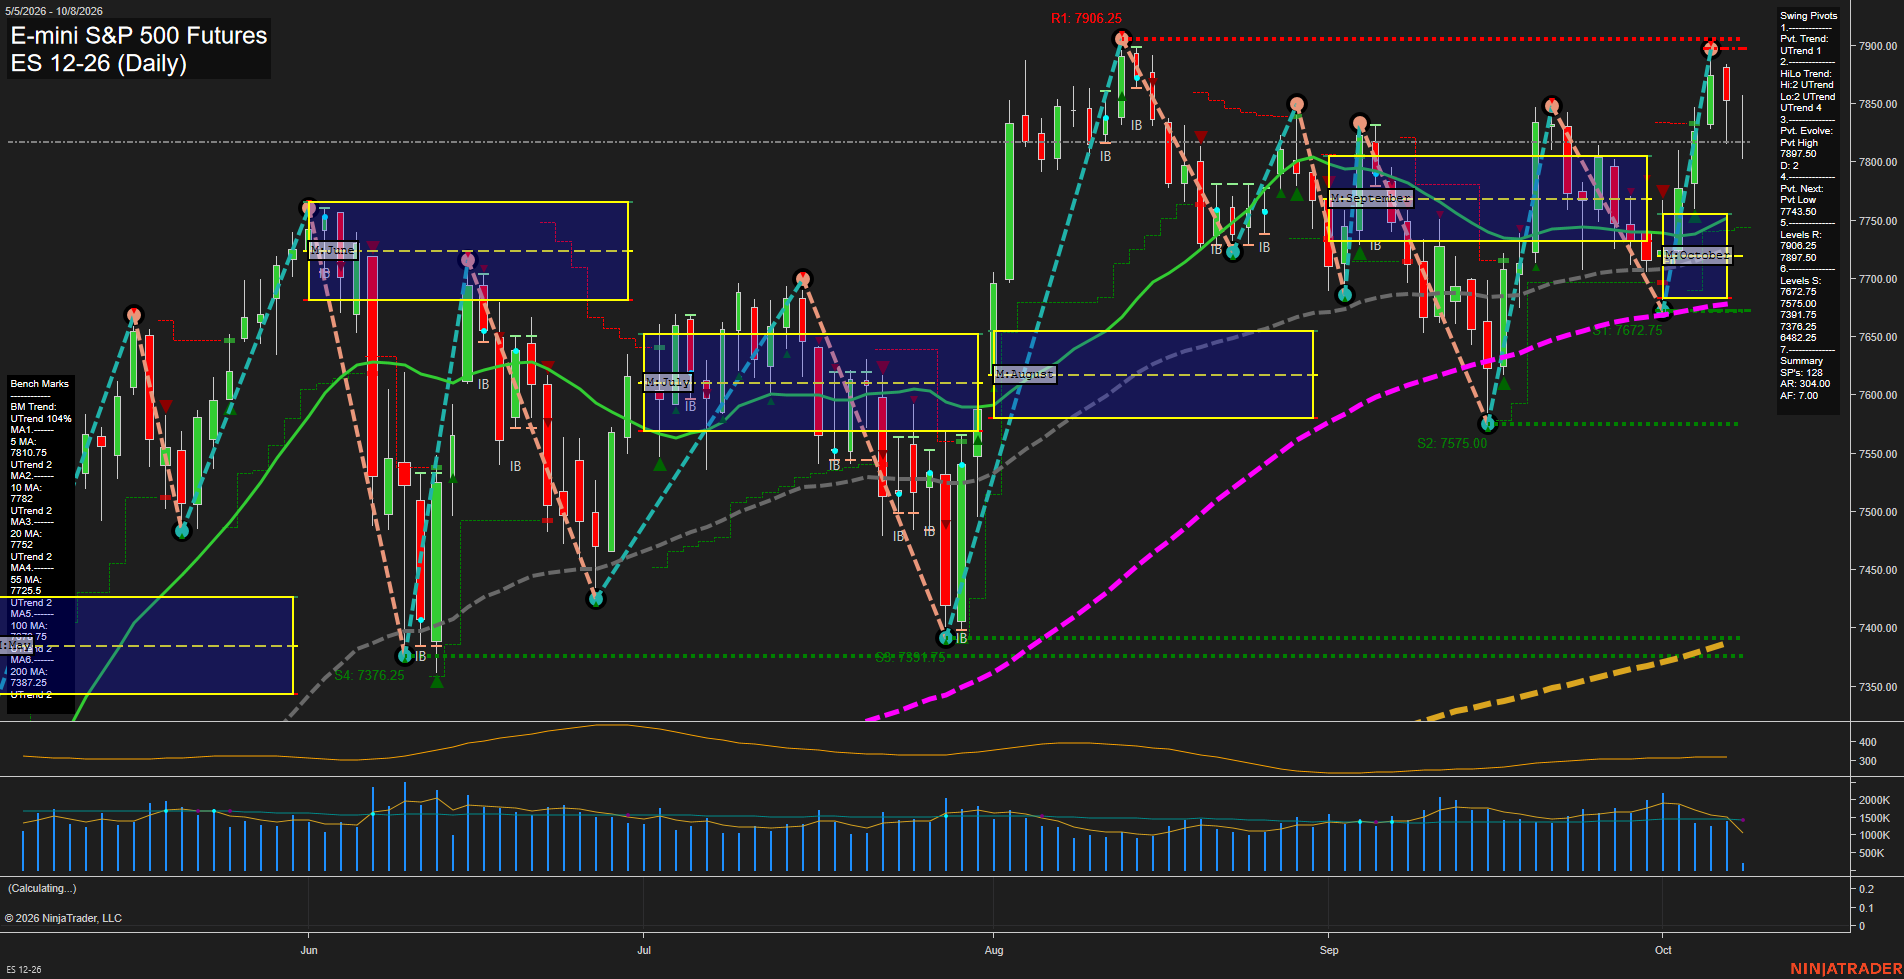
Overall Rating
- Short-Term: Bullish
- Intermediate-Term: Bullish
- Long-Term: Bullish.
Key Insights Summary
The daily structure remains broadly constructive: both pivot trend measures are upward, price remains above the weekly, monthly
View charts on: AlphaWebTrader HTF Charts
NQ Daily View
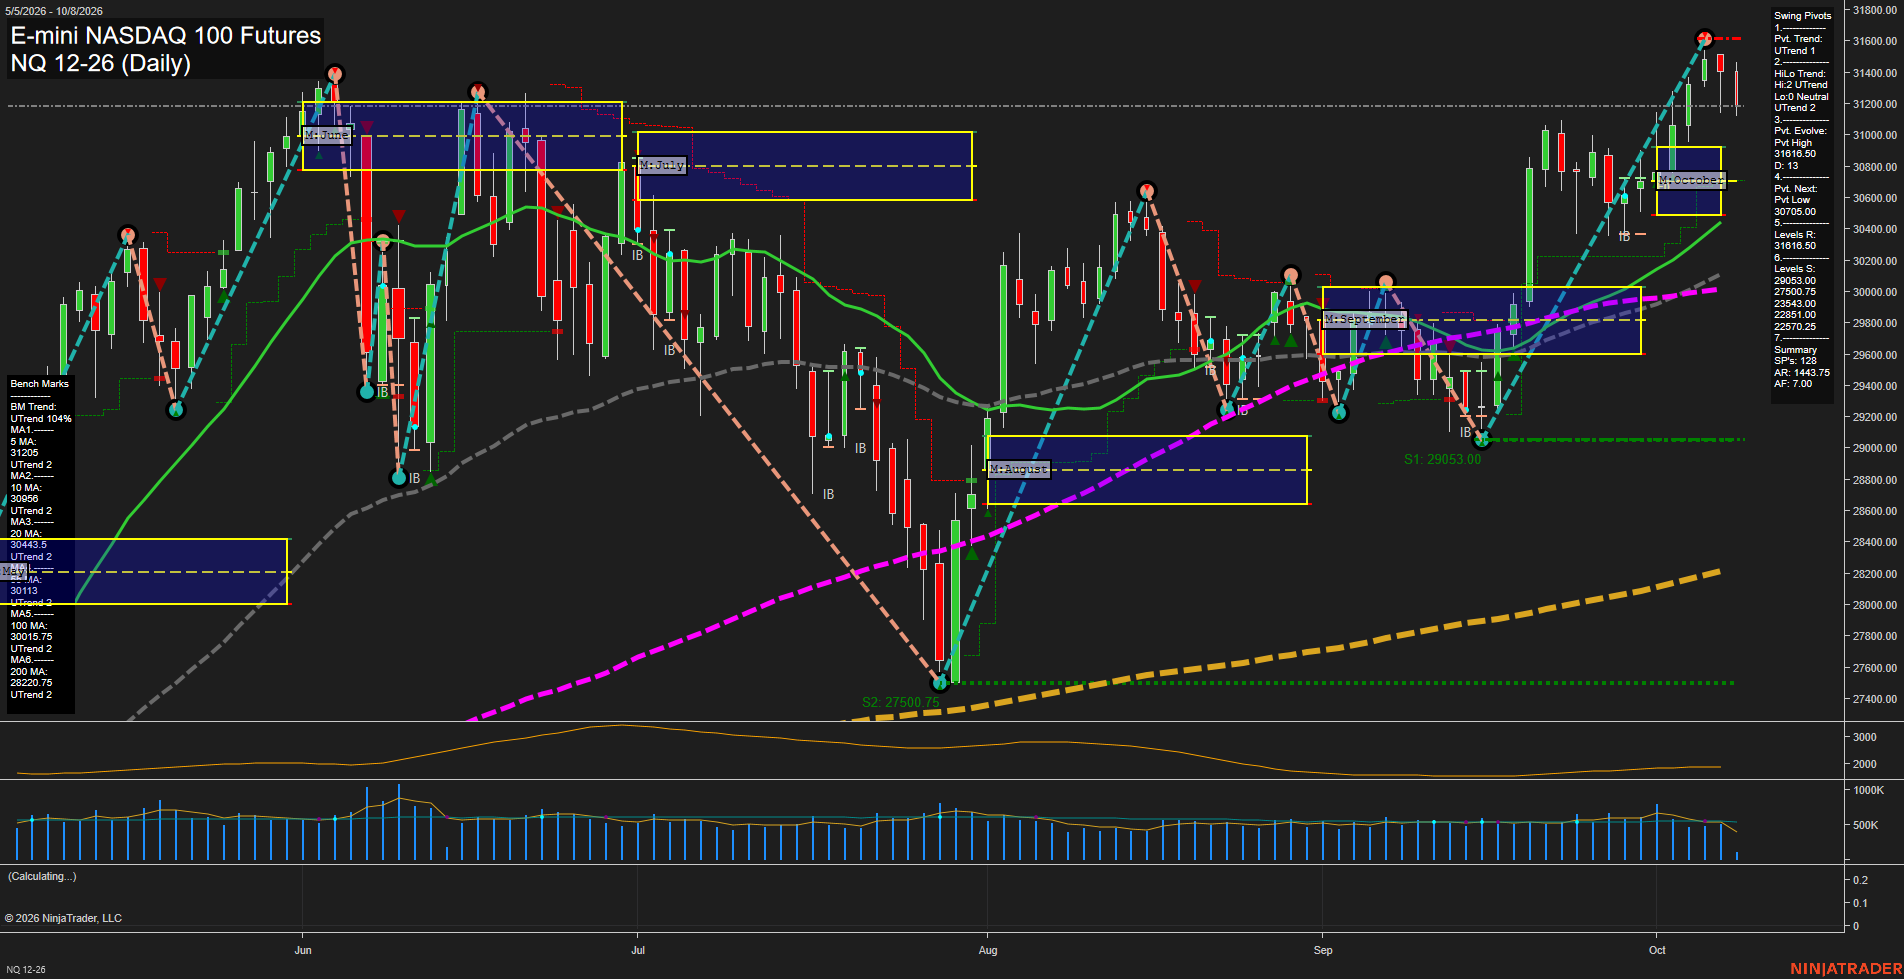
Overall Rating
- Short-Term: Bullish
- Intermediate-Term: Bullish
- Long-Term: Bullish.
Key Insights Summary
The daily structure remains broadly constructive: the late-September low produced a strong V-shaped recovery, higher lows, and a new pivot high at 31616.50. Price is above every benchmark average and all benchmark trends are rising, while the weekly, monthly, and yearly Fib-grid biases remain above F0%. The latest medium red bar reflects a pullback from the 31616.50 high and moderating near-term momentum rather than a confirmed intermediate trend reversal. The 30705 pivot-next level and clustered 20-, 55-, and 100-day averages near 30017.5-30443.5 define the principal technical retracement area, while 31616.50 remains the visible upside swing resistance.
View charts on: AlphaWebTrader HTF Charts
CL Daily View
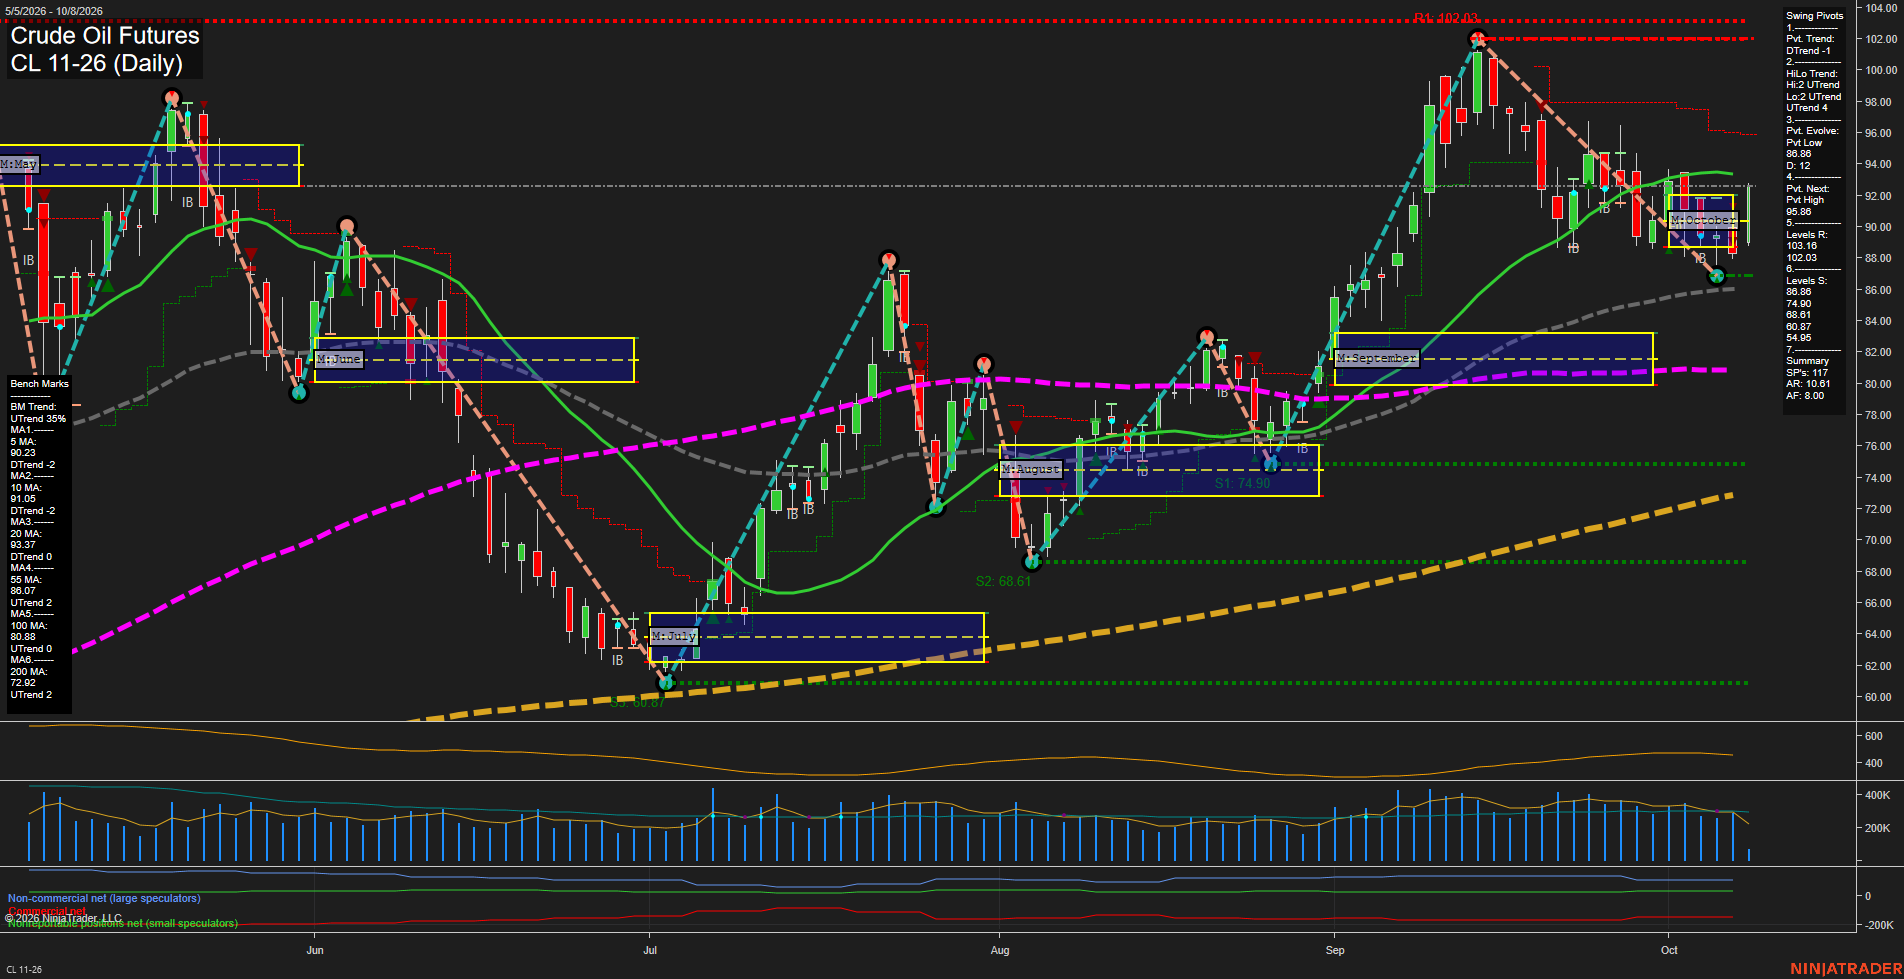
Overall Rating
- Short-Term: Neutral
- Intermediate-Term: Bullish
- Long-Term: Bullish.
Key Insights Summary
Crude remains in a broader advancing structure, holding above the rising 55-, 100-, and 200-day benchmarks and above the October monthly and 2026 yearly Fib-grid reference areas. The short-term picture is consolidative after the September surge and subsequent retracement from the 102.03 pivot high. Price has formed a lower-high sequence from that peak and the active pivot trend remains down, while the rebound from 86.86 support has restored price above the 5-day average. The 91.05 to 93.37 benchmark area defines a near-term congestion zone, with 95.86 representing the next upside pivot threshold and 86.86 remaining the principal swing support. Volume remains moderate relative to recent activity, while ATR reflects an elevated daily range environment consistent with crude's volatile post-rally consolidation.
View charts on: AlphaWebTrader HTF Charts
GC Daily View
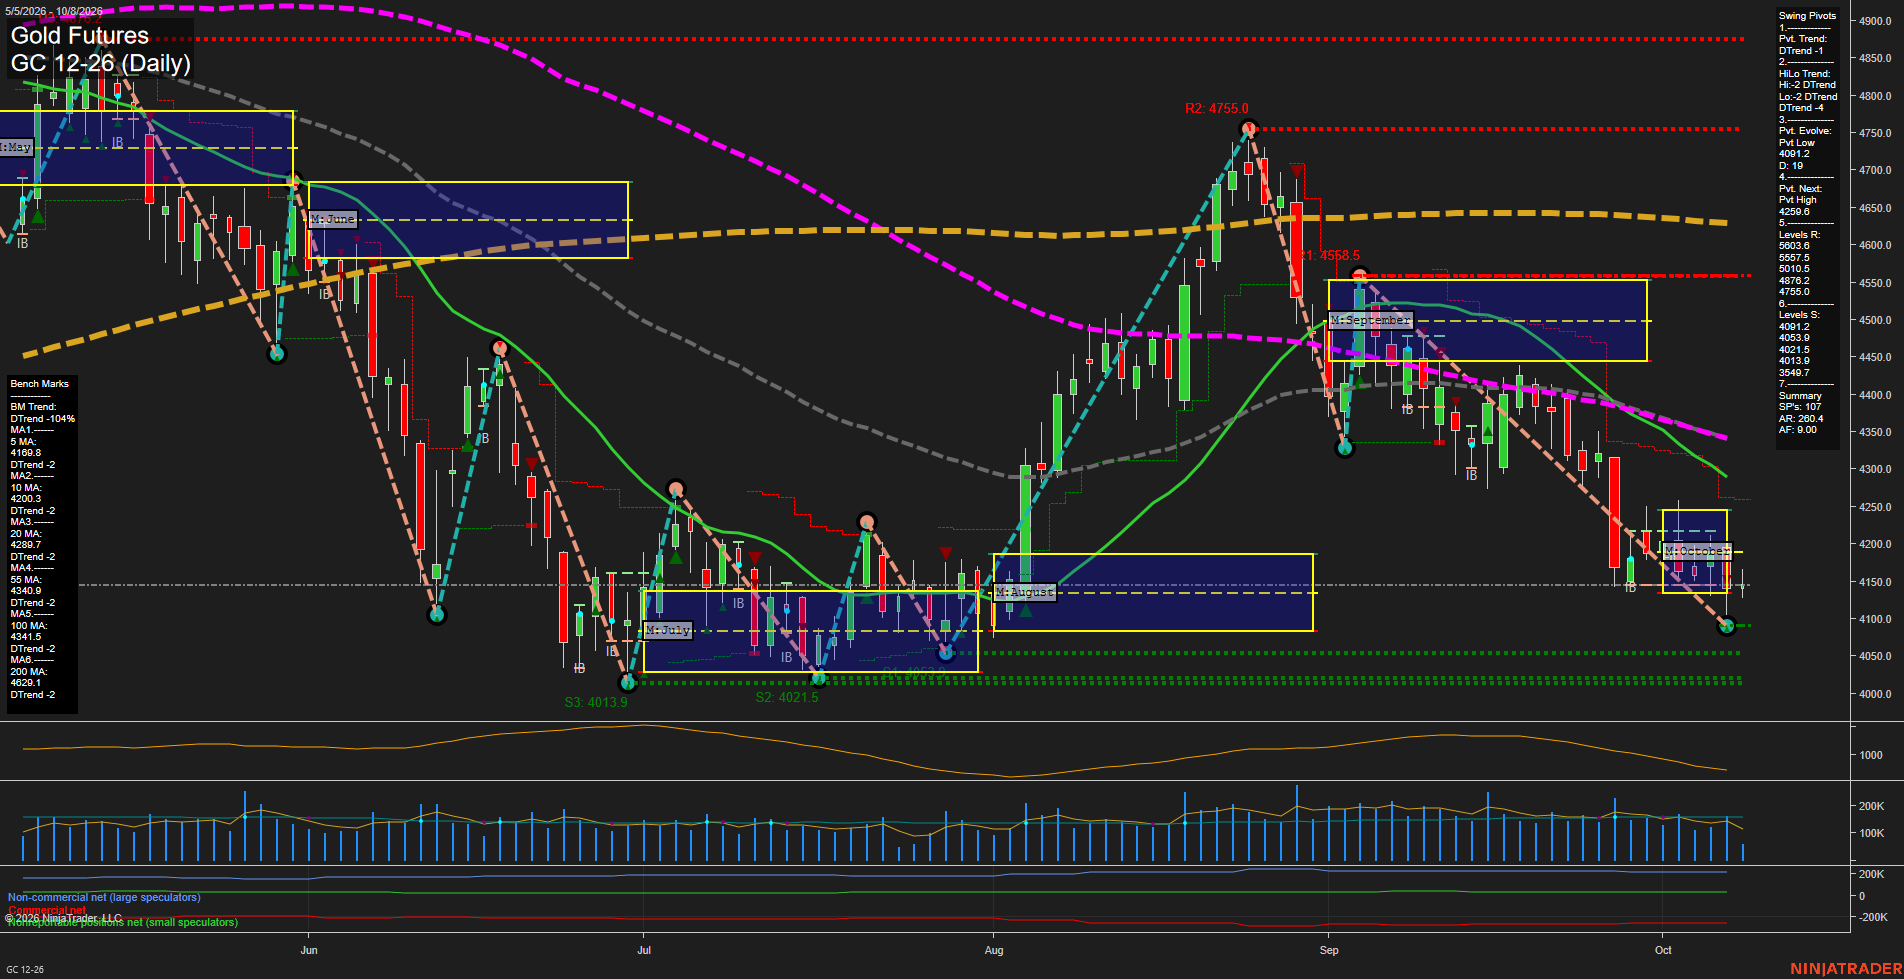
Overall Rating
- Short-Term: Bearish
- Intermediate-Term: Bearish
- Long-Term: Bearish.
Key Insights Summary
Price is in a fast, high-volatility downswing, holding beneath every daily benchmark and below both the weekly and monthly Fib-grid equilibrium areas. The pivot structure remains bearish across short and intermediate horizons, with lower highs extending from the 4755.0 pivot and price pressing the 4091.2 pivot-low area. The October decline has expanded range and downside momentum, while the 4169.8 to 4259.8 area defines the nearest overhead mean-reversion and pivot-reversal zone. Sustained positioning below the 20-, 55-, 100-, and 200-day averages confirms broad trend alignment to the downside.
View charts on: AlphaWebTrader HTF Charts
ZB Daily View
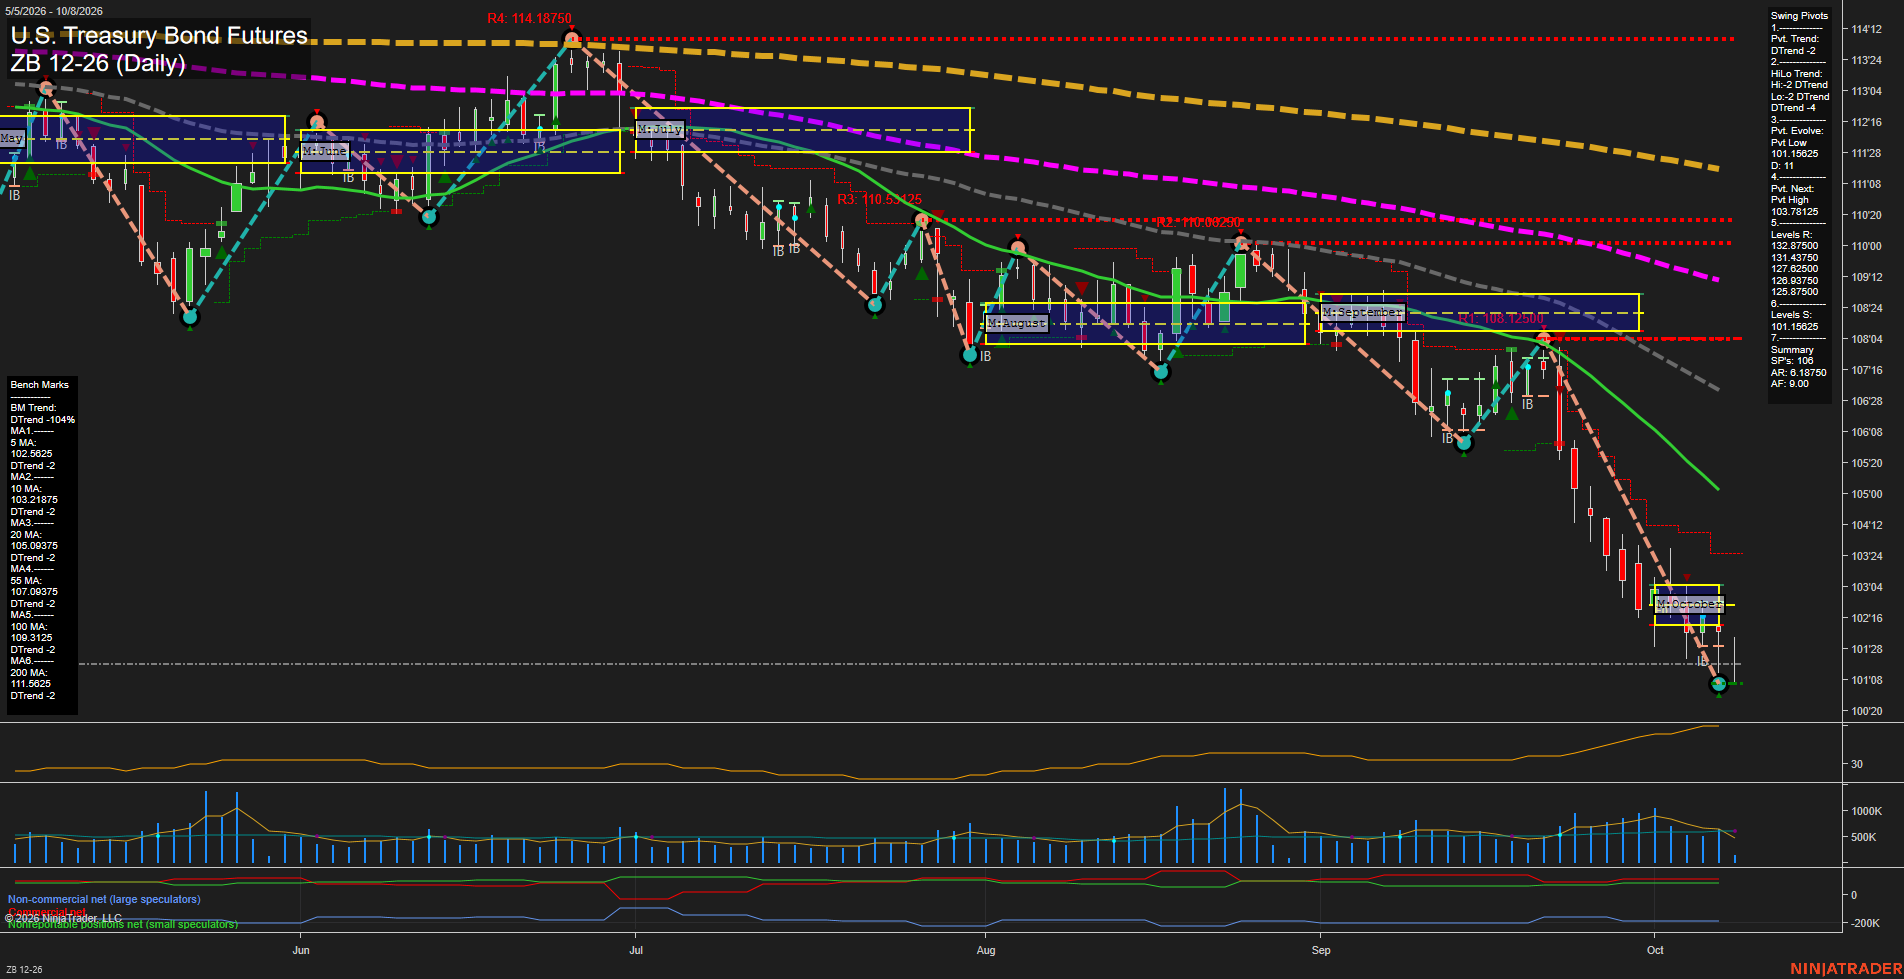
Overall Rating
- Short-Term: Bearish
- Intermediate-Term: Bearish
- Long-Term: Bearish.
Key Insights Summary
ZB remains in a broad, synchronized decline: price is below every daily benchmark and below the weekly, monthly, and yearly Fib-grid centers. The pivot structure remains DTrend on both the short- and intermediate-term measures, with the latest downswing extending to the 101.15625 pivot-low area. The decline has featured large directional bars, fast downside momentum, rising ATR, and elevated recent volume, reflecting an accelerated selloff rather than a balanced consolidation. The 103.78125 pivot-next level defines the nearest structural upside reversal threshold, while the 5-day and 10-day averages remain overhead and declining. Long-term moving-average separation confirms persistent bearish trend alignment.
View charts on: AlphaWebTrader HTF Charts