U.S. stocks hit records as AI-led megacaps and easing Treasury yields lifted the S&P 500 and Nasdaq, while Iran-war energy risks remained elevated.
Fundamentals: U.S. equities closed at record highs, with the S&P 500 rising 0.60% to 7,820.47 and the Nasdaq gaining 0.46% to 27,604.74 as AI-focused megacaps advanced and Treasury yields eased. Market breadth remained weak, while Iran-war disruptions, tight diesel markets and shipping threats kept energy risks in focus. Gold and silver rose as yields and the dollar retreated.
Technicals: Equity ETFs showed mixed leadership at the close, led by gains in Amazon, Microsoft and GLD, while META, IWM and IBIT declined. ES and NQ futures retained bullish readings across short-, intermediate- and long-term time frames, with prices near pivot resistance. YM, EMD, RTY and FDAX reflected more mixed short-term conditions within generally constructive longer-term structures.
After Market Close daily snapshot: market news summary and sentiment, major ETFs, Magnificent 7 analysis, Indices Futures Higher Time Frame Analysis, and E-mini S&P500, Nasdaq 100, NYMEX Crude, Gold Futures Daily Chart analysis.
As of: October 6, 2026 05:00 CT
Market News Summary:
U.S. equities reached fresh records as AI-led technology strength and easing Treasury yields offset concerns over energy costs, rates, and narrow market breadth.
Primary Drivers & Risks:
- Primary Driver: AI-led megacap technology rally
- Primary Risk: Iran-war energy and yield pressures
Tone:
Constructive for headline indices, with notable cross-currents beneath the rally.
Stock Market / ETFs / Indices:
The S&P 500 closed at a record 7,820.47, up 0.60%, while the Nasdaq also reached a record close, rising 0.46% to 27,604.74. AI and large technology stocks, including the Magnificent Seven, drove the advance, while reports highlighted weak breadth, with many stocks lagging and only a small group of trillion-dollar companies outperforming the S&P 500. Dividend-oriented sectors, including real estate, utilities, and materials, faced pressure from higher bond yields.
Geopolitical:
The Iran war continued to disrupt energy supply chains and raised focus on alternative export routes outside the Gulf and Red Sea. Houthi attacks threatened Middle East crude flows and coincided with higher tanker rates, extending regional shipping risks.
Oil / Energy:
The EIA raised oil-price forecasts for this year and next as global inventories declined and diesel markets remained tight amid the Iran war. Crude prices steadied later in the session, while WTI found technical support near $88.66; earlier falling oil prices were cited as easing inflation concerns. CME suspended plans for a 24/7 10-barrel crude-oil contract.
Gold / Metals:
Gold and silver rose as Treasury yields and the dollar pulled back from elevated levels. Central banks added 39 net tonnes of gold in August, led by China, Uzbekistan, and Poland, while reserve managers continued to cite geopolitical and financial-market uncertainty as support for official holdings. Gold recovered from near $4,103 support despite a broader bearish trend cited in one market outlook.
Fed / Financials:
Treasury yields eased from multi-year and multi-decade highs, supporting technology shares and precious metals. Higher yields had pressured dividend stocks and remained a key challenge for equity valuations; reports also referenced the Fed’s first rate hike alongside elevated borrowing costs.
Macro / Other:
AI investment momentum broadened into digital infrastructure and data-center assets, with higher construction costs and interest rates increasing the value of existing capacity. The SEC approved a 3x Bitcoin ETF, while a Supreme Court case examined private-equity access in 401(k) plans.
Conclusion:
Record S&P 500 and Nasdaq closes were driven by AI-related technology strength and easing Treasury yields. The advance remained concentrated in major technology names.
Iran-war disruptions, tight diesel markets, and threats to Middle East shipping kept energy risks elevated. Higher yields continued to weigh on income-oriented equities, while gold demand retained support from central-bank purchases and lower yields.
Market News Sentiment
Market News Articles: 42
- Neutral: 64.29%
- Positive: 21.43%
- Negative: 14.29%
Sentiment Summary: News sentiment is predominantly neutral at 64%, with positive articles at 21% and negative articles at 14% across 42 market news items.
Conclusion: The news flow presents a largely balanced tone for indices futures day traders, with positive coverage exceeding negative coverage.
GLD,Gold Articles: 11
- Neutral: 63.64%
- Positive: 27.27%
- Negative: 9.09%
Sentiment Summary: Gold-related coverage is predominantly neutral (64%), with positive sentiment at 27% and negative sentiment at 9%.
Conclusion: The news tone around GLD and gold is largely neutral, with limited directional bias in the sentiment mix.
USO,Oil Articles: 16
- Neutral: 56.25%
- Negative: 25.00%
- Positive: 18.75%
Sentiment Summary: USO/Oil coverage is predominantly neutral (56%), with negative sentiment (25%) exceeding positive sentiment (19%).
Conclusion: For indices futures day traders, oil-related news tone is balanced-to-cautious, with limited positive skew.
Market Data Snapshot
ETF Snapshot of major stock market ETFs, Mag7, and others as of: October 6, 2026 05:00
Top Movers & Losers
- AMZN 256.29 Bullish 1.95% ▲
- MSFT 529.30 Bullish 0.78% ▲
- GLD 382.27 Bullish 0.72% ▲
- IBIT 48.49 Bearish -0.14% ▼
- META 738.88 Bearish -0.41% ▼
- IWM 281.34 Bearish -0.72% ▼
Major Index ETFs: SPY, QQQ, DIA, IWM, IJH
- SPY 779.09 Bullish 0.55% ▲
- DIA 514.56 Bullish 0.48% ▲
- QQQ 759.66 Bullish 0.46% ▲
- IJH 74.00 Bullish 0.43% ▲
- IWM 281.34 Bearish -0.72% ▼
Major index ETFs were Mixed: SPY led the Bullish moves at +0.55%, followed by DIA at +0.48%, QQQ at +0.46%, and IJH at +0.43%. IWM was the most Bearish mover, down -0.72%, showing small-cap divergence against broad large-cap strength.
Mag 7 Stocks: AAPL, MSFT, GOOG, AMZN, META, NVDA, TSLA
- AMZN 256.29 Bullish 1.95% ▲
- MSFT 529.30 Bullish 0.78% ▲
- TSLA 380.68 Bullish 0.51% ▲
- AAPL 333.63 Bullish 0.22% ▲
- GOOG 344.59 Bullish 0.22% ▲
- NVDA 239.24 Bullish 0.14% ▲
- META 738.88 Bearish -0.41% ▼
Mixed Mag7 snapshot: AMZN is the most bullish mover at +1.95%, followed by MSFT at +0.78% and TSLA at +0.51%. AAPL and GOOG are each Bullish at +0.22%, while NVDA is modestly Bullish at +0.14%. META is the most bearish mover at -0.41%.
Cross-Market ETFs: TLT, GLD, USO, IBIT
- GLD 382.27 Bullish 0.72% ▲
- USO 144.91 Bullish 0.64% ▲
- TLT 77.28 Bullish 0.22% ▲
- IBIT 48.49 Bearish -0.14% ▼
Mixed cross-market snapshot: GLD is the most bullish mover at +0.72%, followed by USO at +0.64% and TLT at +0.22%. IBIT is the most bearish mover, marginally lower at -0.14%.
ETF, Mag7, and Cross-Market ETF Insights
Overall Tone
Mixed tone: large-cap equity ETFs were Bullish while small caps were Bearish, with cross-market signals also Mixed.
Equity ETFs and Mag7:
Major Index ETFs were selectively Bullish: SPY gained +0.55%, DIA rose +0.48%, QQQ added +0.46%, and IJH increased +0.43%, while IWM was Bearish at -0.72%. Mag7 performance was Mixed, led by AMZN at +1.95%, the most bullish mover, while META fell -0.41%; NVDA at +0.14% was marginally Bullish. Equity leadership was concentrated in large caps and AMZN, while small caps were the most bearish mover overall at -0.72%.
Cross-Market ETFs:
Cross-Market ETFs were Mixed, with GLD up +0.72% as the most bullish mover and USO higher by +0.64%, alongside TLT’s modest +0.22% gain. IBIT was marginally Bearish at -0.14%, making it the most bearish cross-market mover and diverging from gains in gold, oil, and bonds.
Futures Indices – Higher Time Frame Analysis
Summary of the current state of US Indices Futures based on higher time-frame (HTF) technical analysis as of: 2026-10-06: 17:00 CT.
US Indices Futures
- ES: YSFG/MSFG/WSFG rising, above benchmarks, UTrend pivots; 7858.25/7906.25 resistance, 7702.25 reversal, 7672.75 support.
- NQ: YSFG/MSFG/WSFG rising, above benchmarks, UTrend pivots; 31539.25/31585.75 resistance, 30592.25 reversal, 29264.75 support.
- YM: YSFG/MSFG rising, WSFG short-term corrective; below 5/10/20-week averages, 50859 support, 53245 reversal, 55316 resistance.
- EMD: YSFG/MSFG rising, weekly DTrend below short averages; 3600.3 support, 3795.3 reversal, 3969.6 resistance; daily recovery above F0% levels.
- RTY: YSFG/MSFG rising, weekly DTrend below short averages; 2791.5 support, 2954.1 reversal, 3101.8 resistance; daily structure remains mixed.
- FDAX: YSFG/MSFG rising, weekly DTrend below short averages; 24978 support, 26038 reversal, 26847 resistance; daily rebound faces 25868-25990.
Overall State
- Short-Term: Neutral
- Intermediate-Term: Bullish
- Long-Term: Bullish
Conclusion
ES and NQ retain aligned bullish YSFG, MSFG, WSFG, benchmark, and pivot conditions near pivot-high resistance. YM is neutral short-term, while EMD, RTY, and FDAX remain in weekly corrective DTrends within rising intermediate- and long-term structures. Daily V-recoveries in EMD, RTY, and FDAX contrast with their lower short-term weekly benchmarks. Broad longer-term correlation remains upward, with index-specific resistance and reversal pivots defining current structure.
Note: Intra-day counter-trend pullbacks or retracements may occur, HTF is context for informational usage and market structure. Glossary: Session Fib Grids periods of YSFG:’Yearly’, MSFG:’Monthly’, WSFG:’Weekly’
For full details visit: AlphaWebTrader Technicals
ES Daily View
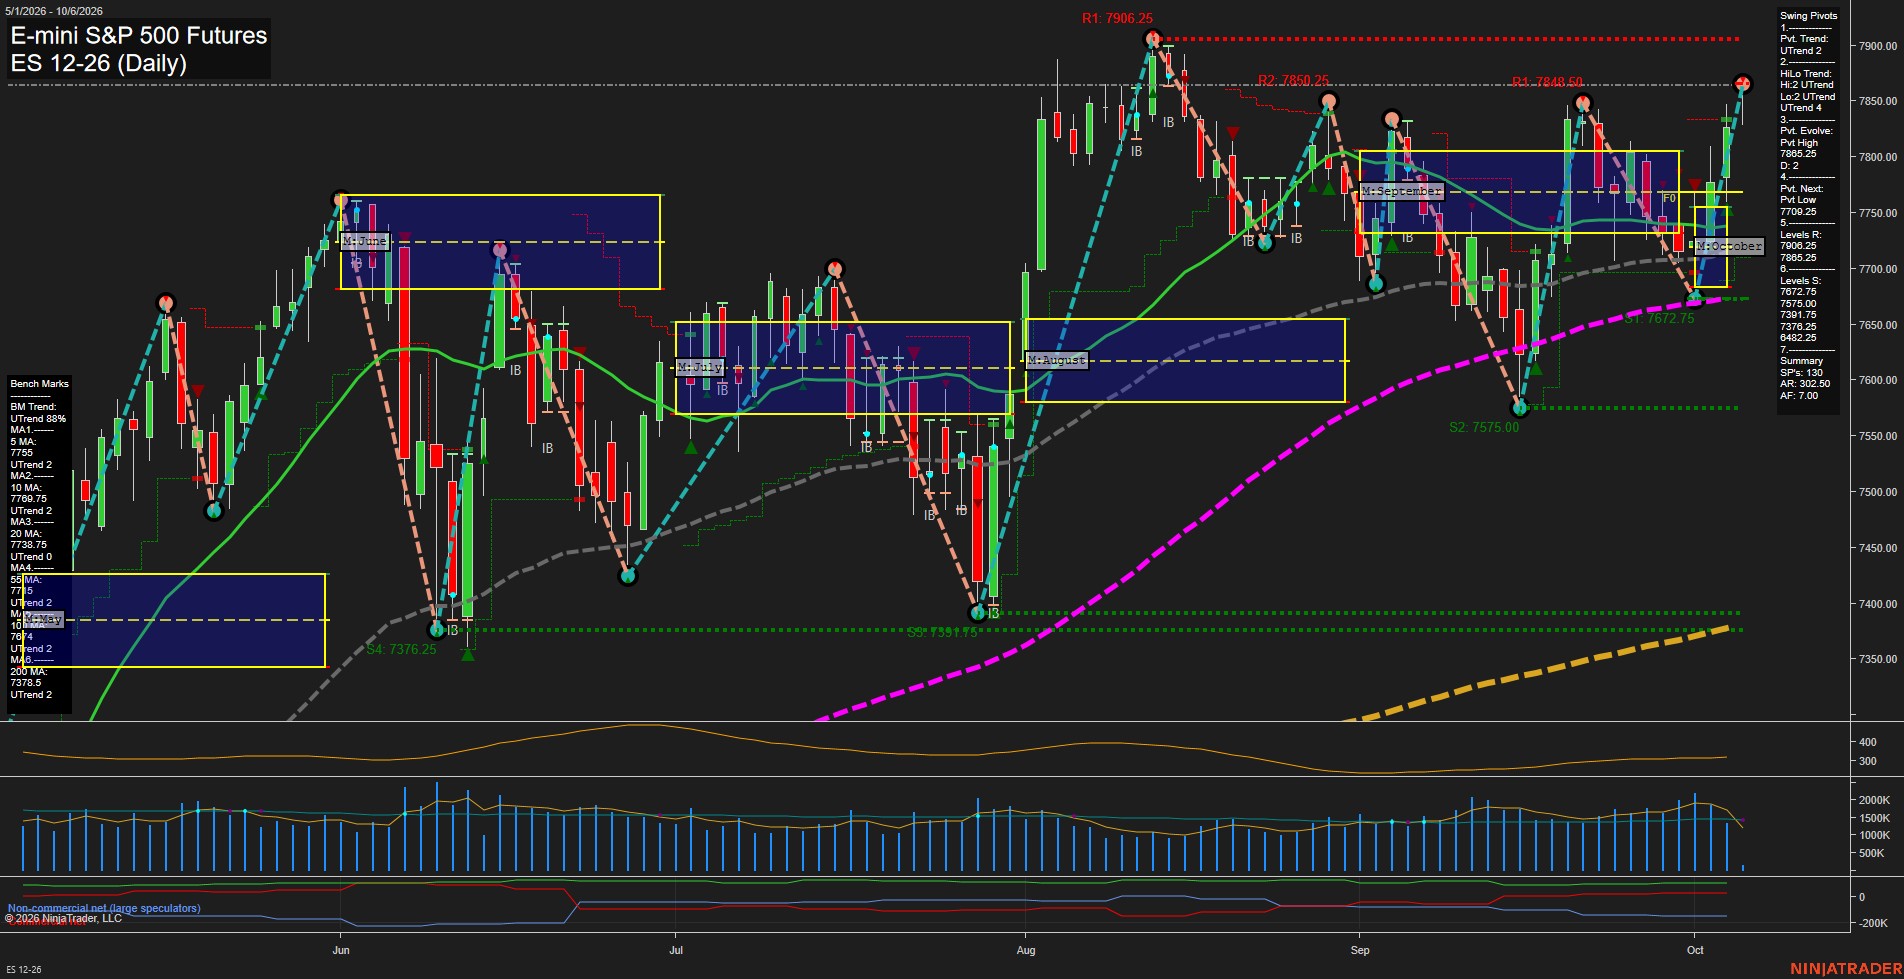
Overall Rating
- Short-Term: Bullish
- Intermediate-Term: Bullish
- Long-Term: Bullish.
Key Insights Summary
Price action has produced a sharp V-recovery from the late-September pullback and returned to the upper portion of the recent range. The short-term and intermediate pivot structures remain in UTrend alignment, while price is above all benchmark moving averages and above the weekly, monthly, and yearly F0% reference areas. The 7858.25 pivot high is the immediate swing reference, with 7906.25 representing the higher resistance level. The recovery has fast momentum and medium-sized daily bars, reflecting expansion after consolidation; 7702.25 is the defined opposite-pivot reversal level, with layered support beginning at 7672.75.
View charts on: AlphaWebTrader HTF Charts
NQ Daily View
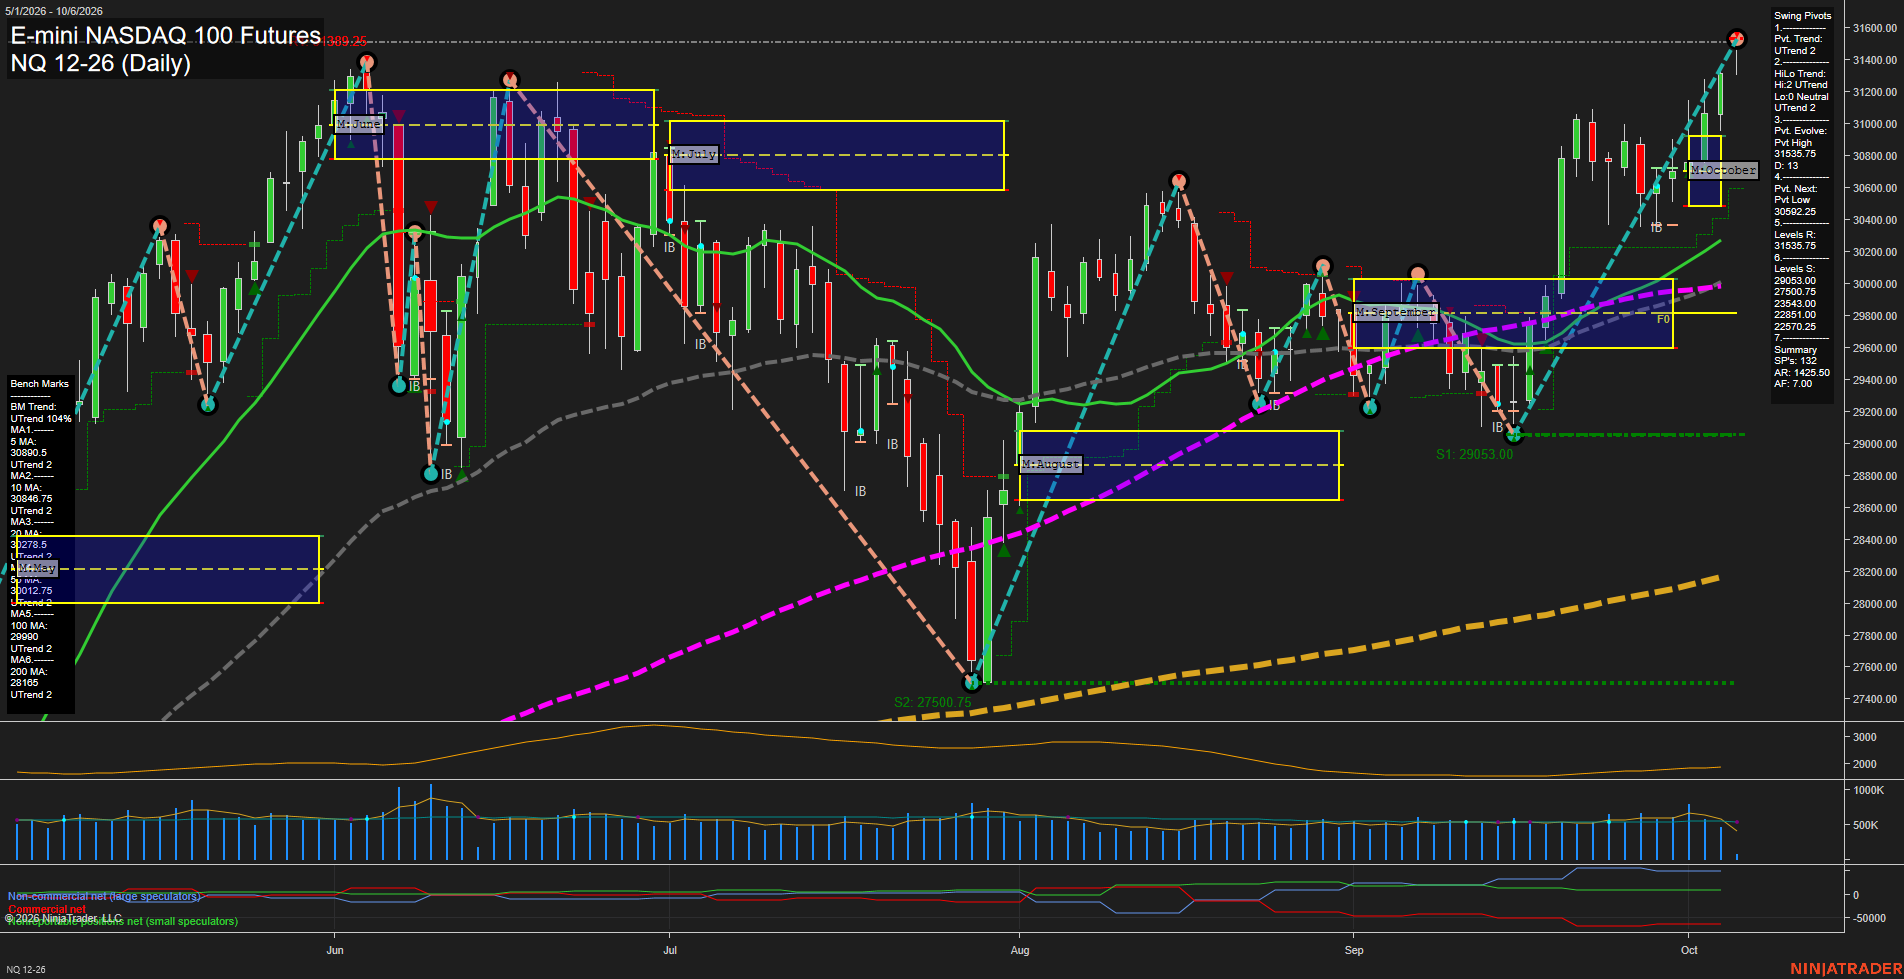
Overall Rating
- Short-Term: Bullish
- Intermediate-Term: Bullish
- Long-Term: Bullish.
Key Insights Summary
Price is extending a strong V-recovery from the August low and has reached a new pivot-high area near 31539.25. The short-term and intermediate pivot structures remain in UTrend, while price is above every benchmark moving average and above the weekly, monthly, and yearly F0% levels. The advance is fast and volatility remains elevated, reflected by large daily bars and the 1618 ATR. The immediate chart structure is a momentum breakout toward overhead pivot resistance at 31555.75, with the 30592.25 pivot-reversal level defining the nearest swing-structure threshold. The broader trend remains constructive, supported by rising 20-, 55-, 100-, and 200-day benchmarks and higher-low behavior since August.
View charts on: AlphaWebTrader HTF Charts
CL Daily View
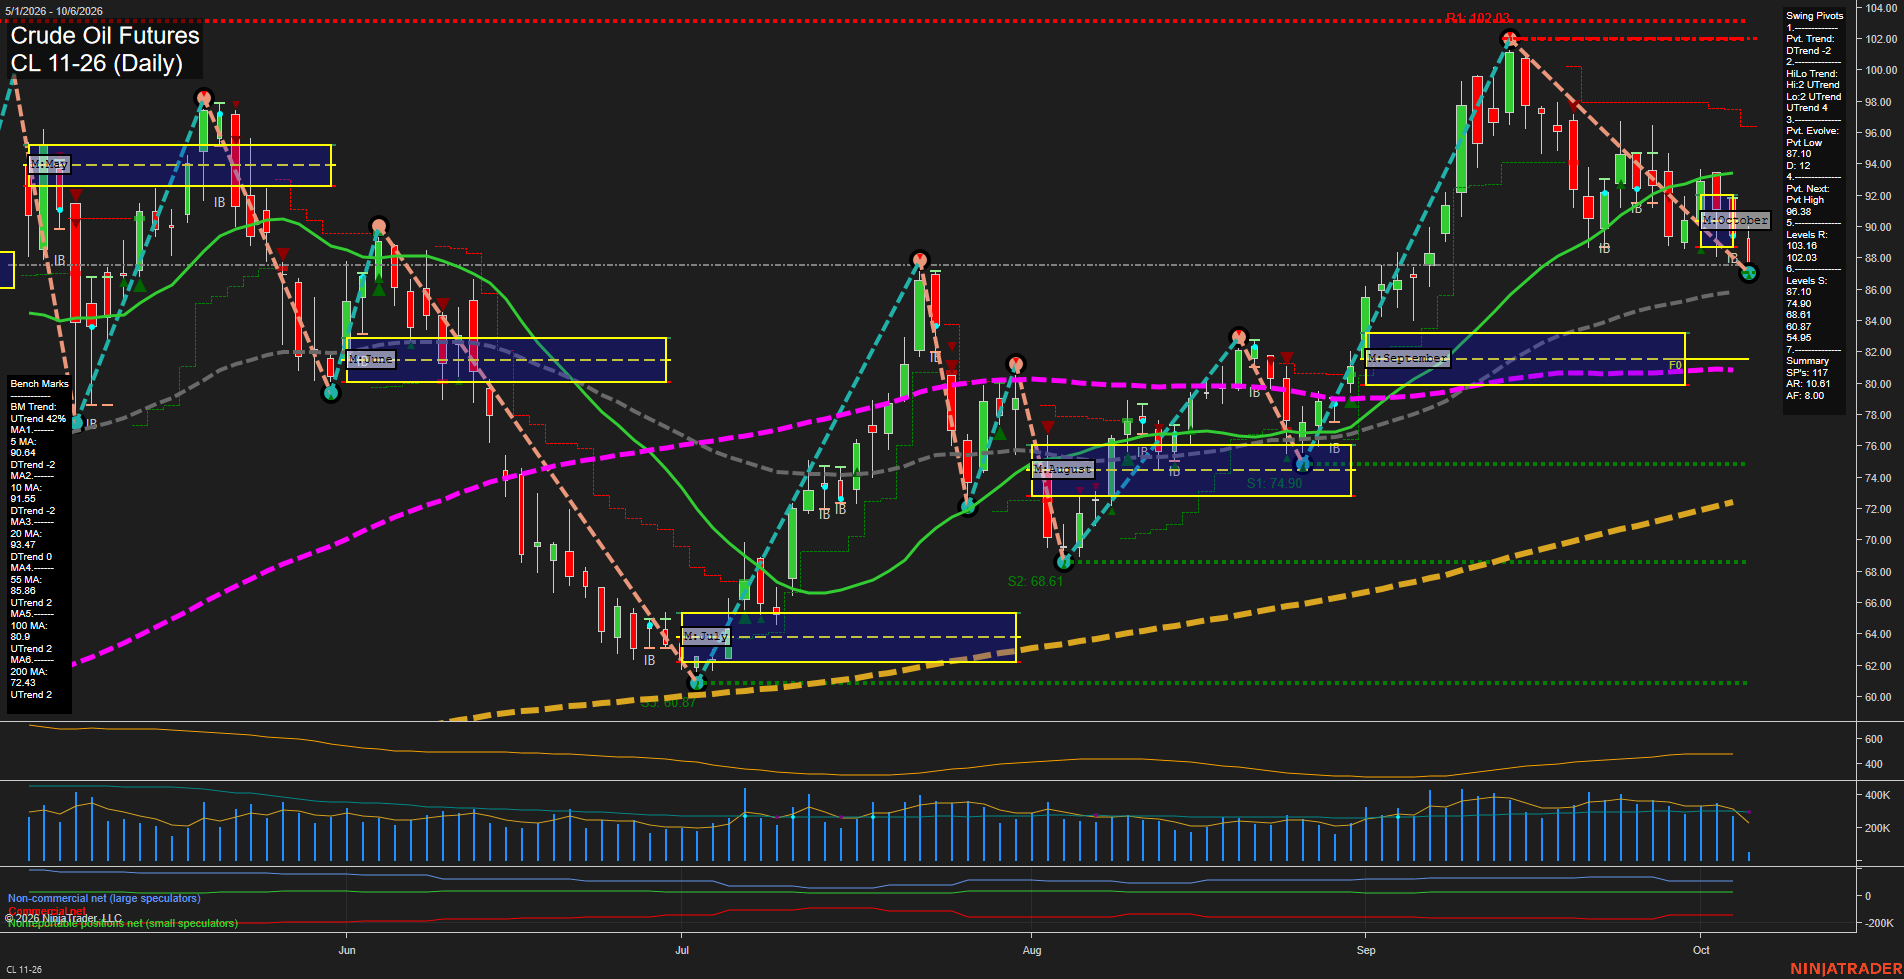
Overall Rating
- Short-Term: Bearish
- Intermediate-Term: Neutral
- Long-Term: Bullish.
Key Insights Summary
Price is in a fast short-term retracement from the 102.03 swing high, with the latest close at the active 87.10 pivot-low support. The short-term structure remains bearish because price is below the 5, 10, and 20-day benchmarks and both weekly and monthly Fib-grid readings are below their F0% areas. The intermediate structure is mixed: the pivot HiLo trend and rising 55-day average remain constructive, while the monthly grid and 20-day average reflect the current corrective leg. The broader yearly trend remains positive above the rising 100-day and 200-day averages. The 87.10 area is the immediate structural inflection point, while 96.38 is the reversal-pivot threshold and 102.03 remains the major overhead swing-high resistance.
View charts on: AlphaWebTrader HTF Charts
GC Daily View
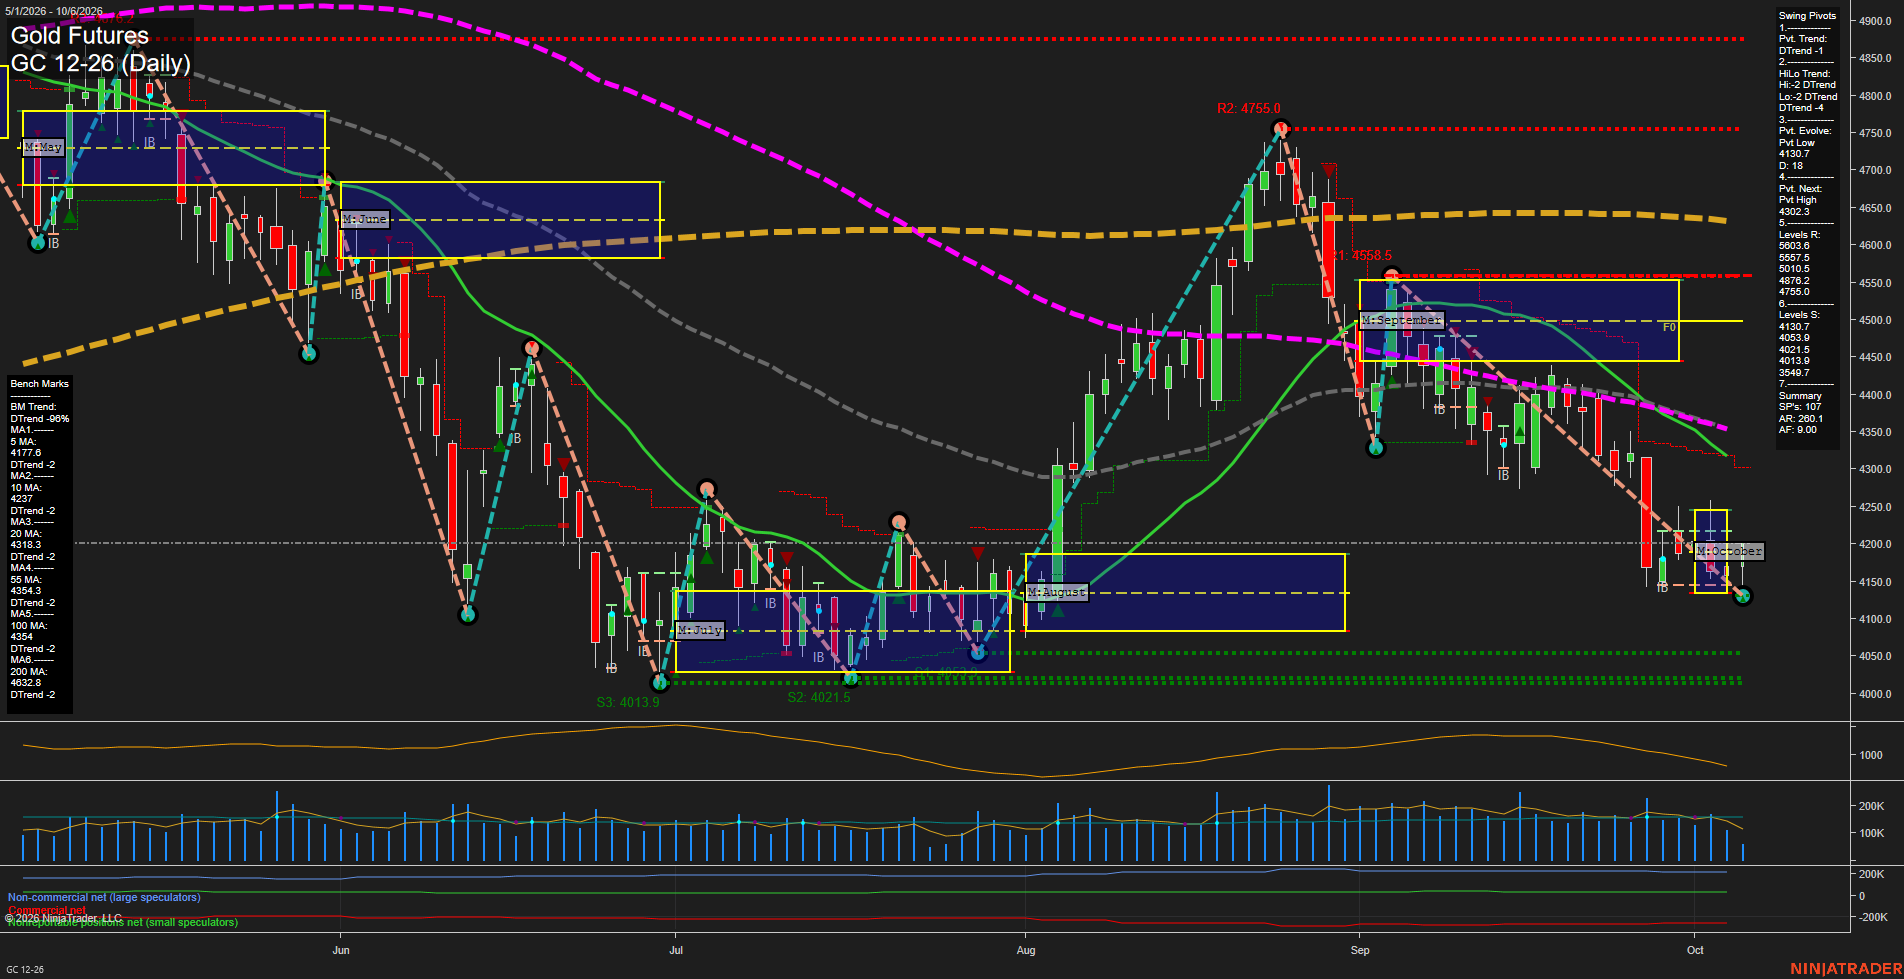
Overall Rating
- Short-Term: Bearish
- Intermediate-Term: Bearish
- Long-Term: Bearish.
Key Insights Summary
Price is consolidating near the 4130.7 swing-low pivot after a sharp September-to-October decline. The weekly grid remains positive, indicating a short-term countertrend bounce structure, but the monthly grid, both pivot trends, and all six declining benchmark averages maintain a broader bearish alignment. The 4303.7 pivot-next level and clustered moving-average zone from 4318.9 to 4354.6 define the nearby overhead technical ceiling, while 4130.7 is the immediate downside pivot reference. Elevated daily range conditions and moderate volume reflect an active, volatile retracement phase within the prevailing intermediate- and long-term downtrend.
View charts on: AlphaWebTrader HTF Charts
ZB Daily View
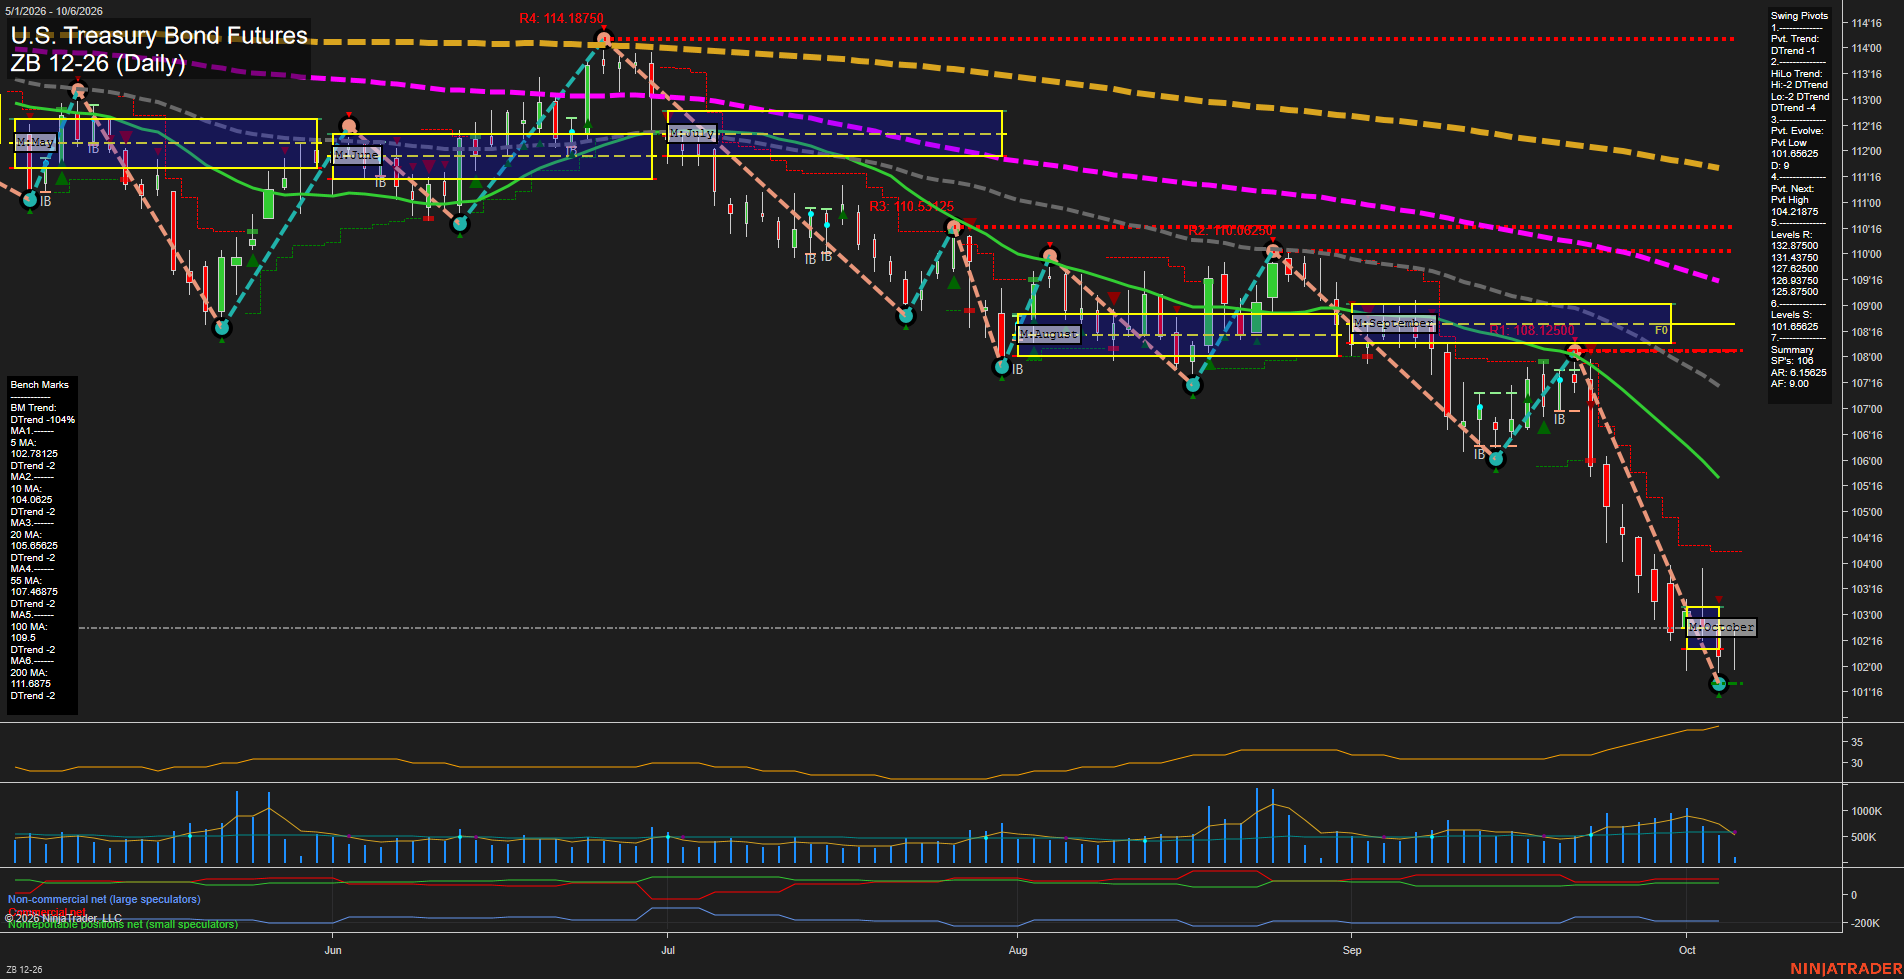
Overall Rating
- Short-Term: Bearish
- Intermediate-Term: Bearish
- Long-Term: Bearish.
Key Insights Summary
ZB remains in a broad, synchronized daily downtrend: price is below every benchmark average, below the weekly and monthly Fib-grid balance areas, and both pivot trend measures remain in DTrend. The sharp selloff has produced large bars, fast downside momentum, rising ATR, and a sequence of lower highs and lower lows. The recent low at 101.0625 defines the active downside pivot, while 104.21875 is the short-term reversal threshold for a new pivot high. The current recovery from the 101 area appears as a countertrend bounce within the prevailing decline, with overhead moving-average structure and the 104.21875 pivot level defining the nearest major technical ceiling.
View charts on: AlphaWebTrader HTF Charts