Index futures review tracks S&P 500 and Nasdaq resistance, mixed global trends, tech ETF moves and oil risks amid softer jobs data and narrow leadership.
Fundamentals: The market backdrop combines heightened Middle East shipping risks with steady OPEC+ production targets, a G7 emergency oil release and continuing refinery constraints. Equities remain supported by AI-related technology shares, though leadership is narrow and defensive signals are elevated. September payroll growth came in below consensus after a Federal Reserve rate increase, adding labor-market softness to a mixed valuation picture.
Technicals: Sunday futures analysis shows broadly bullish longer-term structure in S&P 500 and Nasdaq contracts, though both are testing nearby resistance after strong rebounds. Dow, small-cap, European and emerging-market futures remain more mixed, with several markets in short-term corrective phases. The report also reviews Tesla, Alphabet, Nvidia, bitcoin, gold and oil ETF moves.
Market Week Ahead – Trading 360° view Market Radar for: holidays, earnings, eco-news, market-news summary, news sentiment, and major ETFs, MAG7, Higher Time Frame Analysis Indices Futures Summary, and ETF SPY S&P500, QQQ Tech, USO Oil, GLD Gold Weekly Chart analysis
As of: October 4, 2026 06:15 CT
EcoNews Radar U.S. Events
| Day | Time | Impact | Event |
|---|---|---|---|
| Mon | 10:00 | Medium | ISM Services PMI |
| Wed | 10:30 | Low | Crude Oil Inventories |
| Wed | 14:00 | High | FOMC Meeting Minutes |
| Thu | 08:30 | Medium | Unemployment Claims |
| Fri | 10:00 | Medium | Prelim UoM Consumer Sentiment |
| Fri | 10:00 | Medium | Prelim UoM Inflation Expectations |
EcoNews Summary
Wednesday’s FOMC Meeting Minutes are the week’s sole listed high-impact EcoNews event. The release provides detail on Federal Reserve policy discussions, economic assessments, and views on inflation, growth, and financial conditions.
Event Notes:
- Wednesday 14:00 FOMC Meeting Minutes: A record of the Federal Open Market Committee’s policy meeting discussion. Indices futures participants monitor the language for context on interest-rate policy, inflation concerns, economic conditions, and the balance of risks.
Conclusion:
The single most important day is Wednesday, highlighted by the 14:00 FOMC Meeting Minutes. Market momentum and volume often slow ahead of major FOMC-related events, with increased volatility at release time.
For full details visit: Forex Factory EcoNews
Market News Summary:
Middle East shipping disruptions, oil-supply policy, weak job growth, and narrow AI-led equity leadership frame the market backdrop.
Primary Drivers & Risks:
- Primary Driver: Middle East energy supply uncertainty
- Primary Risk: Strait of Hormuz shipping attacks
Tone:
Cautious, with energy and labor-market cross-currents.
Stock Market / ETFs / Indices:
AI-related technology shares are supporting broader equities while market leadership remains narrow and many individual stocks have posted larger declines. Defensive positioning and credit-market signals remain elevated, while SCHD has outperformed SPY in 2026. S&P 500 valuation measures present mixed signals, with several measures described as expensive despite one popular metric indicating relative cheapness.
Geopolitical:
Tankers have been struck in the Middle East as Iran restates conditions tied to reopening the Strait of Hormuz. Increased shipping attacks have made Hormuz transits more hazardous, while risks also extend to the Red Sea.
Oil / Energy:
OPEC+ kept November output targets steady amid uncertainty surrounding regional crude exports. A G7 emergency release of 100 million barrels has pushed fuel prices lower, but refinery constraints and Middle East disruptions continue to keep diesel supplies tight.
Fed / Financials:
September payroll growth of 29,000 fell below the 90,000 Reuters consensus after a Federal Reserve rate increase. The data has raised concern over labor-market softness, while commentary cited gradual Fed tightening and avoidance of widespread layoffs as equity-market factors.
Macro / Other:
Tariff-refund processing has delayed recovery of funds for some small businesses, with one cited case taking nine months. FedEx has released hundreds of millions of dollars and adjusted its small-business refund process.
Conclusion:
Energy markets are centered on Strait of Hormuz security risks, steady OPEC+ output policy, and the G7 fuel release. Equity performance remains influenced by concentrated AI-related leadership and softer September employment data.
Shipping attacks and refinery constraints keep fuel supplies under pressure despite lower prices from emergency inventories. Elevated defensive positioning, mixed equity valuation signals, and tariff-refund delays add to the broader cross-currents.
Market News Sentiment
Market News Articles: 7
- Neutral: 100.00%
Sentiment Summary: Market news sentiment is 100% neutral across 7 articles.
Conclusion: Indices futures day traders face a neutral news tone, with no positive or negative sentiment imbalance indicated.
No stock-related news items found.
Sentiment Summary: No stock-related news items were identified, leaving no measurable news-driven sentiment signal for indices futures.
Conclusion: The available snapshot is neutral due to the absence of relevant market news.
USO,Oil Articles: 5
- Neutral: 40.00%
- Negative: 40.00%
- Positive: 20.00%
Sentiment Summary: USO/Oil coverage is mixed to negative, with 40% neutral, 40% negative, and 20% positive articles.
Conclusion: Oil-related news presents a cautious tone for indices futures traders, with negative coverage outweighing positive coverage.
SPY Weekly View
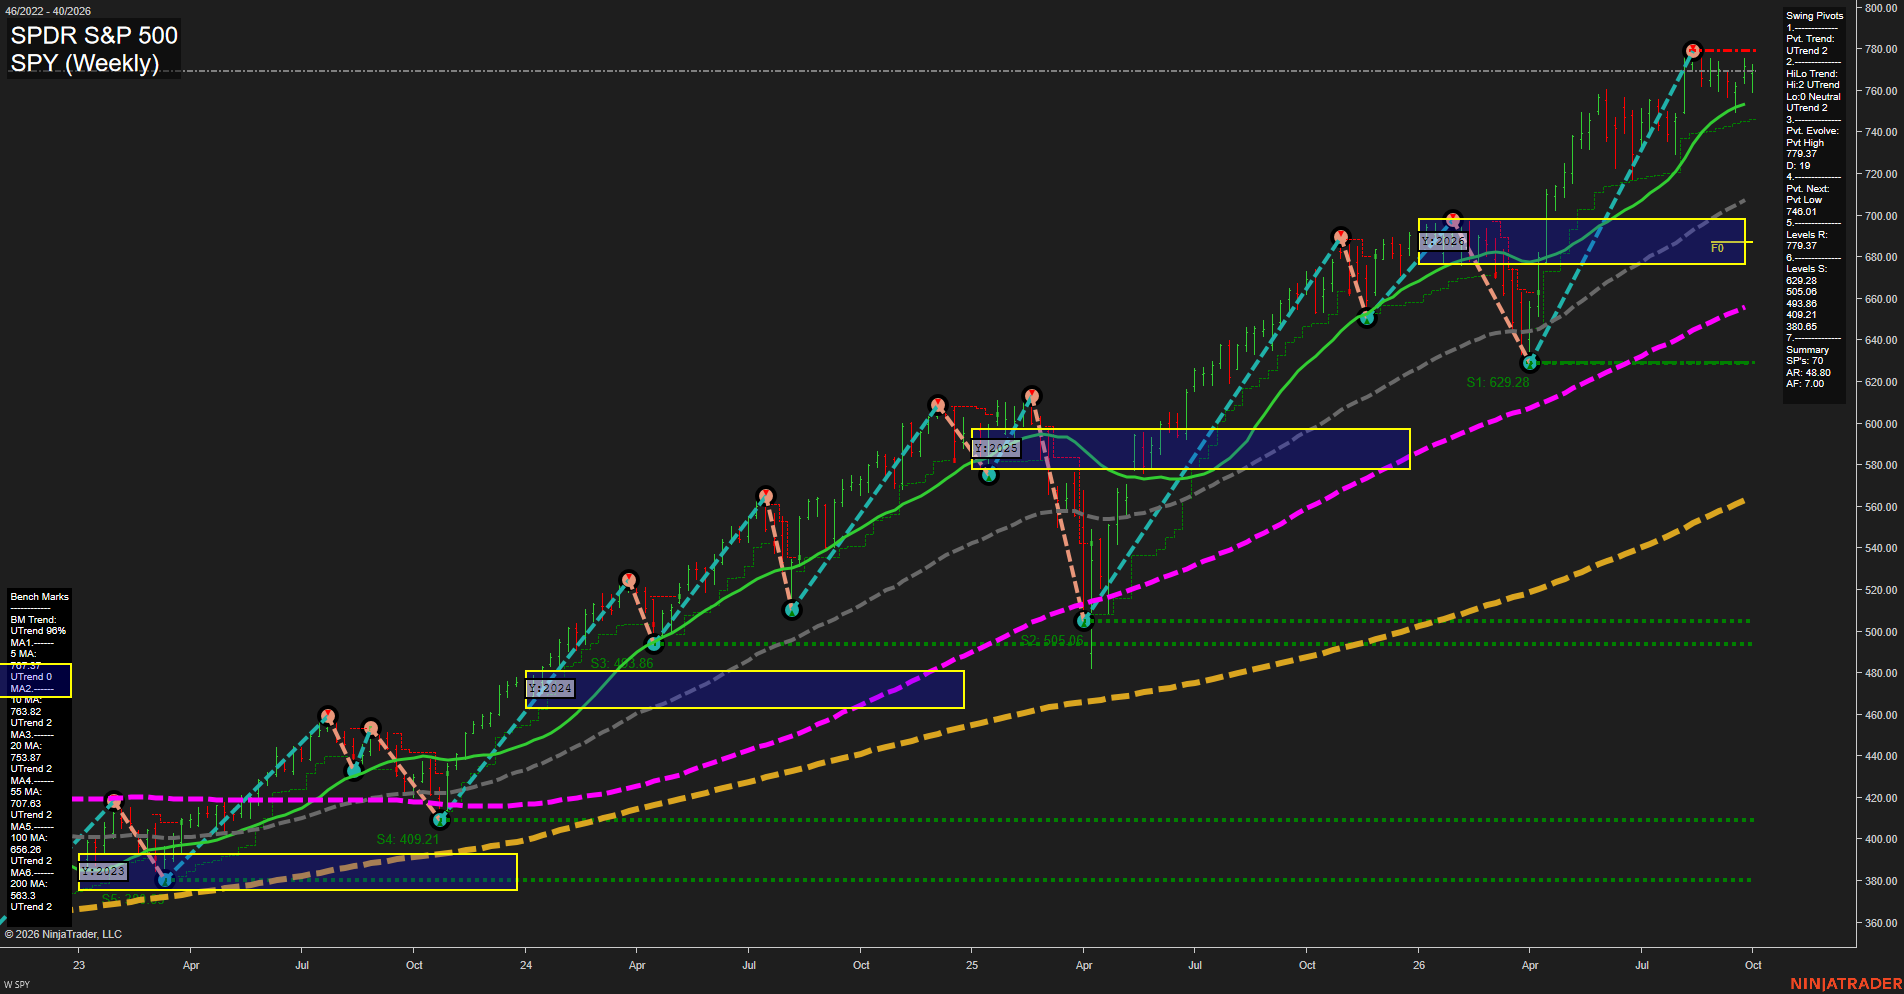
Overall Rating
- Short-Term: Bullish
- Intermediate-Term: Bullish
- Long-Term: Bullish.
Key Insights Summary
Weekly structure remains decisively upward for an index-futures swing perspective: price is consolidating near the 779.37 pivot-high resistance while holding above every benchmark average. The recent bars are small and momentum has slowed, characterizing high-level compression rather than a broad trend reversal. The 746.01 pivot-low threshold defines the current short-term swing structure, while the 20-week benchmark near 753.87 is the nearer trend reference beneath price. The 2026 yearly fib range around 680-700 has been left well below, underscoring the strength of the longer-term advance; 779.37 is the immediate upside pivot reference and 629.28 remains the major visible swing-support level.
View charts on: AlphaWebTrader HTF Charts
QQQ Weekly View
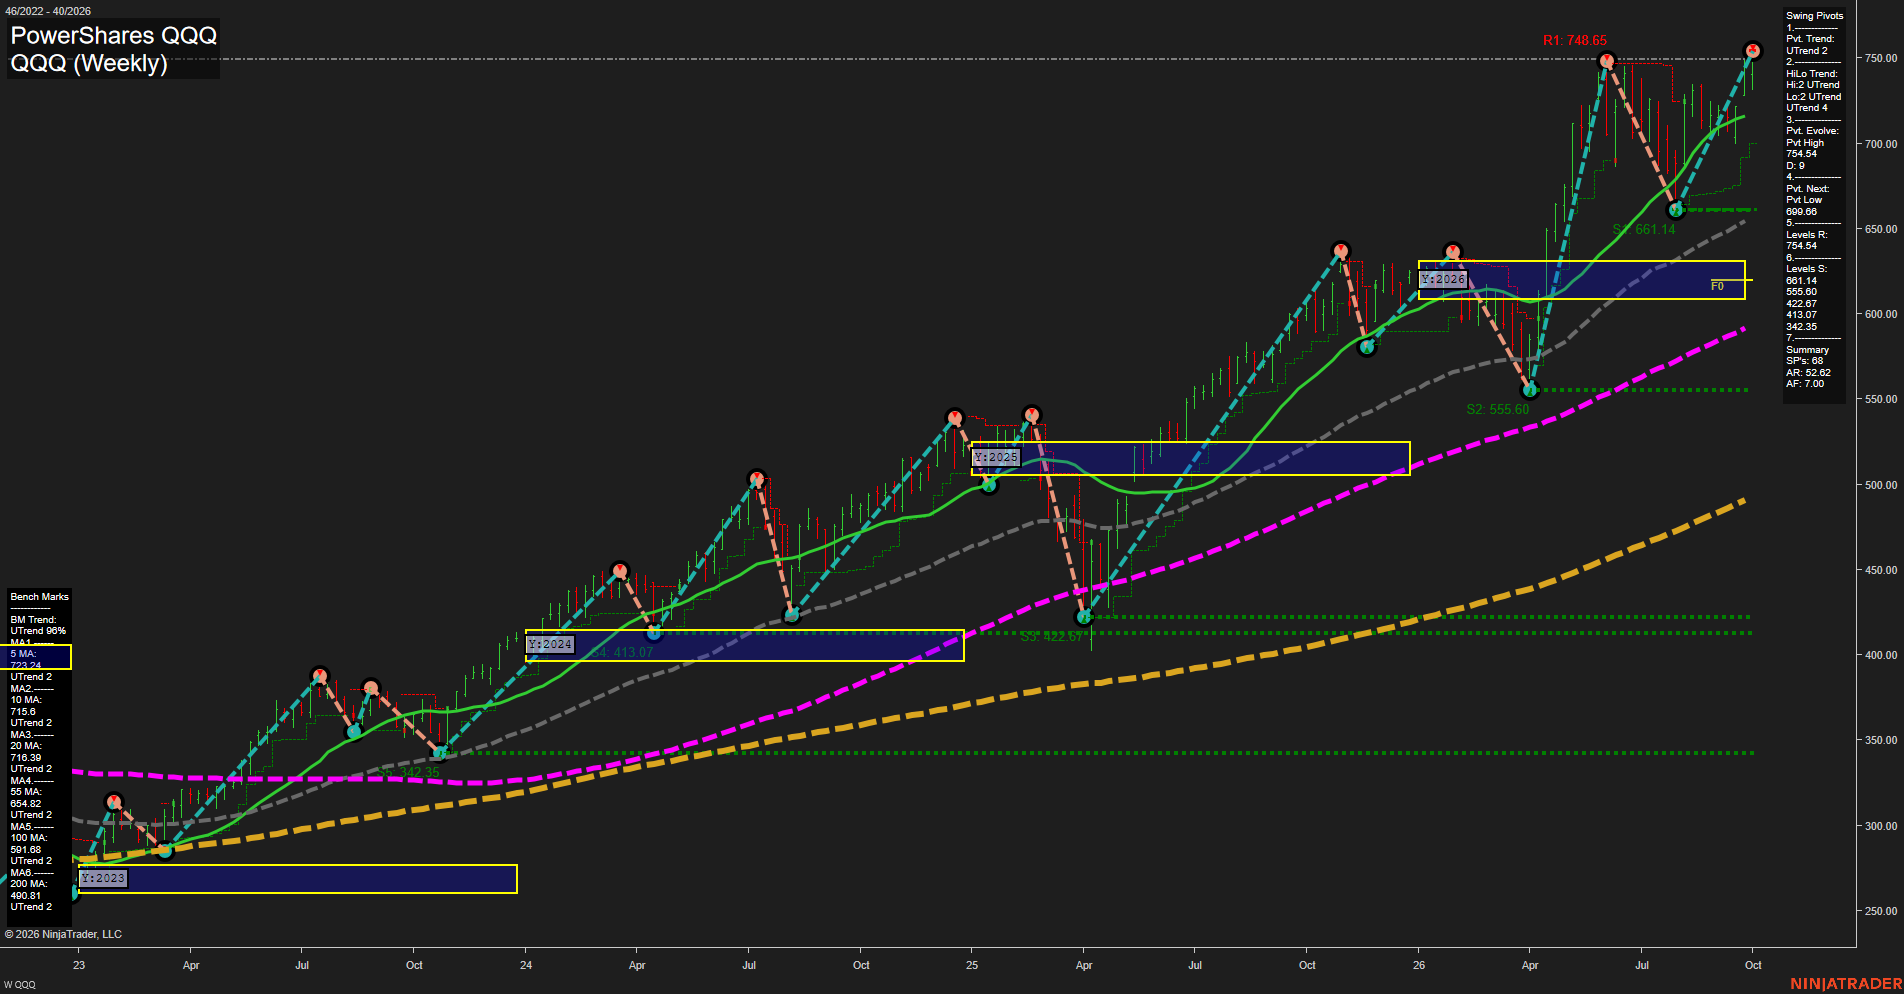
Overall Rating
- Short-Term: Bullish
- Intermediate-Term: Bullish
- Long-Term: Bullish.
Key Insights Summary
QQQ, a directional proxy for Nasdaq index futures, remains in a broad bullish weekly structure: price is above every benchmark average and both pivot trend measures are upward. The market is pressing the 754.54 pivot-high resistance after a fast recovery from the 699.68 support pivot, creating a near-term high-test/consolidation condition. The rising 5-, 10-, and 20-week benchmarks clustered near 716-723 define the nearer trend foundation, while 661.14 is the next important structural support beneath the current pivot low. The yearly grid is decisively above its NTZ and F0% region, confirming a mature long-term advance despite short-term volatility around the prior high.
View charts on: AlphaWebTrader HTF Charts
USO Weekly View
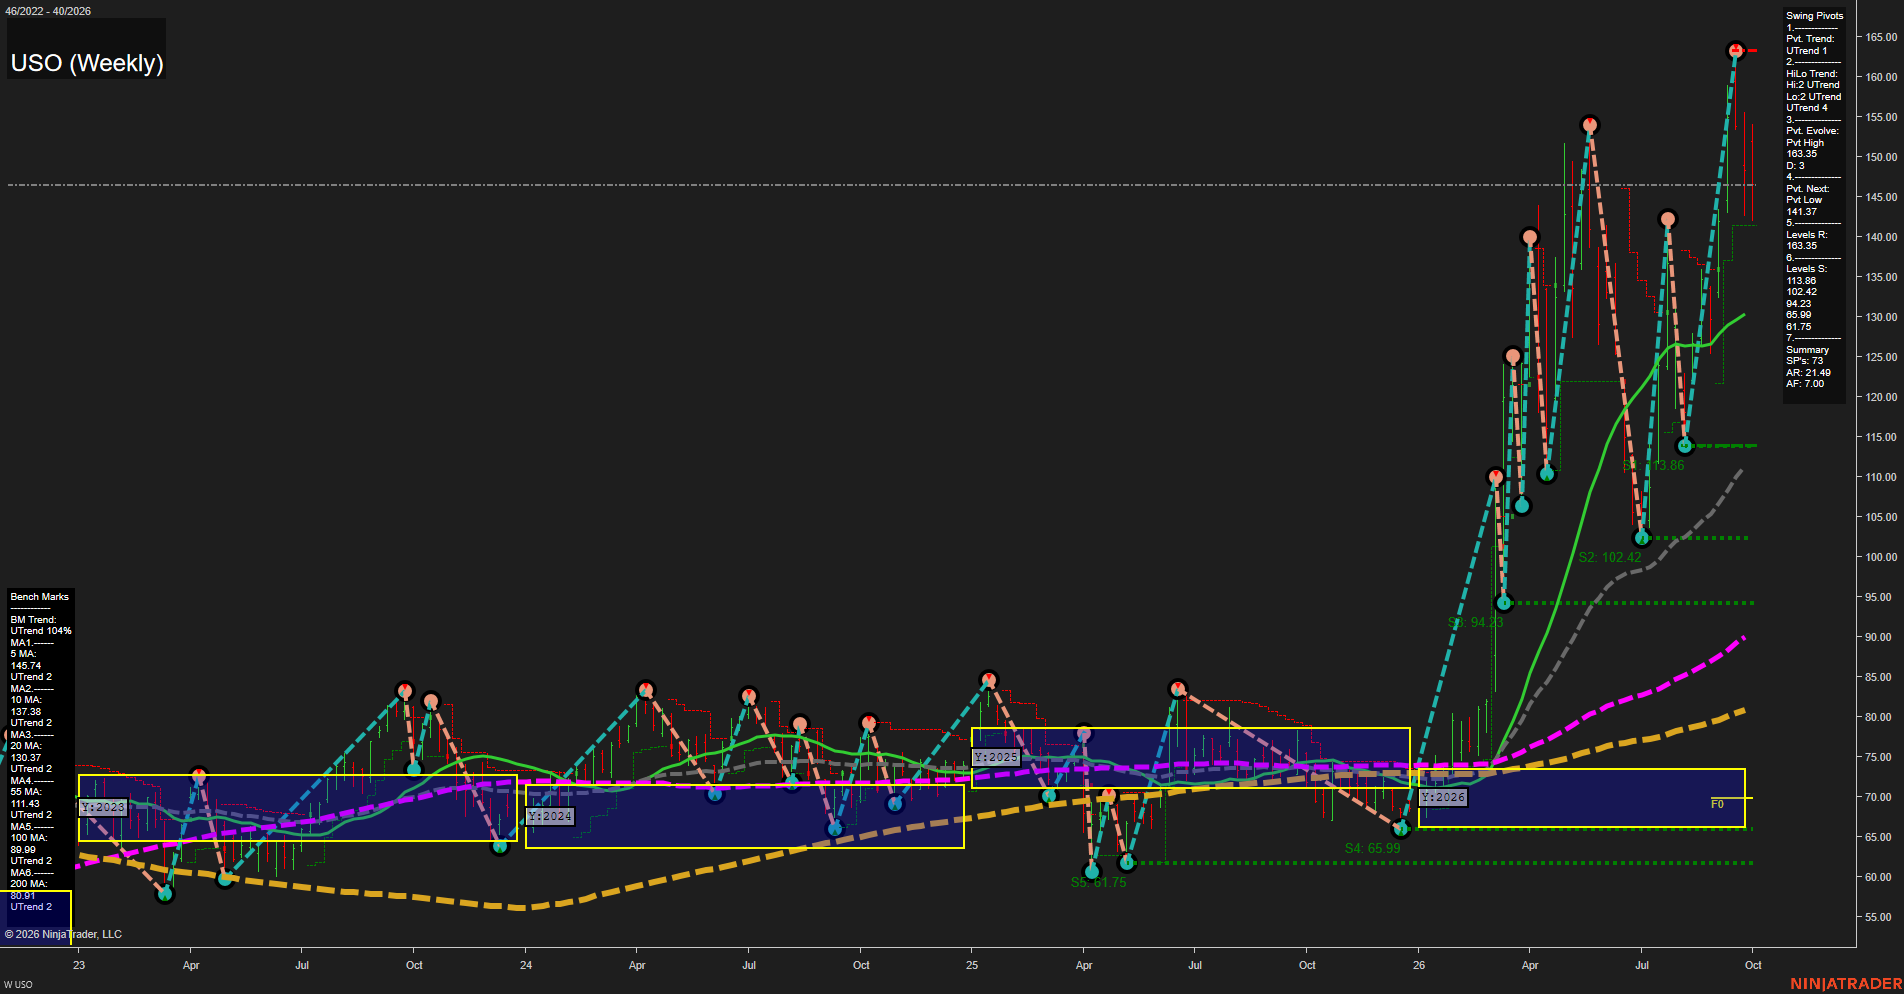
Overall Rating
- Short-Term: Bullish
- Intermediate-Term: Bullish
- Long-Term: Bullish.
Key Insights Summary
USO reflects an exceptionally strong oil-linked futures swing expansion, with price holding above every rising weekly benchmark and materially above the 2026 yearly F0%/NTZ zone near the low-70s. The short-term pivot structure remains in an UTrend, although the recent rejection from 163.35 has produced very large weekly ranges and fast momentum. The 141.37 pivot-low reversal level is the nearest structural reference beneath price; a move below it would define a short-term swing change, while 163.35 remains the established upside pivot resistance. The intermediate and long-term structure remains broadly aligned upward, supported by higher moving averages and a major separation between price and the 55, 100, and 200-period benchmarks.
View charts on: AlphaWebTrader HTF Charts
GLD Weekly View
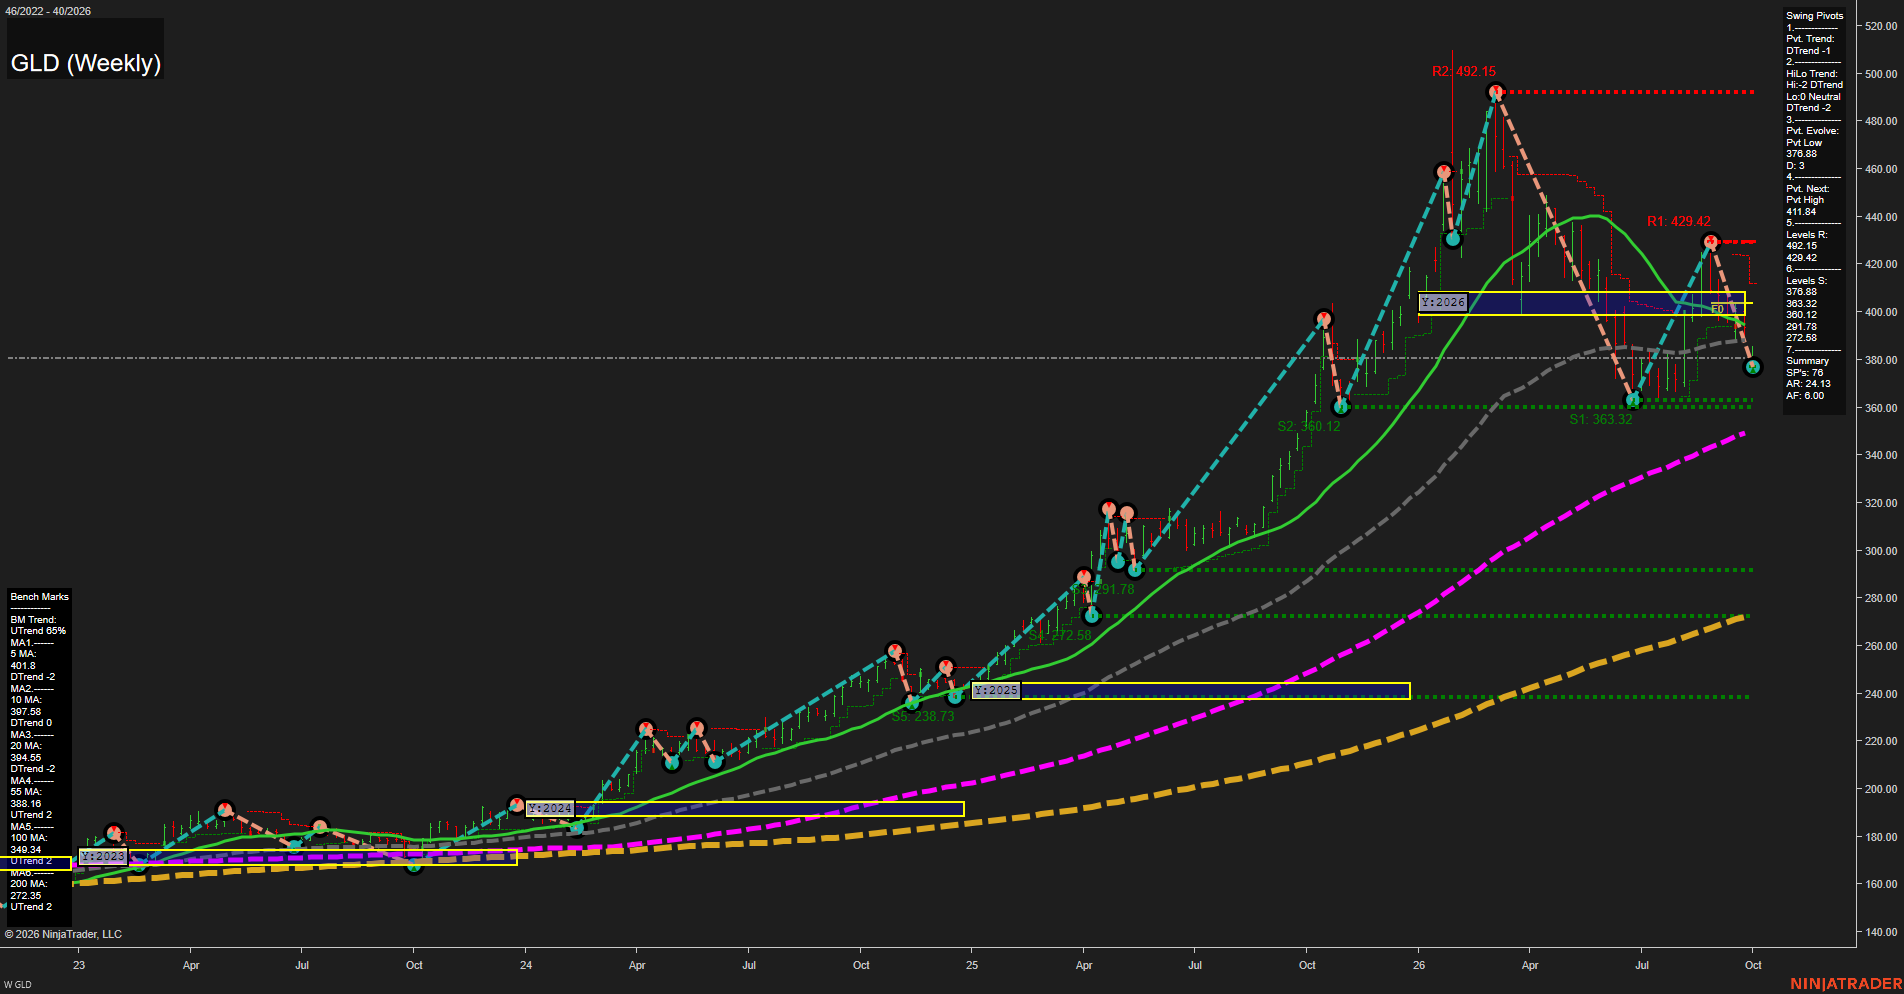
Overall Rating
- Short-Term: Bearish
- Intermediate-Term: Bearish
- Long-Term: Bullish.
Key Insights Summary
GLD reflects a sharp weekly countertrend decline from the 429.42 swing-high area, with price beneath the 5-, 10-, 20-, and 55-week benchmarks and below the 2026 F0%/NTZ zone. The short-term pivot structure remains bearish, with 376.88 serving as the active pivot-low reference and 363.32-360.12 forming the next clustered support zone. The broader futures-swing backdrop remains structurally bullish because the 100- and 200-week benchmarks continue rising and remain well below price, although the current weekly sequence is characterized by lower highs, downside momentum, and a corrective retracement within that major uptrend.
View charts on: AlphaWebTrader HTF Charts
ZB Weekly View
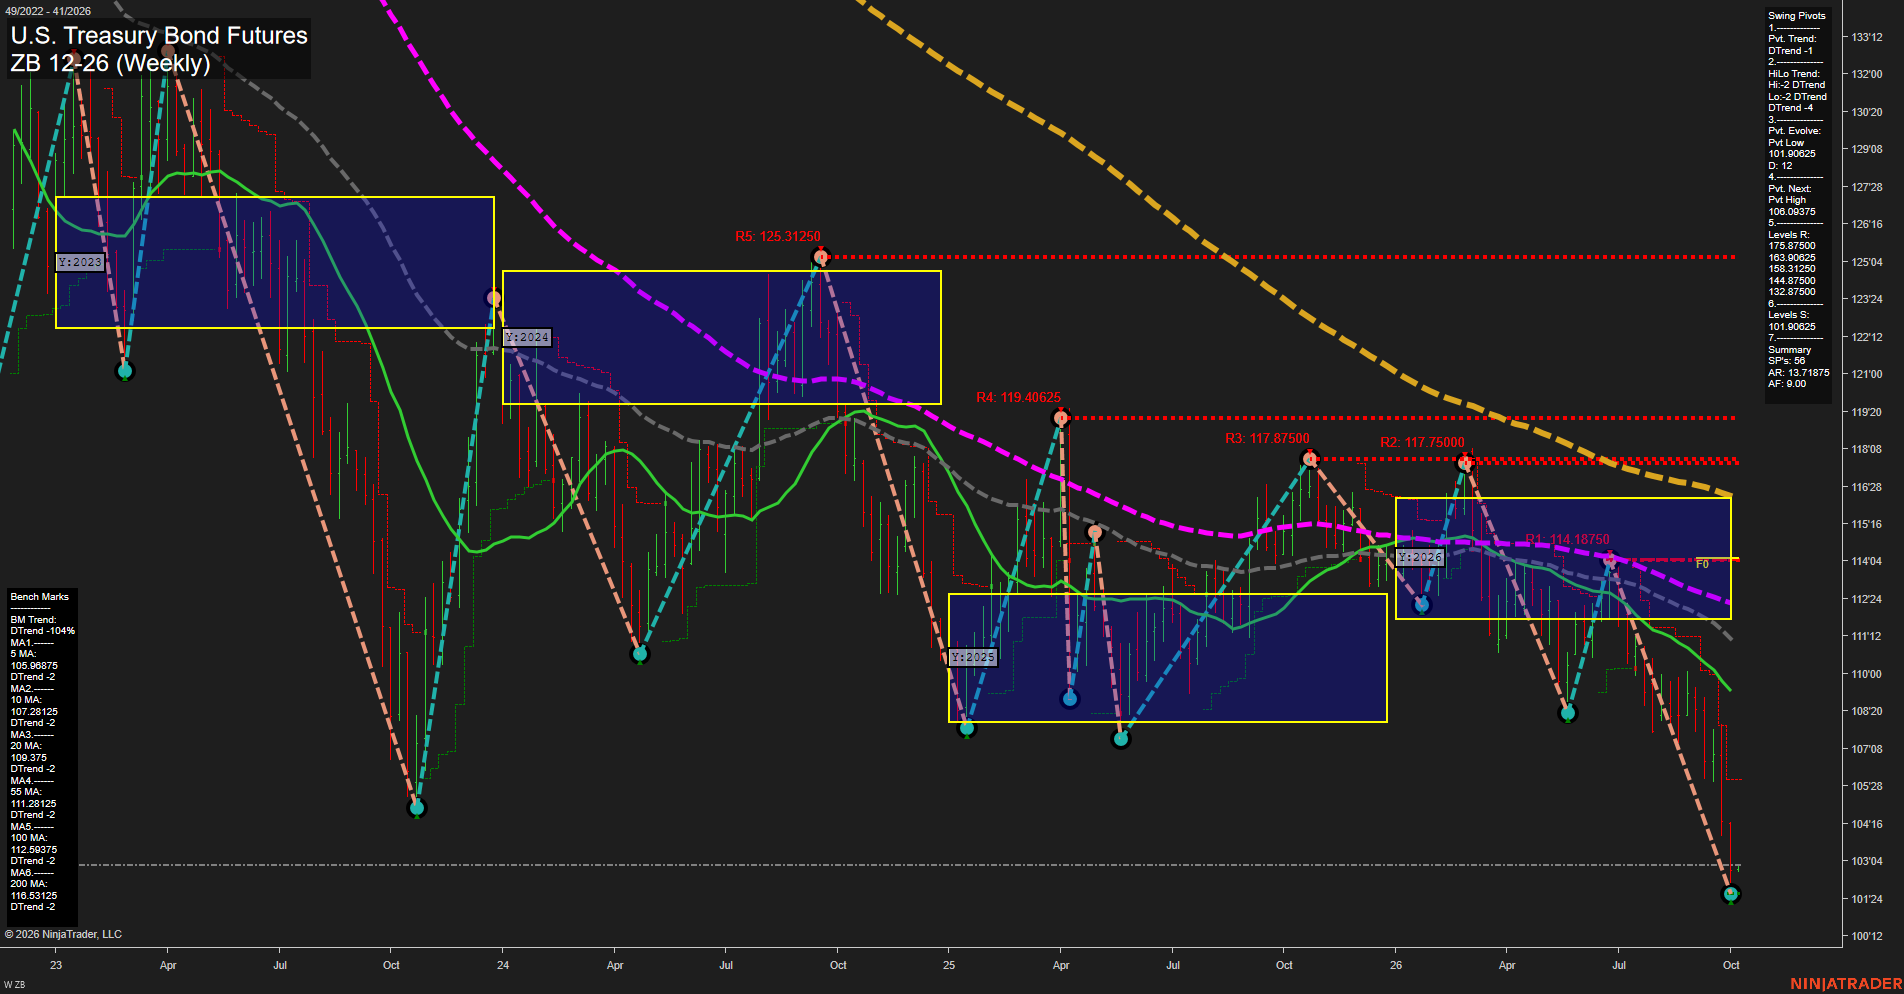
Overall Rating
- Short-Term: Bearish
- Intermediate-Term: Bearish
- Long-Term: Bearish.
Key Insights Summary
Price remains in a decisive weekly decline, with large-range selling bars driving below the weekly and yearly F0% areas and beneath every benchmark moving average. The pivot structure is bearish across both short- and intermediate-term measurements, with lower highs and lower lows extending into the 101.5625 pivot low. The October monthly grid remains marginally positive and represents a countertrend condition within the broader decline, while the weekly and yearly grids, benchmark alignment, and fast downside momentum retain a bearish swing-trend character. The 106.09375 next-pivot threshold defines the nearest meaningful upside reversal reference, while 101.90625 and the 101.5625 pivot low frame the immediate downside structure.
View charts on: AlphaWebTrader HTF Charts