U.S. stocks edged higher as Treasury yields retreated, while bond-market stress, mortgage costs, diesel disruptions and weak breadth persisted.
Fundamentals: U.S. equities closed modestly higher following volatile trade, supported by a retreat in Treasury yields and reduced expectations for an October rate increase. The S&P 500 stayed near record levels, but weak market breadth underscored uneven participation. Long-term bond-market stress, a 7.28% average 30-year mortgage rate, disrupted diesel flows and persistent inflation concerns remained key pressures across markets.
Technicals: Market action was mixed at the close, with USO, NVDA and IBIT higher while AAPL and GOOG declined. Futures technicals showed bearish daily conditions in ES, YM, EMD, RTY and FDAX, while NQ retained bullish daily alignment. Weekly and longer-term readings remained generally constructive, framing weakness in several contracts as retracement within broader uptrends.
After Market Close daily snapshot: market news summary and sentiment, major ETFs, Magnificent 7 analysis, Indices Futures Higher Time Frame Analysis, and E-mini S&P500, Nasdaq 100, NYMEX Crude, Gold Futures Daily Chart analysis.
As of: October 1, 2026 05:00 CT
Market News Summary:
Equity gains followed a sharp Treasury-yield reversal, while elevated long-term rates, housing stress, global bond-market strains, and energy supply disruptions remained key cross-currents.
Primary Drivers & Risks:
- Primary Driver: Treasury yield retreat
- Primary Risk: Global bond-market stress
Tone:
Choppy and cautiously constructive, with persistent rate and inflation pressures.
Stock Market / ETFs / Indices:
U.S. stocks finished modestly higher after volatile trading as Treasury yields retreated and perceived odds of an October rate increase declined. The S&P 500 remained near record territory, though market breadth was weak. Telecom and real estate were highlighted for dividend growth and relative value, while rising yields and AI-related credit concerns pressured major technology valuations.
Geopolitical:
Middle East and Ukraine wars disrupted diesel shipment routes. The Strait of Hormuz remained a focal point amid reports that U.S. naval actions opened passage to most traffic while restricting Iranian oil exports.
Oil / Energy:
Diesel prices surged amid disrupted export flows, raising concerns around transport-related consumer goods costs. WTI rebounded from support but faced technical resistance near $97.68; European winter energy strains and Hormuz shipping flows remained in focus.
Gold / Metals:
Gold and silver firmed as Treasury yields pulled back and October Fed-hike bets softened, despite a strong dollar and still-elevated yields. Gold remained below resistance, with cited support near $4,111, while Bank of America flagged risk of prices falling below $4,000 during the fourth quarter.
Fed / Financials:
The 10-year Treasury yield briefly reached 5.34%, its highest level since 2002, before retreating as buyers returned to Treasuries. European long-term bond yields continued rising, and commentary described stress from unwinding hedge-fund trades. Fed Vice Chair Philip Jefferson signaled officials needed more time before deciding on another increase; Governor Lisa Cook cited AI-related materials and labor shortages as a 2027 inflation risk.
Macro / Other:
The average 30-year fixed mortgage rate rose to 7.28% from 7.03%, reaching its highest level since 2023 and adding pressure to the housing market. Higher diesel costs also pointed to added price pressure for shipped household goods and groceries.
Conclusion:
The Treasury reversal and softer near-term rate-hike expectations supported equities after a volatile session. Elevated yields remained the central influence across stocks, housing, and precious metals.
Global bond-market instability, expensive mortgage financing, diesel supply disruptions, and AI-related inflation concerns remained material cross-currents. Equity index strength near records contrasted with weak participation among individual stocks.
Market News Sentiment
Market News Articles: 37
- Neutral: 51.35%
- Positive: 27.03%
- Negative: 21.62%
Sentiment Summary: Of 37 market news articles, 51% were neutral, 27% positive, and 22% negative, indicating predominantly balanced coverage with a modest positive tilt.
Conclusion: Indices futures day traders are facing largely neutral news flow, with positive articles exceeding negative articles.
GLD,Gold Articles: 15
- Neutral: 46.67%
- Positive: 33.33%
- Negative: 20.00%
Sentiment Summary: Gold coverage is neutral overall, with 47% neutral, 33% positive, and 20% negative articles.
Conclusion: The gold news tone is balanced with a modest positive skew, providing limited directional sentiment context for indices futures.
USO,Oil Articles: 15
- Positive: 40.00%
- Neutral: 33.33%
- Negative: 26.67%
Sentiment Summary: USO/Oil coverage was moderately positive, with 40% positive, 33% neutral, and 27% negative articles across 15 items.
Conclusion: Oil-related news tone was slightly constructive but mixed, indicating no strong consensus in the coverage.
Market Data Snapshot
ETF Snapshot of major stock market ETFs, Mag7, and others as of: October 1, 2026 05:00
Top Movers & Losers
- USO 149.58 Bullish 2.69% ▲
- NVDA 232.15 Bullish 1.65% ▲
- IBIT 48.04 Bullish 1.48% ▲
- DIA 508.27 Bearish -0.06% ▼
- AAPL 329.76 Bearish -0.98% ▼
- GOOG 335.28 Bearish -1.60% ▼
Major Index ETFs: SPY, QQQ, DIA, IWM, IJH
- IJH 72.68 Bullish 1.01% ▲
- QQQ 743.35 Bullish 0.48% ▲
- IWM 279.19 Bullish 0.47% ▲
- SPY 764.59 Bullish 0.26% ▲
- DIA 508.27 Bearish -0.06% ▼
Major Index ETFs were Mixed: IJH led bullish participation at +1.01%, followed by QQQ at +0.48%, IWM at +0.47%, and SPY at +0.26%. DIA was the most bearish mover, marginally lower at -0.06%.
Mag 7 Stocks: AAPL, MSFT, GOOG, AMZN, META, NVDA, TSLA
- NVDA 232.15 Bullish 1.65% ▲
- MSFT 515.89 Bullish 0.58% ▲
- TSLA 356.86 Bullish 0.58% ▲
- META 727.33 Bullish 0.30% ▲
- AMZN 249.30 Bullish 0.06% ▲
- AAPL 329.76 Bearish -0.98% ▼
- GOOG 335.28 Bearish -1.60% ▼
Mag7 is Mixed: NVDA is the most bullish mover at +1.65%, while GOOG is the most bearish mover at -1.60%. MSFT and TSLA are Bullish at +0.58% each; META is Bullish at +0.30%; AMZN is marginally Bullish at +0.06%. AAPL is Bearish at -0.98%.
Cross-Market ETFs: TLT, GLD, USO, IBIT
- USO 149.58 Bullish 2.69% ▲
- IBIT 48.04 Bullish 1.48% ▲
- GLD 382.81 Bullish 0.52% ▲
- TLT 77.74 Bearish -0.05% ▼
Other ETFs were Bullish overall: USO led gains at +2.69%, followed by IBIT at +1.48% and GLD at +0.52%. TLT was the most bearish mover but remained marginally lower at -0.05%.
ETF, Mag7, and Cross-Market ETF Insights
Overall Tone
Mixed: equity benchmarks were modestly Bullish overall, while leadership was selective across Mag7 and cross-market strength was led by oil.
Equity ETFs and Mag7:
Major Index ETFs were broadly but modestly Bullish, led by IJH +1.01%, with QQQ +0.48%, IWM +0.47%, SPY +0.26%, and marginally Bearish DIA -0.06%. Mag7 action was selective: NVDA was the most bullish equity mover at +1.65%, while GOOG was the most bearish at -1.60%; MSFT and TSLA each gained +0.58%, META rose +0.30%, AMZN was near-flat at +0.06%, and AAPL declined -0.98%.
Cross-Market ETFs:
Cross-market ETFs were Bullish overall, led by USO as the most bullish mover at +2.69%, ahead of IBIT at +1.48% and GLD at +0.52%. TLT was marginally Bearish at -0.05%, making it the most bearish cross-market mover and showing divergence from oil, bitcoin, and gold strength.
Futures Indices – Higher Time Frame Analysis
Summary of the current state of US Indices Futures based on higher time-frame (HTF) technical analysis as of: 2026-10-01: 17:00 CT.
US Indices Futures
- ES YSFG above F0%, MSFG/WSFG below F0%, short signals; 7906.25 resistance, 7544.75 pivot support; benchmarks remain rising longer term.
- NQ YSFG/WSFG above F0%, MSFG marginally below; pivot UTrend, all benchmarks supportive; 31150–31389.25 resistance, 28776.50 reversal pivot.
- YM YSFG/MSFG upward, WSFG below F0%; short pivots and benchmarks down; 50936 support, 52138/53328 pivot resistance, 55316 major resistance.
- EMD YSFG above F0%, MSFG neutral, WSFG below F0%; DTrend and short benchmarks down; 3601.5 support, 3685.9–3797.7 resistance.
- RTY YSFG above F0%, MSFG/WSFG below centers; DTrend and short signals; 2797.9 support, 2879.3 pivot threshold, 2931.2 resistance.
- FDAX YSFG/MSFG above F0%, WSFG corrective; DTrend with declining short benchmarks; 24978 support, 25990/26334 resistance, 26847 pivot high.
Overall State
- Short-Term: Bearish
- Intermediate-Term: Bearish
- Long-Term: Bullish
Conclusion
ES, YM, EMD, RTY, and FDAX maintain short-term DTrend or corrective structures below short benchmarks and weekly/monthly grid references. NQ remains the relative HTF leader, holding pivot UTrend and all daily benchmarks. Yearly grids and rising longer-term benchmarks retain broad upward alignment across the group, framing current weakness as retracement within wider annual structures.
Note: Intra-day counter-trend pullbacks or retracements may occur, HTF is context for informational usage and market structure. Glossary: Session Fib Grids periods of YSFG:’Yearly’, MSFG:’Monthly’, WSFG:’Weekly’
For full details visit: AlphaWebTrader Technicals
ES Daily View
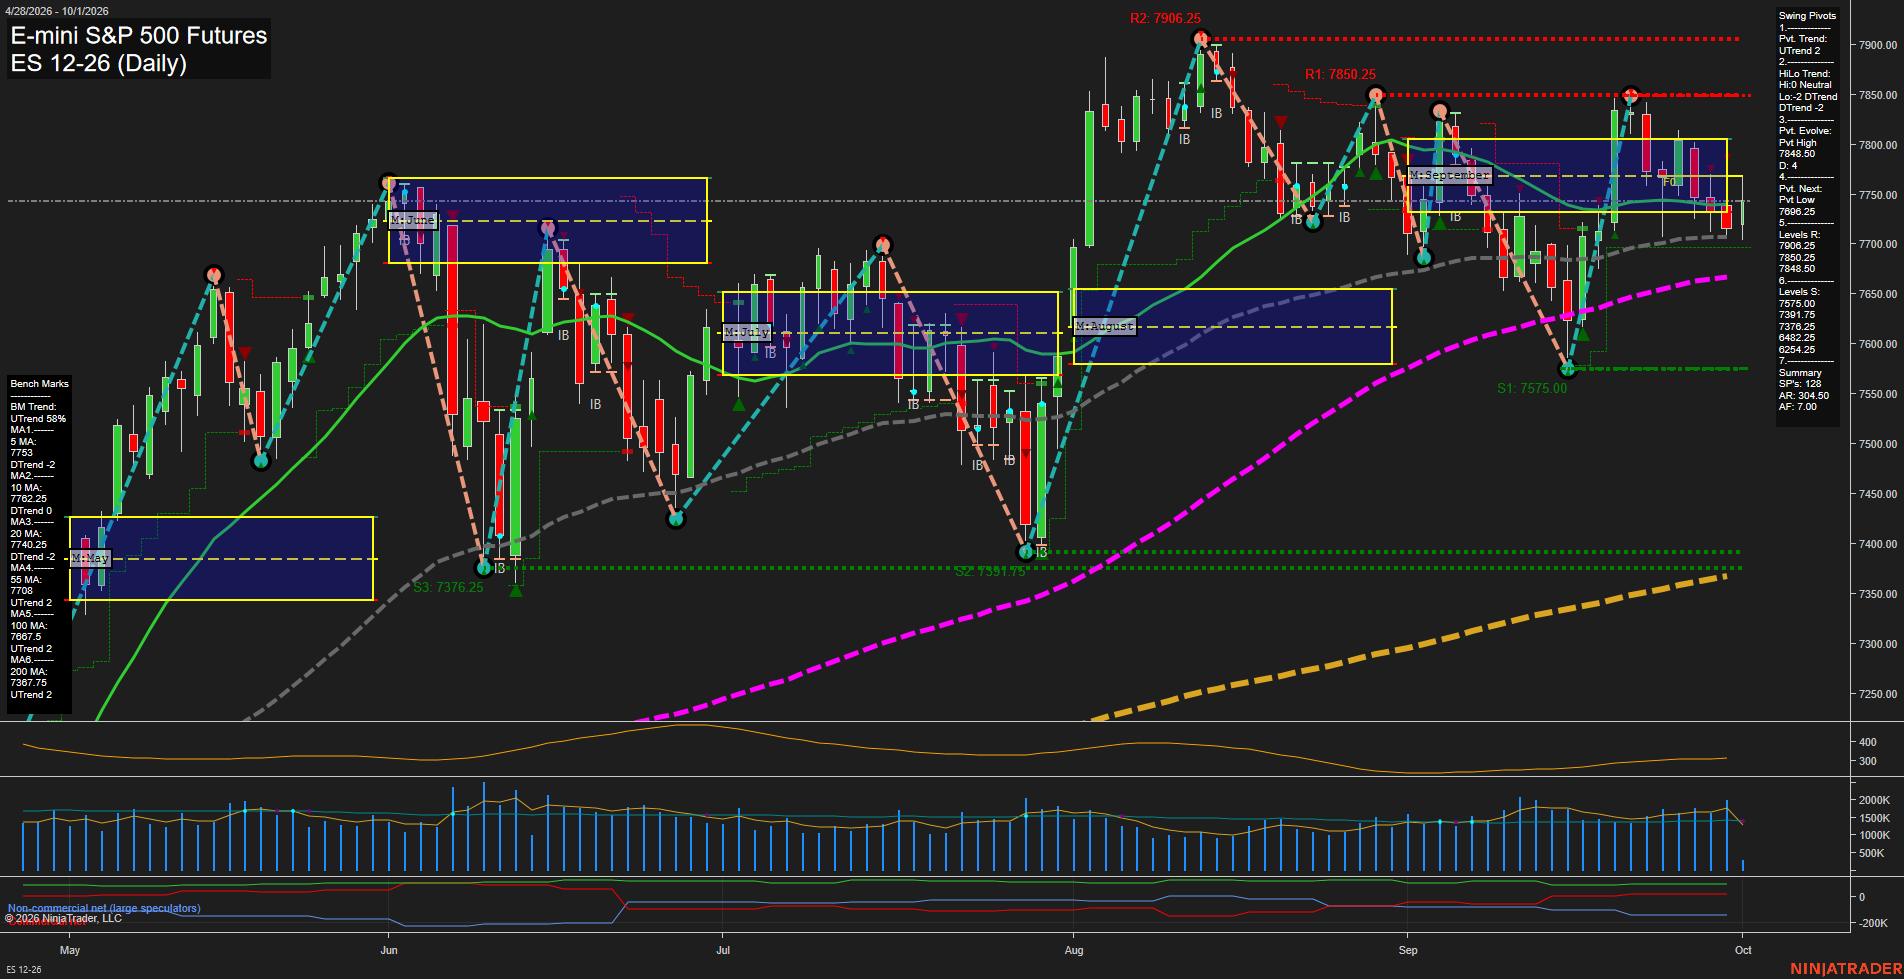
Overall Rating
- Short-Term: Bearish
- Intermediate-Term: Bearish
- Long-Term: Bullish.
Key Insights Summary
Price is below both weekly and monthly Fib-grid centers and beneath the clustered 5, 10, 20, 55, and 100-day benchmarks, reflecting a near-term corrective downswing from the 7848.50 pivot high. The 7575.00 pivot support is the immediate structural reference, while 7848.50 to 7850.25 remains the closest overhead pivot-resistance zone. Intermediate structure is lower-high/lower-low biased, although the rising 100-day and 200-day averages and positive yearly grid position preserve the broader bullish trend backdrop. ATR remains elevated, indicating a wide daily swing environment with active retracement and consolidation behavior rather than a low-volatility trend phase.
View charts on: AlphaWebTrader HTF Charts
NQ Daily View
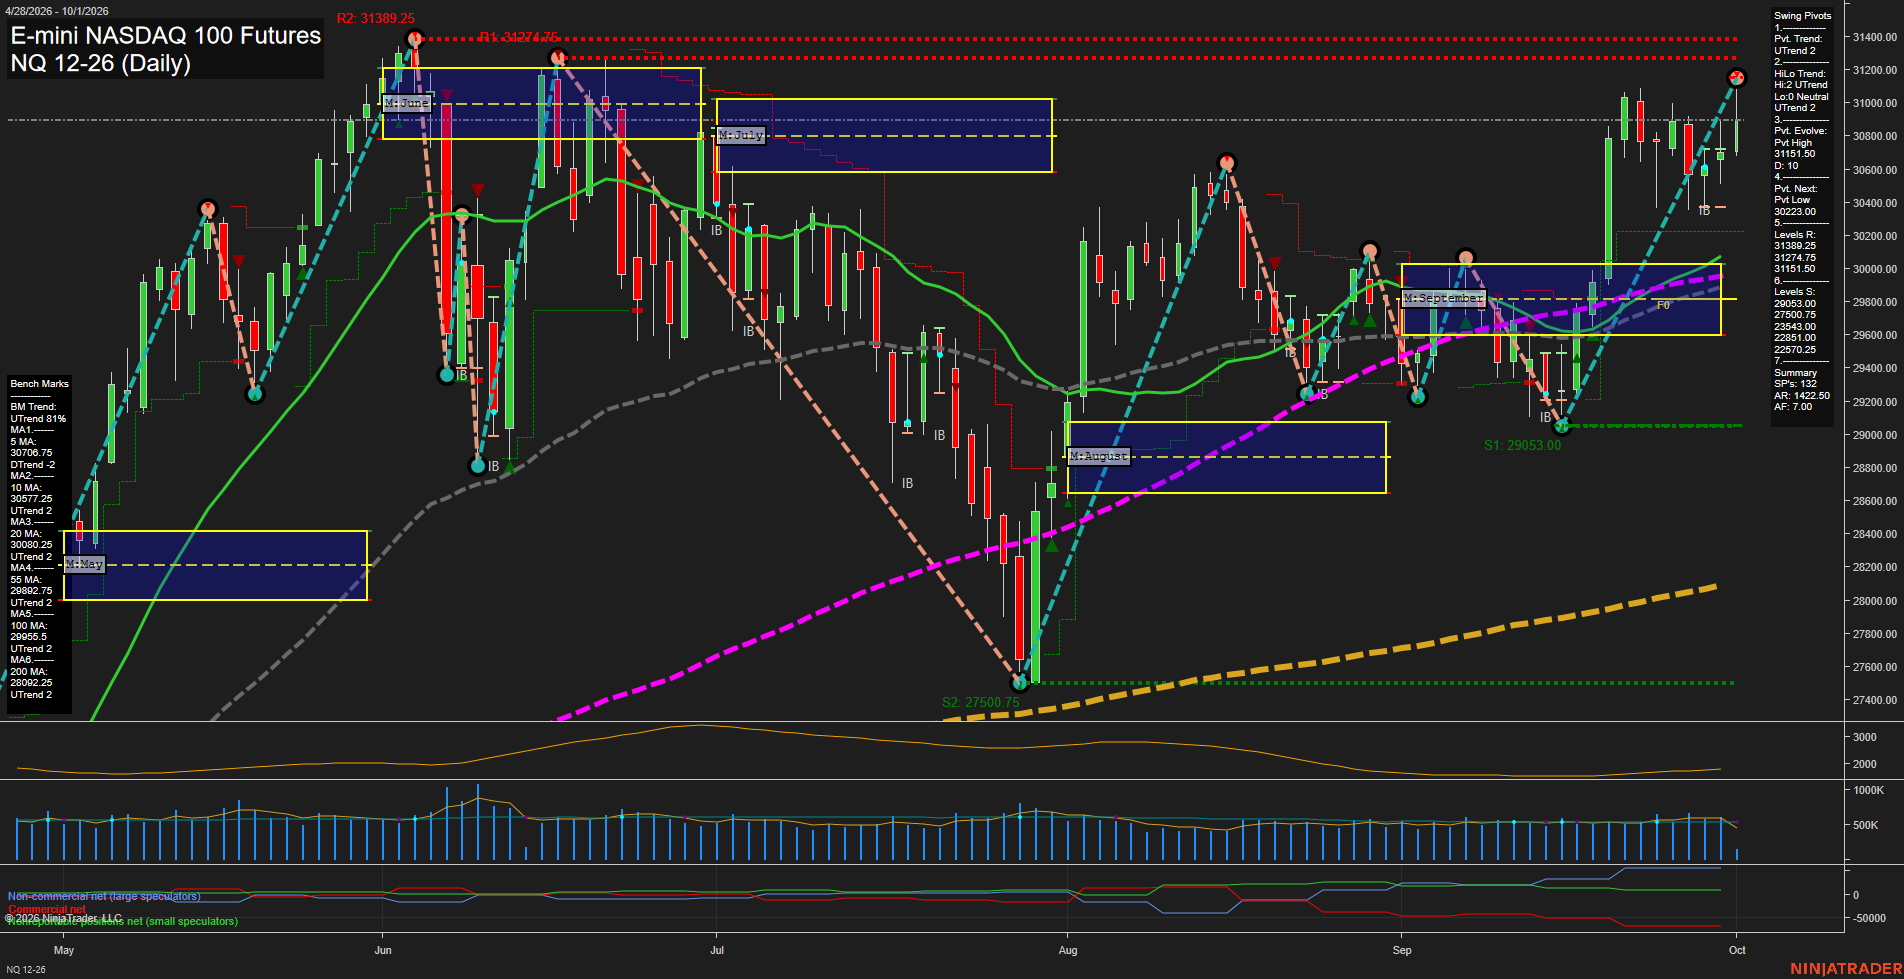
Overall Rating
- Short-Term: Bullish
- Intermediate-Term: Bullish
- Long-Term: Bullish.
Key Insights Summary
Price is advancing in a short-term pivot uptrend, supported by a sequence of higher lows from the late-September 29053 swing low and by price holding above every daily benchmark. The 31150 pivot high is the immediate overhead reference, followed by 31274.75 and 31389.25 resistance. The monthly grid remains marginally negative and below its F0/NTZ area, characterizing the current rally as a recovery within a still-developing monthly countertrend. Longer-term structure remains constructive, with the yearly grid strongly positive and the 20-, 55-, 100-, and 200-day averages all rising.
View charts on: AlphaWebTrader HTF Charts
CL Daily View
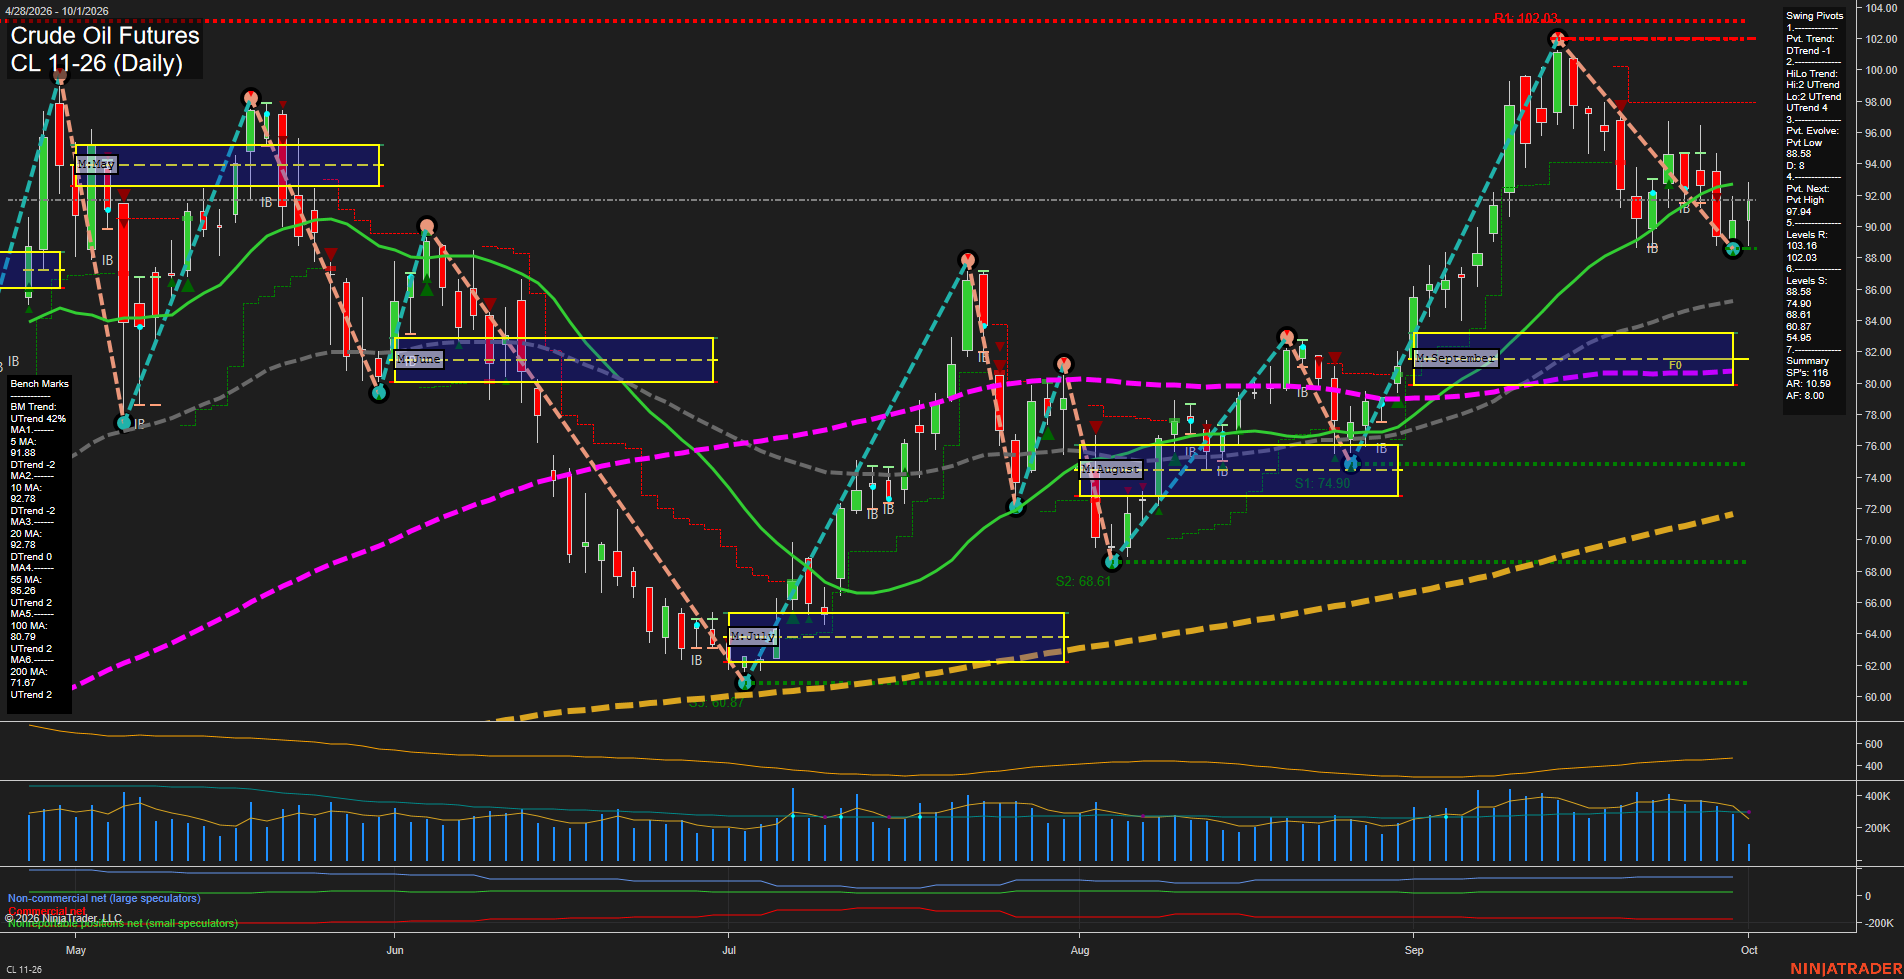
Overall Rating
- Short-Term: Bearish
- Intermediate-Term: Bullish
- Long-Term: Bullish.
Key Insights Summary
Price is in a fast short-term retracement from the 102.03 pivot high, with the current 88.58 pivot low below the 5, 10, and 20 day benchmarks. The short-term pivot sequence is down and weekly grid positioning is below F0%, while the intermediate and long-term structure remains constructive above the rising 55, 100, and 200 day benchmarks. The 88.58 pivot low is the immediate structural level, while 97.94 is the pivot reversal threshold for a renewed short-term upswing. The broader chart retains higher-low characteristics from the July and August bases despite the current sharp pullback.
View charts on: AlphaWebTrader HTF Charts
GC Daily View
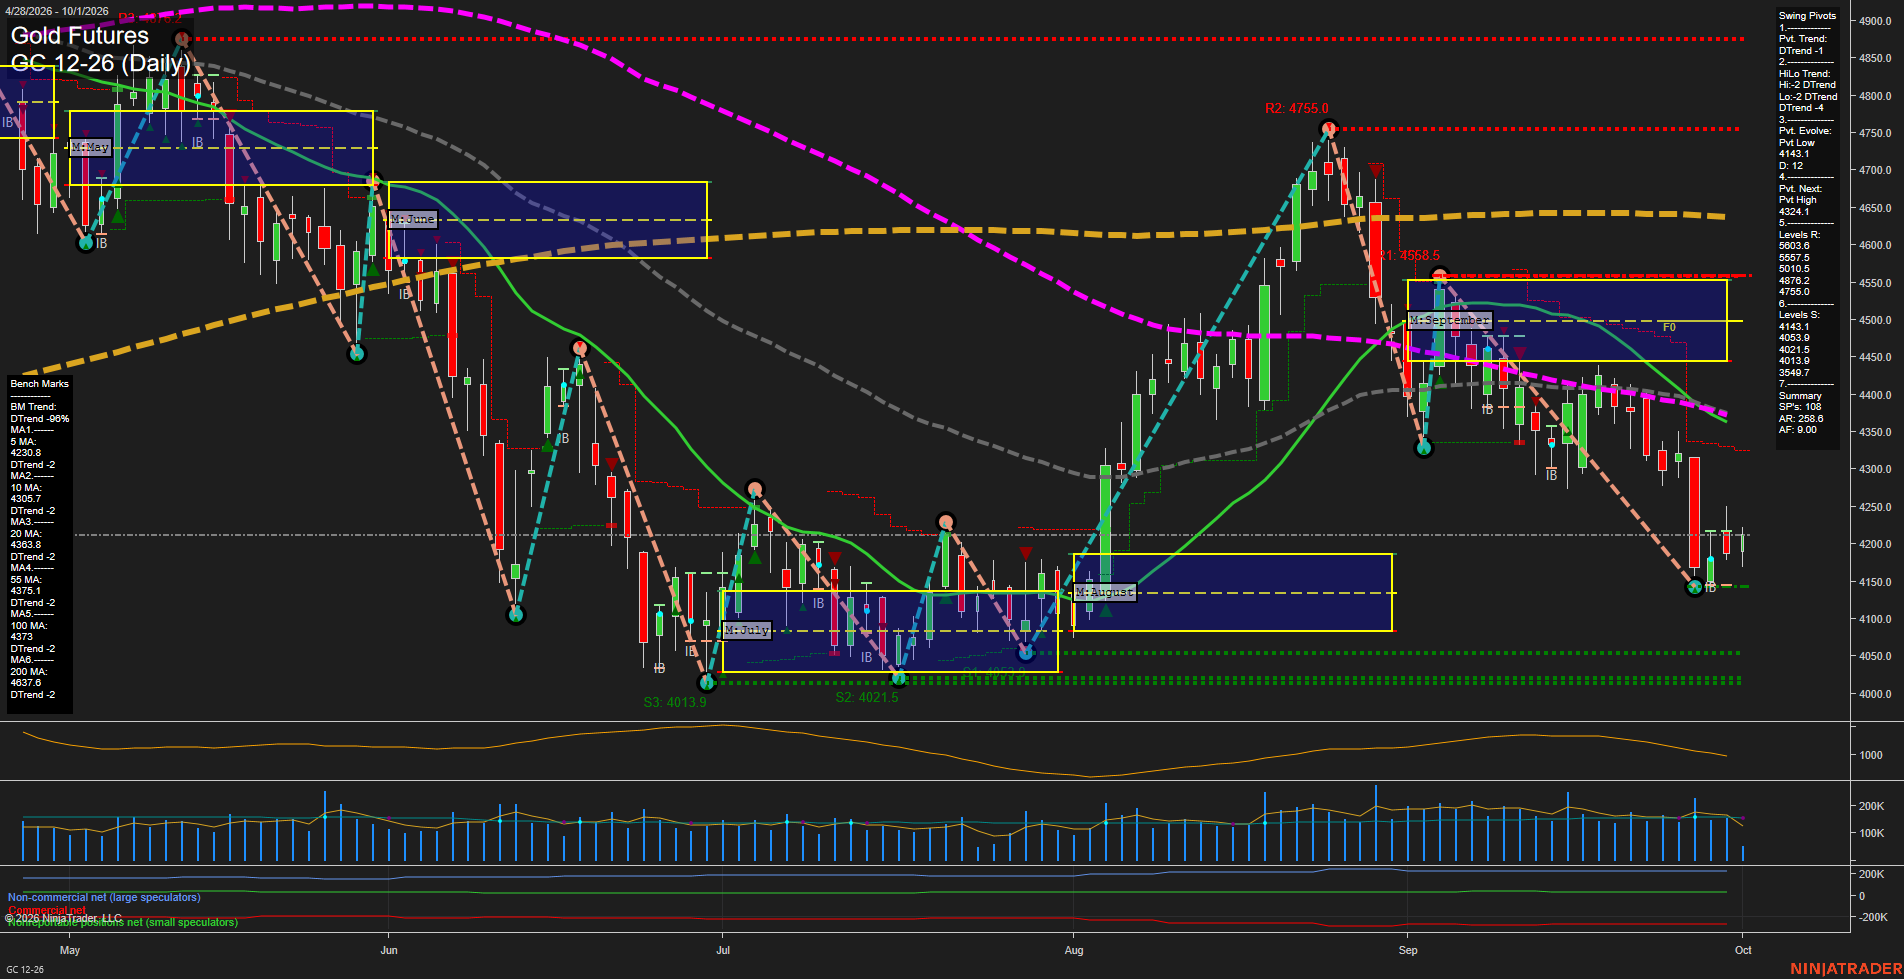
Overall Rating
- Short-Term: Bearish
- Intermediate-Term: Bearish
- Long-Term: Bearish.
Key Insights Summary
Gold remains in a broad downside swing structure, with both pivot trends in DTrend and price beneath every daily benchmark. The sharp decline from the 4755.0 pivot high has produced lower highs and lower lows, while the recent reaction from 4143.1 is a modest bounce within the prevailing decline. Price is currently compressed below the 5-day average and beneath the weekly grid, with 4321.4 the next pivot reversal level and 4143.1 the immediate structural support. Elevated ATR reflects a volatile selloff environment, although the latest small bars show short-term consolidation following the downside impulse.
View charts on: AlphaWebTrader HTF Charts
ZB Daily View
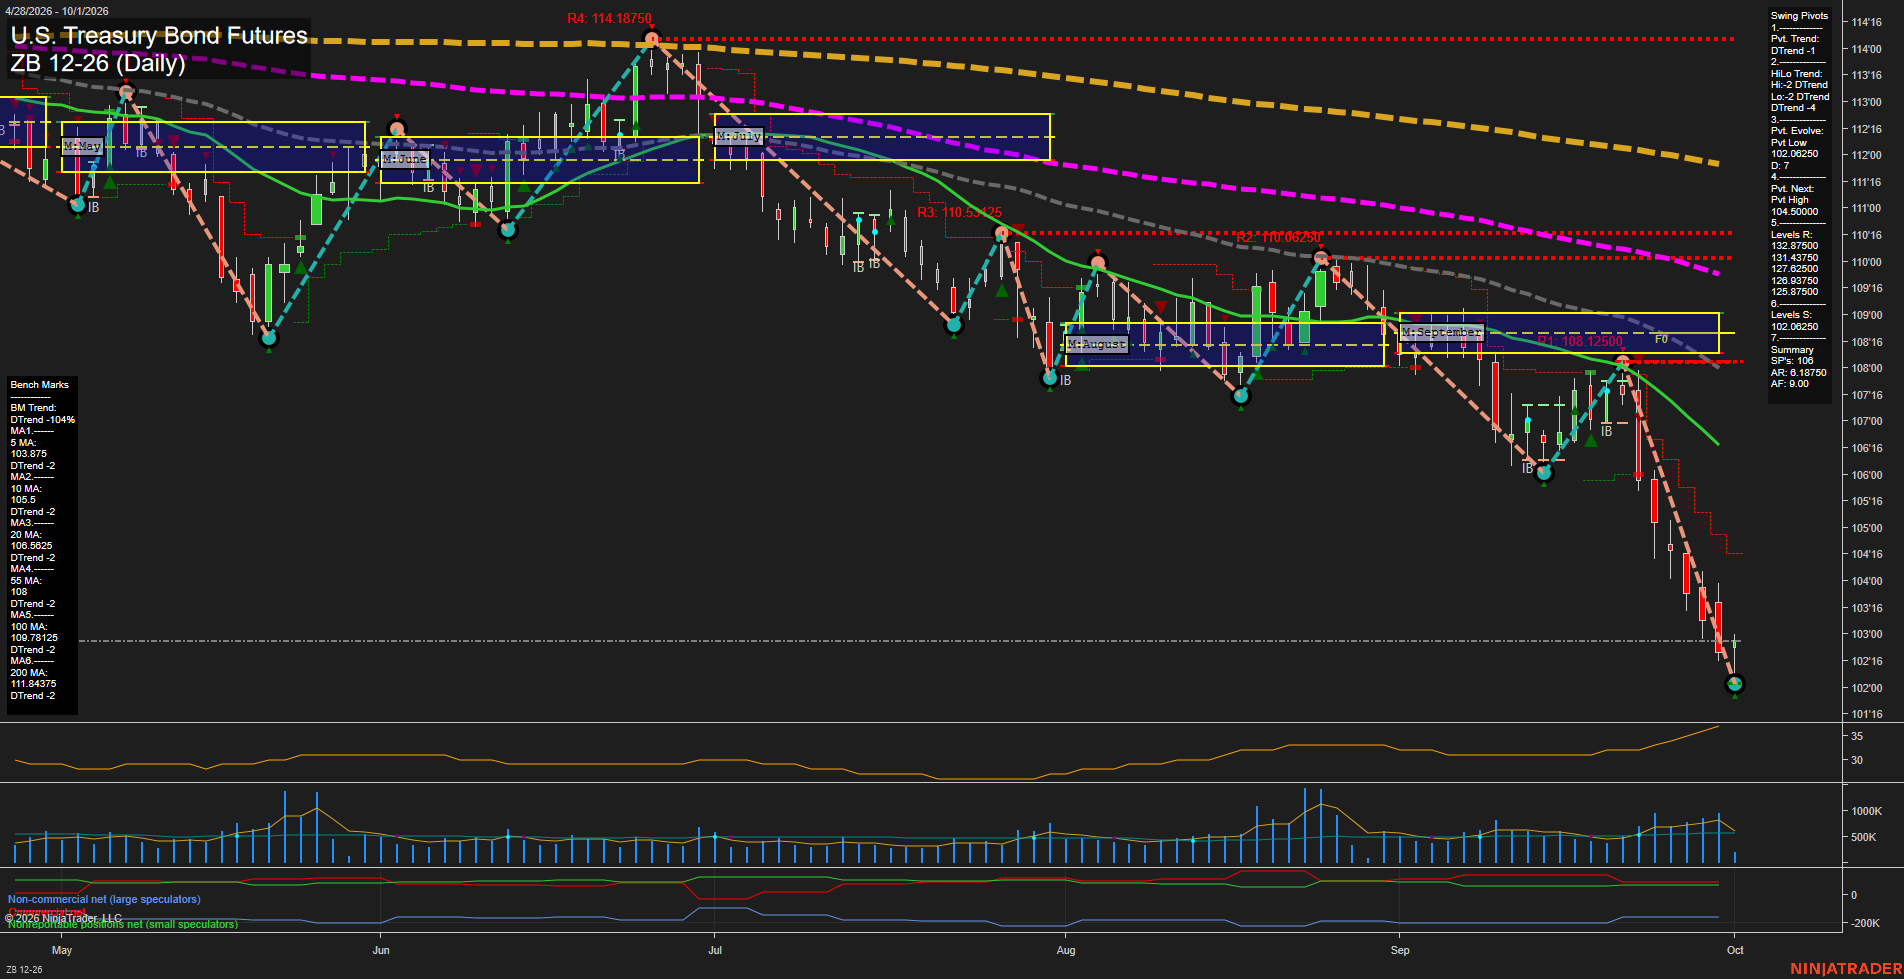
Overall Rating
- Short-Term: Bearish
- Intermediate-Term: Bearish
- Long-Term: Bearish.
Key Insights Summary
Price action reflects a fast, large-bar liquidation sequence that has extended to a fresh pivot low near 102.0625. The short-term pivot trend and intermediate HiLo structure remain in DTrend, with lower highs and lower lows intact. Price is below the weekly, monthly, and yearly fib-grid reference zones and below every daily benchmark, while all moving averages slope downward. The market is materially extended beneath the 5-day average, but the current structure remains a downside continuation pattern unless price develops a recovery through the 104.5000 next-pivot reference.
View charts on: AlphaWebTrader HTF Charts