NYSE pre-market review covers ETF leaders and laggards, index futures trends, semiconductor strength, Treasury yields and Strait of Hormuz risks.
Fundamentals: U.S. index futures were mixed-to-firm before the NYSE open, with Nasdaq 100 futures supported by Micron-led semiconductor strength while higher Treasury yields restrained broader equity gains. Investors monitored weekly jobless claims, ISM manufacturing data and Fed remarks, alongside oil-shipping security risks in the Strait of Hormuz and stalled U.S.-Iran talks.
Technicals: The pre-market review tracks prior-session moves in USO, AAPL, GOOG, IJH, DIA and META, while assessing major index futures across multiple time frames. ES, YM, EMD, RTY and FDAX show short-term bearish or corrective structures, whereas NQ retains bullish daily momentum. Longer-term trend conditions generally remain constructive despite elevated volatility and nearby pivot levels.
Pre-Market Trading 360° view Market Radar of: holidays, earnings, eco-news, market-news summary, news sentiment, prior session major ETFs, MAG7, Higher Time Frame Analysis Indices Futures Summary, and E-mini S&P500, Nasdaq 100, NYMEX Crude, Gold Futures Daily Chart analysis.
As of: October 1, 2026 07:16 CT
EcoNews Radar U.S. Events
| Day | Time | Impact | Event |
|---|---|---|---|
| Thu | 08:30 | Medium | Unemployment Claims |
| Thu | 10:00 | Medium | FOMC Member Waller Speaks |
| Thu | 10:00 | Medium | ISM Manufacturing PMI |
| Fri | 08:30 | High | Average Hourly Earnings m/m |
| Fri | 08:30 | High | Non-Farm Employment Change |
| Fri | 08:30 | High | Unemployment Rate |
EcoNews Summary
Friday’s 08:30 USD employment release cluster is the week’s only listed high-impact market focus. The data provide a broad view of labor-market conditions, wage growth, and unemployment, key inputs for index-futures volatility and interest-rate expectations.
Event Notes:
- Friday 08:30 — Average Hourly Earnings m/m: Measures the monthly change in average employee pay. Traders monitor wage growth as an inflation-related labor-market indicator.
- Friday 08:30 — Non-Farm Employment Change: Measures the monthly change in employed workers outside the farm sector. It is a primary gauge of labor-market strength.
- Friday 08:30 — Unemployment Rate: Measures the percentage of the labor force without work and actively seeking employment. It provides context on labor-market slack and household conditions.
Conclusion:
The single most important event is Friday at 08:30, led by the Non-Farm Employment Change release alongside wage and unemployment data. Market momentum and volume often slow ahead of this major employment release, with increased volatility at release time.
For full details visit: Forex Factory EcoNews
Market News Summary:
Index futures were mixed-to-firm as AI-linked technology strength offset pressure from rising Treasury yields, hawkish Fed concerns, and Middle East risks.
Primary Drivers & Risks:
- Primary Driver: AI and semiconductor strength
- Primary Risk: Rising yields and inflation concerns
Tone:
Cautiously mixed, with technology leadership countering rate and geopolitical pressure.
Stock Market / ETFs / Indices:
Nasdaq 100 futures gained about 0.6%, supported by strong Micron earnings, while S&P 500 futures hovered near flat and Dow futures remained restrained by higher yields. The S&P 500 closed 0.25% lower after failing to hold an earlier gain following softer PCE data. The index remains near a record high, while its forward valuation has fallen to a one-year low amid investor skepticism.
Geopolitical:
Markets monitored U.S.-Iran diplomatic contacts and delayed prospects for a durable resolution to the Iran conflict. Three oil tankers were reported struck by projectiles in the Strait of Hormuz, sustaining shipping-security concerns despite recovering regional crude flows.
Oil / Energy:
Oil prices consolidated as Saudi Arabia resumed tanker loadings from Yanbu and Gulf exports recovered toward prewar levels, easing immediate supply-disruption concerns. Stalled U.S.-Iran talks, Hormuz shipping risks, fuel shortages, and discussion of possible European diesel-stock releases remained energy-market cross-currents. Norway stated that its gas transport system is prepared for high winter deliveries to Europe.
Gold / Metals:
Gold and silver advanced after softer PCE data reduced Fed-hike expectations, though near-term gold sentiment remained sluggish and price gains struggled to hold. Gold’s elevated price level was also cited as limiting room for error.
Fed / Financials:
Treasury yields continued rising even after core PCE slowed to 3.0%, as much of the decline was attributed to methodology changes and August data excluded September diesel-price effects. Recent Fed hawkishness and commentary pointing to higher inflation remained central to rate-sensitive trading.
Macro / Other:
South Korean September exports surged 83.5% year over year to $120.94 billion, led by memory-chip producers. Asian factory gauges continued to indicate expansion as AI demand offset cost pressures and supply disruptions. Huawei introduced phones using homegrown operating-system and chip designs amid U.S. semiconductor restrictions.
Conclusion:
AI demand and semiconductor strength supported Nasdaq futures and Asian manufacturing indicators. Higher Treasury yields limited broader U.S. equity-index participation.
Oil supply fears eased as Gulf exports recovered, but Strait of Hormuz security incidents and stalled U.S.-Iran talks remained active risks. Inflation concerns, hawkish Fed positioning, and elevated gold pricing added cross-currents.
Market News Sentiment
Market News Articles: 43
- Neutral: 60.47%
- Positive: 23.26%
- Negative: 16.28%
Sentiment Summary: Market news sentiment is predominantly neutral at 60%, with 23% positive and 16% negative coverage across 43 articles.
Conclusion: The news flow presents a broadly balanced tone, with positive coverage exceeding negative coverage.
GLD,Gold Articles: 14
- Positive: 42.86%
- Negative: 35.71%
- Neutral: 21.43%
Sentiment Summary: GLD/Gold coverage is mixed, with 43% positive, 36% negative, and 21% neutral sentiment across 14 articles.
Conclusion: Gold-related news sentiment is slightly positive overall, with a meaningful share of negative coverage.
USO,Oil Articles: 15
- Negative: 40.00%
- Positive: 33.33%
- Neutral: 26.67%
Sentiment Summary: USO and oil coverage is mixed with a negative tilt: 40% negative, 33% positive, and 27% neutral across 15 articles.
Conclusion: Oil-related news tone is modestly negative, which may be relevant to energy-sensitive index futures sentiment.
Market Data Snapshot
ETF Snapshot of major stock market ETFs, Mag7, and others as of: October 1, 2026 07:16
Top Movers & Losers
- USO 145.66 Bullish 1.61% ▲
- AAPL 333.02 Bullish 1.10% ▲
- GOOG 340.74 Bullish 1.01% ▲
- IJH 71.95 Bearish -0.58% ▼
- DIA 508.55 Bearish -0.84% ▼
- META 725.18 Bearish -1.84% ▼
Major Index ETFs: SPY, QQQ, DIA, IWM, IJH
- QQQ 739.77 Bullish 0.25% ▲
- SPY 762.63 Bearish -0.21% ▼
- IWM 277.89 Bearish -0.40% ▼
- IJH 71.95 Bearish -0.58% ▼
- DIA 508.55 Bearish -0.84% ▼
Mixed index ETF context: QQQ is the most bullish mover at +0.25%, while DIA is the most bearish mover at -0.84%. SPY is Bearish at -0.21%, IWM is Bearish at -0.40%, and IJH is Bearish at -0.58%, reflecting broader downside pressure outside QQQ.
Mag 7 Stocks: AAPL, MSFT, GOOG, AMZN, META, NVDA, TSLA
- AAPL 333.02 Bullish 1.10% ▲
- GOOG 340.74 Bullish 1.01% ▲
- AMZN 249.15 Bullish 1.01% ▲
- MSFT 512.90 Bullish 0.77% ▲
- TSLA 354.81 Bullish 0.56% ▲
- NVDA 228.38 Bullish 0.51% ▲
- META 725.18 Bearish -1.84% ▼
Mixed Mag7 snapshot: AAPL is the most bullish mover at +1.10%, followed by GOOG and AMZN at +1.01% each. MSFT gains +0.77%, TSLA +0.56%, and NVDA +0.51%. META is the most bearish mover at -1.84%, creating clear divergence within the group.
Cross-Market ETFs: TLT, GLD, USO, IBIT
- USO 145.66 Bullish 1.61% ▲
- IBIT 47.34 Bullish 0.02% ▲
- GLD 380.84 Bearish -0.54% ▼
- TLT 77.78 Bearish -0.58% ▼
Mixed cross-market snapshot: USO is the most bullish mover at +1.61%, while IBIT is marginally Bullish at +0.02%. TLT is the most bearish mover at -0.58%, followed by GLD at -0.54%.
ETF, Mag7, and Cross-Market ETF Insights
Overall Tone
Mixed: Mag7 leadership and USO strength contrast with Bearish broad-market ETFs, bonds, and gold.
Equity ETFs and Mag7:
Major Index ETFs are Mixed, with QQQ at +0.25% while SPY fell -0.21%, IWM -0.40%, IJH -0.58%, and DIA -0.84%; DIA is the most bearish index ETF mover. Mag7 participation is selective but mostly Bullish: AAPL leads at +1.10%, followed by GOOG and AMZN at +1.01%, while META is the most bearish equity mover at -1.84%. QQQ’s modest gain alongside broad ETF weakness indicates concentrated leadership rather than broad alignment.
Cross-Market ETFs:
Cross-market ETFs are Mixed, led by USO as the most bullish mover at +1.61%, while IBIT is near-flat at +0.02%. GLD declined -0.54% and TLT declined -0.58%, making TLT the most bearish cross-market mover. Oil strength diverges from weakness in bonds and gold alongside Mixed equity conditions.
Futures Indices – Higher Time Frame Analysis
Summary of the current state of US Indices Futures based on higher time-frame (HTF) technical analysis as of: 2026-10-01: 07:16 CT.
US Indices Futures
- ES: YSFG above F0%, MSFG/WSFG below F0%, benchmarks mixed-to-down short-term, pivots 7575 support and 7848.50-7850.25 resistance; daily DTrend.
- NQ: YSFG/WSFG above F0%, MSFG marginally below F0%, all daily benchmarks rising, UTrend pivots; 31150-31389.25 resistance, 28776.50 reversal reference.
- YM: YSFG/MSFG upward, WSFG below F0%, short benchmarks down; 50936-50938 support, 52138/53328 resistance; daily and weekly short-term DTrend.
- EMD: YSFG above F0%, MSFG neutral, WSFG below F0%; short benchmarks down, 3601.5 support, 3685.9-3797.7 resistance; daily DTrend.
- RTY: YSFG above F0%, MSFG/WSFG below centers, short benchmarks declining; 2797.9 support, 2879.3-2931.2 resistance; pivot DTrend across daily and weekly.
- FDAX: YSFG/MSFG above F0%, short-term WSFG weakness, short benchmarks down; 24978 support, 25990/26334/26847 resistance; daily and weekly DTrend.
Overall State
- Short-Term: Bearish
- Intermediate-Term: Bearish
- Long-Term: Bullish
Conclusion
ES, YM, EMD, RTY, and FDAX retain synchronized short-term DTrend conditions below short benchmarks and Fib-grid centers. NQ remains the relative strength instrument, holding above daily benchmarks in UTrend beneath resistance. Yearly Fib-grid positioning and longer benchmarks remain upward across the complex, framing broad short-term weakness within predominantly bullish long-term structure. Key support references are ES 7575, YM 50936, EMD 3601.5, RTY 2797.9, and FDAX 24978.
Note: Intra-day counter-trend pullbacks or retracements may occur, HTF is context for informational usage and market structure. Glossary: Session Fib Grids periods of YSFG:’Yearly’, MSFG:’Monthly’, WSFG:’Weekly’
For full details visit: AlphaWebTrader Technicals
ES Daily View
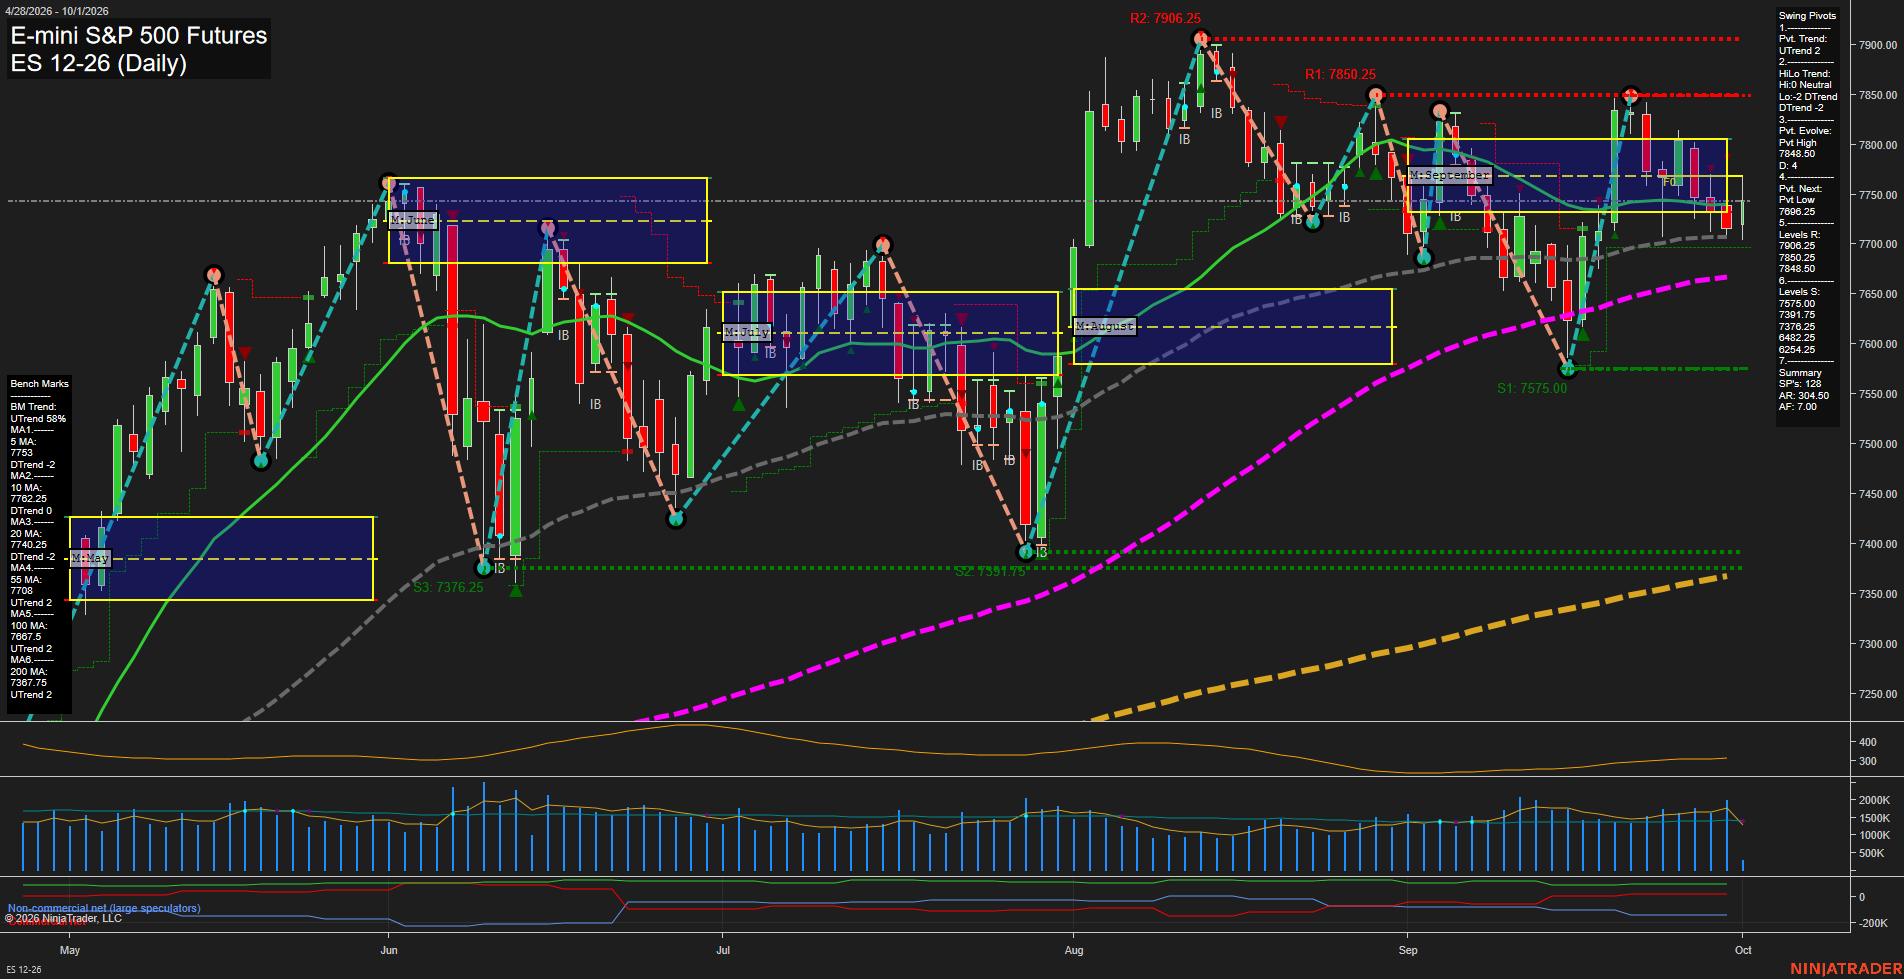
Overall Rating
- Short-Term: Bearish
- Intermediate-Term: Bearish
- Long-Term: Bullish.
Key Insights Summary
Price is below both weekly and monthly Fib-grid centers and beneath the clustered 5, 10, 20, 55, and 100-day benchmarks, reflecting a near-term corrective downswing from the 7848.50 pivot high. The 7575.00 pivot support is the immediate structural reference, while 7848.50 to 7850.25 remains the closest overhead pivot-resistance zone. Intermediate structure is lower-high/lower-low biased, although the rising 100-day and 200-day averages and positive yearly grid position preserve the broader bullish trend backdrop. ATR remains elevated, indicating a wide daily swing environment with active retracement and consolidation behavior rather than a low-volatility trend phase.
View charts on: AlphaWebTrader HTF Charts
NQ Daily View
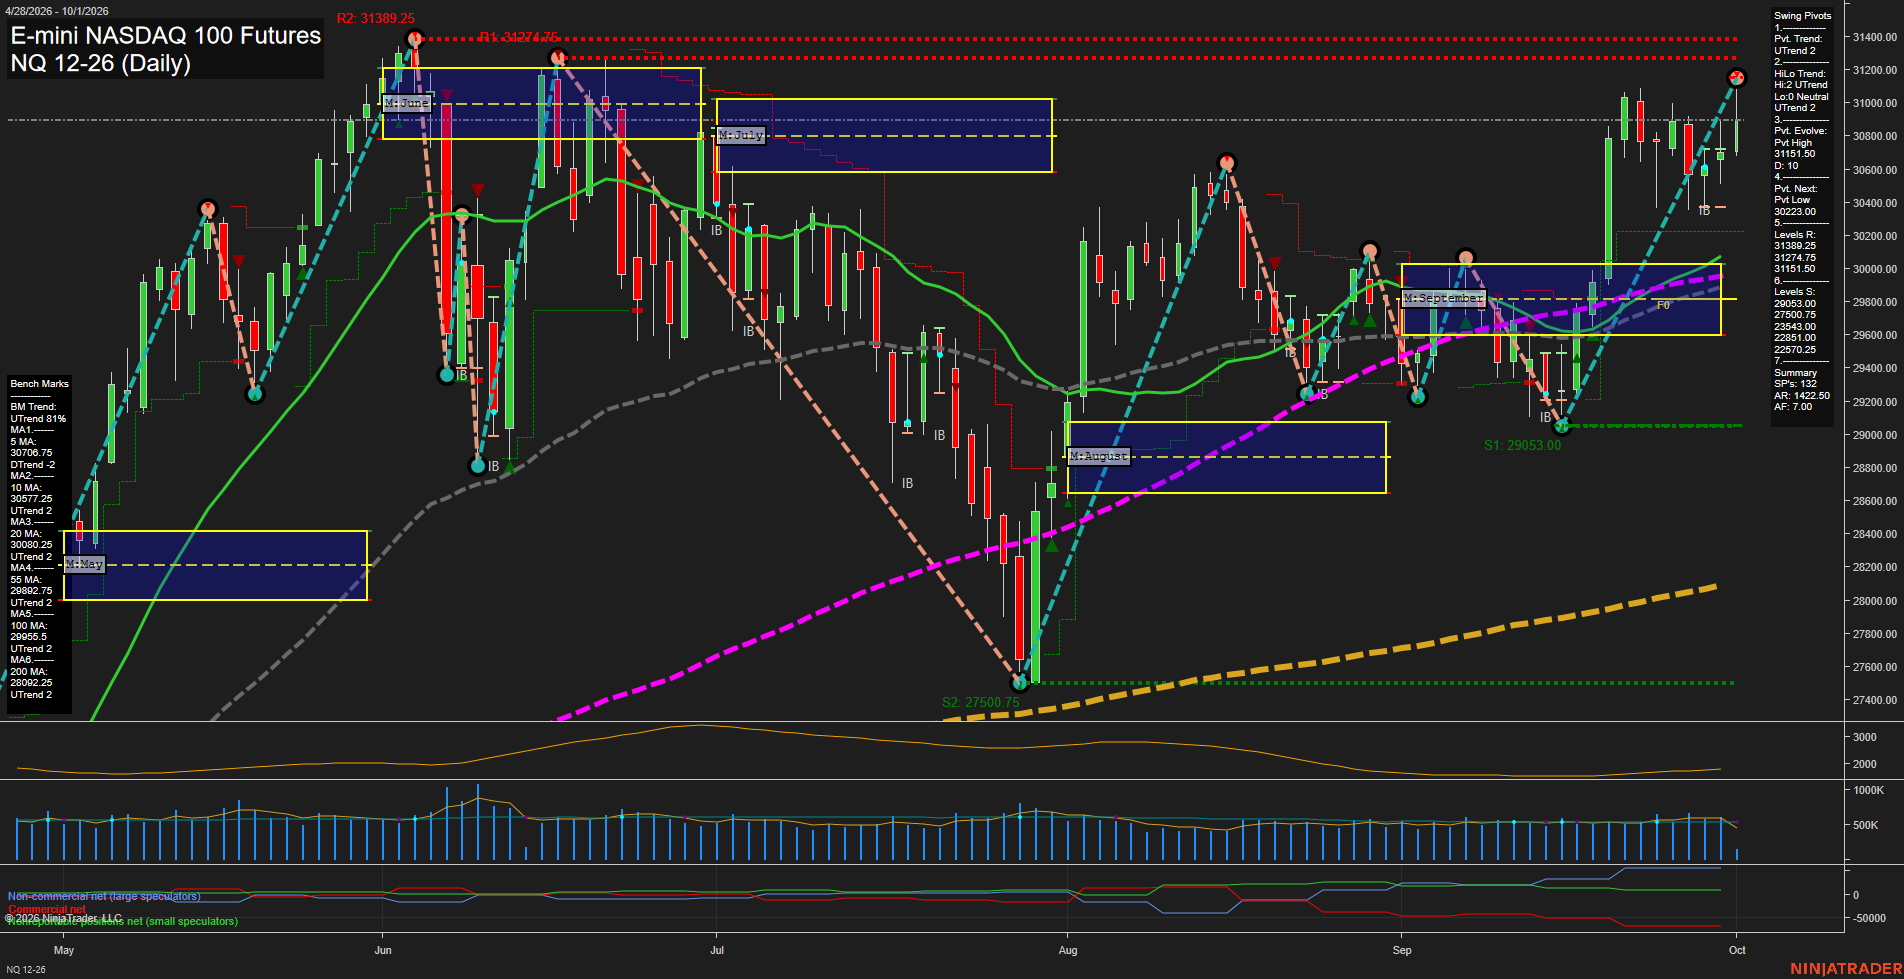
Overall Rating
- Short-Term: Bullish
- Intermediate-Term: Bullish
- Long-Term: Bullish.
Key Insights Summary
Price is advancing in a short-term pivot uptrend, supported by a sequence of higher lows from the late-September 29053 swing low and by price holding above every daily benchmark. The 31150 pivot high is the immediate overhead reference, followed by 31274.75 and 31389.25 resistance. The monthly grid remains marginally negative and below its F0/NTZ area, characterizing the current rally as a recovery within a still-developing monthly countertrend. Longer-term structure remains constructive, with the yearly grid strongly positive and the 20-, 55-, 100-, and 200-day averages all rising.
View charts on: AlphaWebTrader HTF Charts
CL Daily View
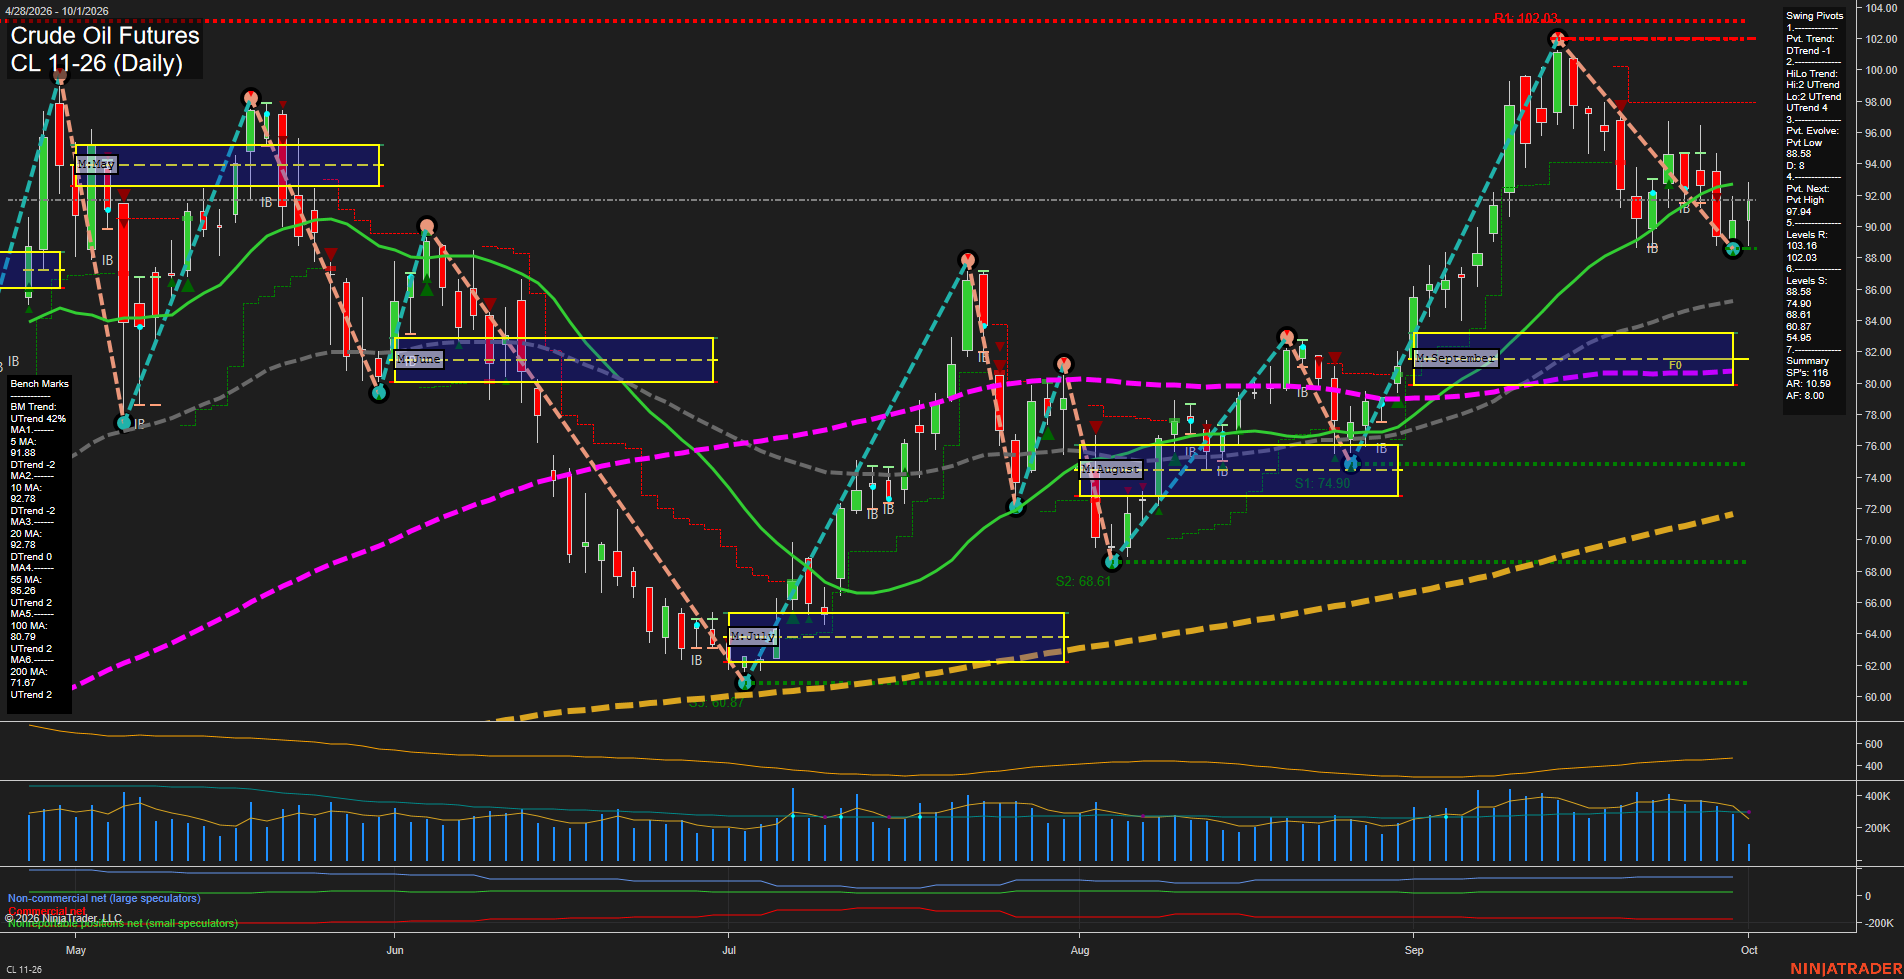
Overall Rating
- Short-Term: Bearish
- Intermediate-Term: Bullish
- Long-Term: Bullish.
Key Insights Summary
Price is in a fast short-term retracement from the 102.03 pivot high, with the current 88.58 pivot low below the 5, 10, and 20 day benchmarks. The short-term pivot sequence is down and weekly grid positioning is below F0%, while the intermediate and long-term structure remains constructive above the rising 55, 100, and 200 day benchmarks. The 88.58 pivot low is the immediate structural level, while 97.94 is the pivot reversal threshold for a renewed short-term upswing. The broader chart retains higher-low characteristics from the July and August bases despite the current sharp pullback.
View charts on: AlphaWebTrader HTF Charts
GC Daily View
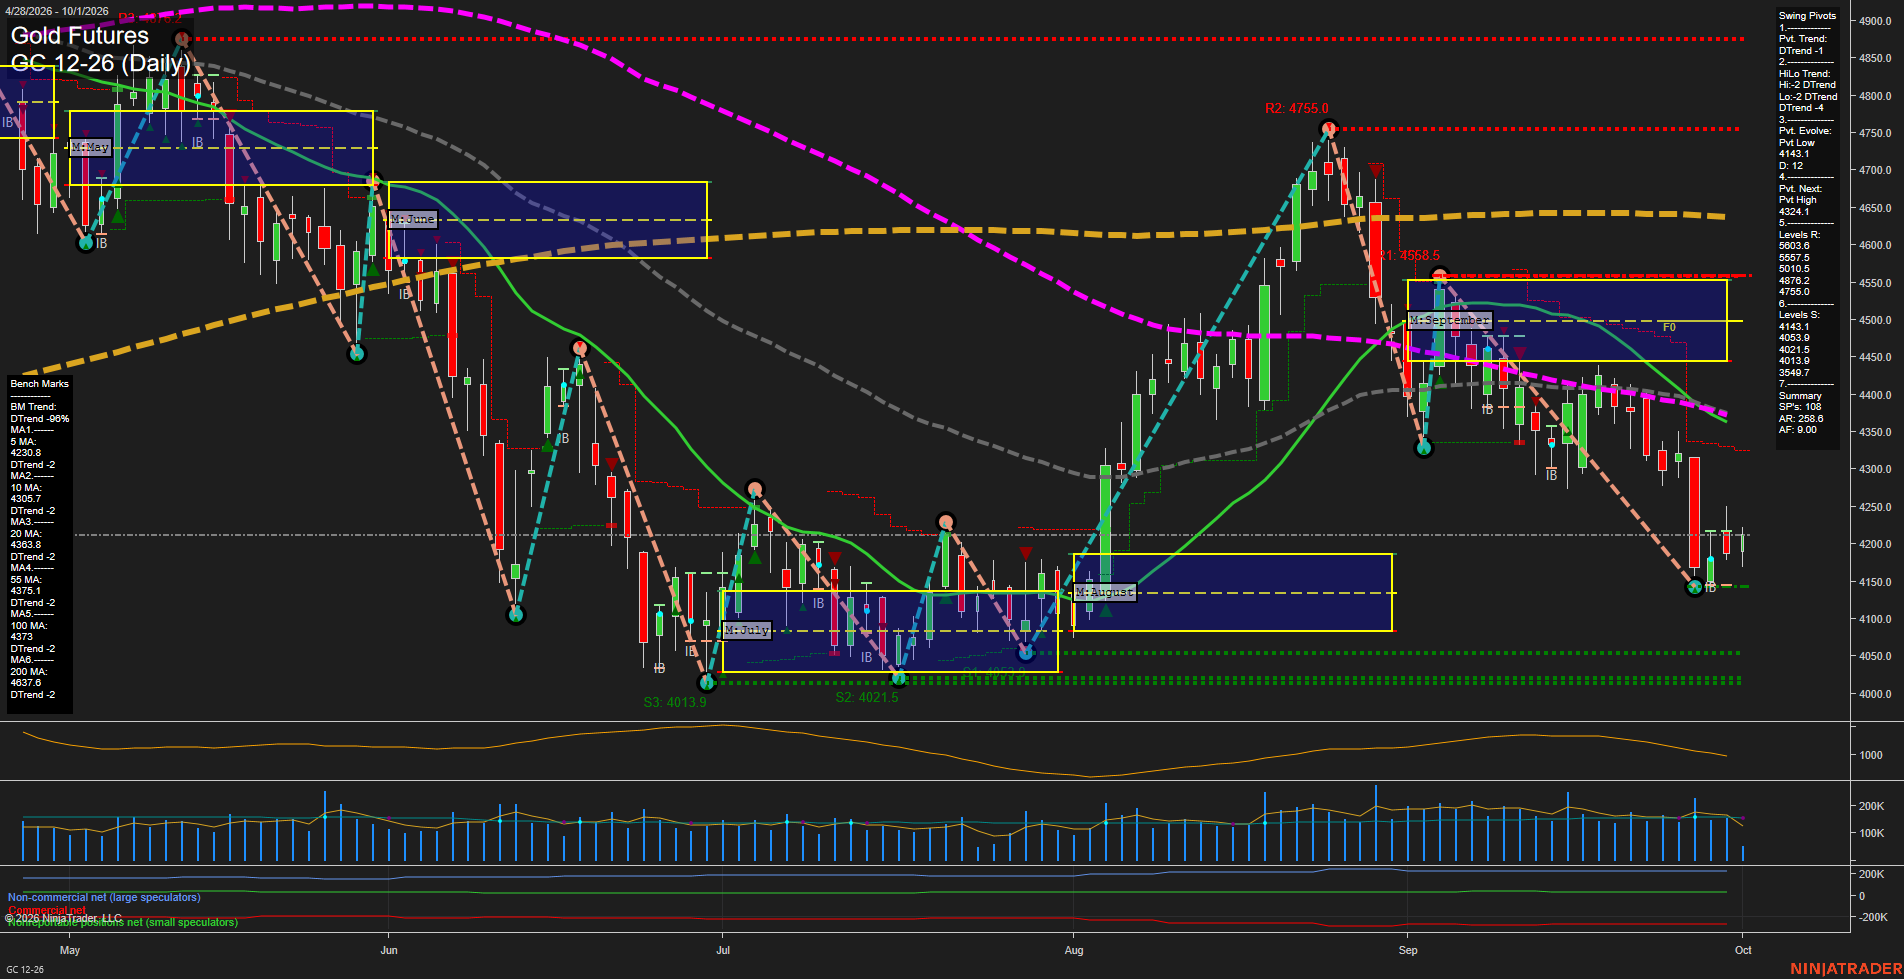
Overall Rating
- Short-Term: Bearish
- Intermediate-Term: Bearish
- Long-Term: Bearish.
Key Insights Summary
Gold remains in a broad downside swing structure, with both pivot trends in DTrend and price beneath every daily benchmark. The sharp decline from the 4755.0 pivot high has produced lower highs and lower lows, while the recent reaction from 4143.1 is a modest bounce within the prevailing decline. Price is currently compressed below the 5-day average and beneath the weekly grid, with 4321.4 the next pivot reversal level and 4143.1 the immediate structural support. Elevated ATR reflects a volatile selloff environment, although the latest small bars show short-term consolidation following the downside impulse.
View charts on: AlphaWebTrader HTF Charts
ZB Daily View
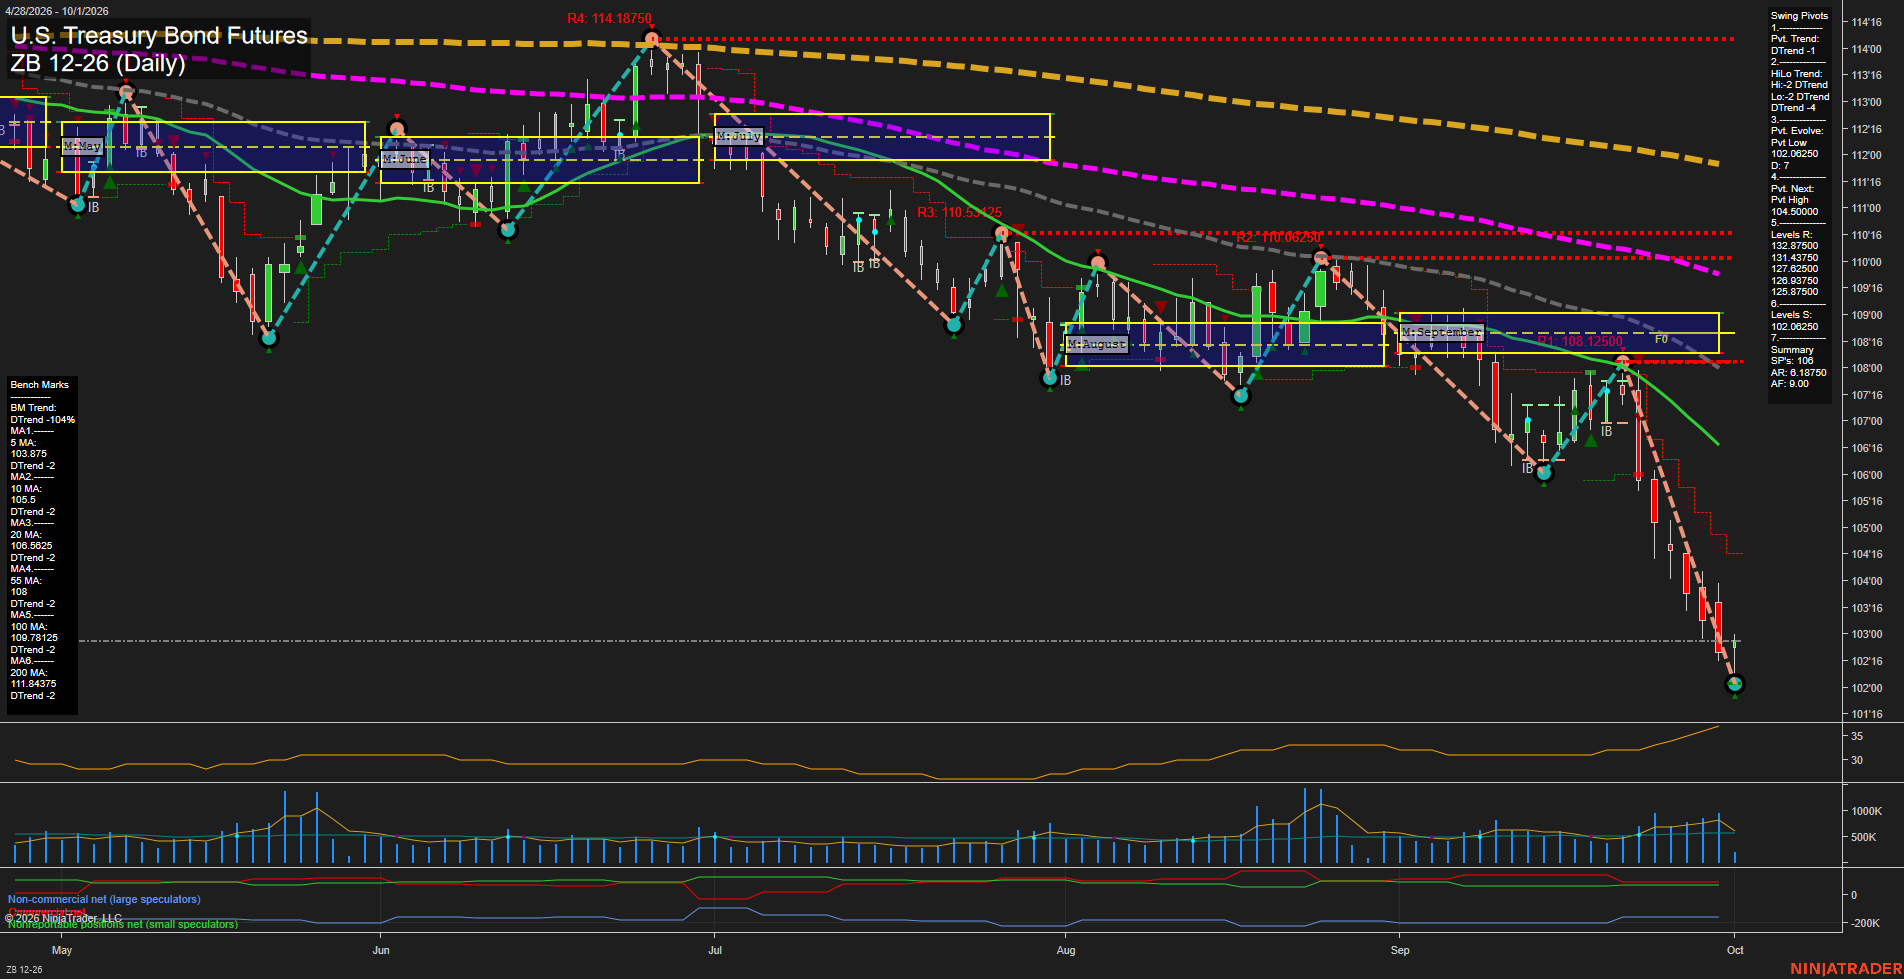
Overall Rating
- Short-Term: Bearish
- Intermediate-Term: Bearish
- Long-Term: Bearish.
Key Insights Summary
Price action reflects a fast, large-bar liquidation sequence that has extended to a fresh pivot low near 102.0625. The short-term pivot trend and intermediate HiLo structure remain in DTrend, with lower highs and lower lows intact. Price is below the weekly, monthly, and yearly fib-grid reference zones and below every daily benchmark, while all moving averages slope downward. The market is materially extended beneath the 5-day average, but the current structure remains a downside continuation pattern unless price develops a recovery through the 104.5000 next-pivot reference.
View charts on: AlphaWebTrader HTF Charts