U.S. stocks closed lower as 24-year highs in long-term Treasury yields, inflation concerns and weaker consumer data pressured sentiment at close.
Fundamentals: U.S. equities ended modestly lower, with the Dow off 136 points as long-term Treasury yields climbed to a 24-year high. Persistent inflation concerns, weaker consumer confidence and softer labor signals weighed on risk appetite, while bond volatility rose despite a subdued VIX. Gold and silver rebounded, WTI eased, and energy policy remained in focus amid geopolitical conflict.
Technicals: ETF leadership was mixed at the close, with META, GLD and IBIT higher while TSLA, AAPL and USO declined. Futures technical readings show the S&P 500 and Nasdaq retaining bullish intermediate- and long-term structures despite consolidation, while the Dow, small caps, E-mini S&P MidCap and DAX face varying short-term pressure. Key pivot and moving-average levels frame the current pullbacks.
After Market Close daily snapshot: market news summary and sentiment, major ETFs, Magnificent 7 analysis, Indices Futures Higher Time Frame Analysis, and E-mini S&P500, Nasdaq 100, NYMEX Crude, Gold Futures Daily Chart analysis.
As of: September 29, 2026 05:00 CT
Market News Summary:
Rising long-term Treasury yields, persistent inflation concerns, and weaker consumer data pressured risk sentiment as stocks closed modestly lower.
Primary Drivers & Risks:
- Primary Driver: Surging long-term Treasury yields
- Primary Risk: Energy conflict and inflation pressures
Tone:
Cautious, with bond-market stress outweighing calm equity volatility measures.
Stock Market / ETFs / Indices:
U.S. equities ended lower, with the Dow down 136 points as Treasury yields reached multiyear highs. The S&P 500 remained within 2% of its record close, though market breadth showed many individual stocks in bear-market conditions. AI-related concerns centered on Oracle, OpenAI, and CoreWeave, while housing shares faced pressure from higher rates.
Geopolitical:
The widening war involving Iran and Russia’s war in Ukraine remained central to fuel-price concerns. Belgium signed a $1.04 billion contract for Kongsberg air-defense systems, underscoring elevated European defense spending.
Oil / Energy:
The U.S. offered to loan 40 million barrels from the Strategic Petroleum Reserve to address elevated fuel prices, while the White House urged the EU to draw down diesel inventories. WTI crude moved lower, with bearish technical commentary focused on nearby support levels.
Gold / Metals:
Gold and silver rebounded after softer labor and consumer-confidence data reduced October rate-hike pricing. Gold remained under pressure from high Treasury yields, a stronger dollar, persistent inflation, and technical support breaks; outlook commentary highlighted the Strait of Hormuz conflict as a key variable.
Fed / Financials:
Long-term Treasury yields reached a 24-year high despite weaker jobs signals, lower oil prices, and more patient Fed rhetoric. Fed Governor Barr said AI investment demand is affecting prices and that further policy adjustment is needed to return inflation to target; New York Fed President Williams said there was no urgency to raise rates.
Macro / Other:
Consumer confidence weakened, adding to concerns about household demand. Bond volatility rose even as the VIX remained subdued, signaling greater stress in interest-rate markets than in equity-volatility measures.
Conclusion:
Multiyear highs in long-term Treasury yields and persistent inflation concerns were the dominant pressures on equity sentiment. Softer consumer confidence and weaker labor signals added to the cautious market backdrop.
Energy-policy actions reflected fuel-price stress tied to geopolitical conflict. Gold recovered during the session, but elevated yields and dollar strength remained significant cross-currents, while subdued equity volatility contrasted with higher bond-market volatility.
Market News Sentiment
Market News Articles: 40
- Neutral: 55.00%
- Negative: 30.00%
- Positive: 15.00%
Sentiment Summary: Market news sentiment is predominantly neutral at 55%, with negative coverage at 30% and positive coverage at 15%.
Conclusion: Indices futures day traders face a neutral news backdrop with negative articles outnumbering positive articles.
GLD,Gold Articles: 11
- Positive: 36.36%
- Neutral: 36.36%
- Negative: 27.27%
Sentiment Summary: Gold-related coverage is balanced to slightly positive, with 36% positive, 36% neutral, and 27% negative articles.
Conclusion: For indices futures day traders, gold sentiment provides a mixed risk-context signal with a modestly positive tilt.
USO,Oil Articles: 12
- Negative: 41.67%
- Neutral: 33.33%
- Positive: 25.00%
Sentiment Summary: USO/Oil coverage is mildly negative, with 42% negative, 33% neutral, and 25% positive articles across 12 items.
Conclusion: The oil news tone is negative overall, which may be a relevant cross-market sentiment input for indices futures day traders.
Market Data Snapshot
ETF Snapshot of major stock market ETFs, Mag7, and others as of: September 29, 2026 05:00
Top Movers & Losers
- META 738.79 Bullish 3.24% ▲
- GLD 382.89 Bullish 1.32% ▲
- IBIT 47.33 Bullish 0.25% ▲
- TSLA 352.84 Bearish -1.29% ▼
- AAPL 329.40 Bearish -2.66% ▼
- USO 143.35 Bearish -4.44% ▼
Major Index ETFs: SPY, QQQ, DIA, IWM, IJH
- QQQ 737.93 Bullish 0.19% ▲
- IJH 72.37 Bearish -0.10% ▼
- SPY 764.20 Bearish -0.18% ▼
- DIA 512.88 Bearish -0.22% ▼
- IWM 279.01 Bearish -0.36% ▼
Mixed index ETF snapshot: QQQ is the most bullish mover at +0.19%. IWM is the most bearish mover at -0.36%, while DIA declined -0.22% and SPY fell -0.18%. IJH was marginally Bearish at -0.10%.
Mag 7 Stocks: AAPL, MSFT, GOOG, AMZN, META, NVDA, TSLA
- META 738.79 Bullish 3.24% ▲
- AMZN 246.67 Bullish 0.21% ▲
- MSFT 508.96 Bearish -0.05% ▼
- GOOG 337.32 Bearish -0.54% ▼
- NVDA 227.21 Bearish -0.72% ▼
- TSLA 352.84 Bearish -1.29% ▼
- AAPL 329.40 Bearish -2.66% ▼
Mixed: META is the most bullish mover at +3.24%, while AAPL is the most bearish mover at -2.66%. AMZN is modestly Bullish at +0.21%; MSFT is marginally Bearish at -0.05%, with GOOG -0.54%, NVDA -0.72%, and TSLA -1.29% also Bearish.
Cross-Market ETFs: TLT, GLD, USO, IBIT
- GLD 382.89 Bullish 1.32% ▲
- IBIT 47.33 Bullish 0.25% ▲
- TLT 78.23 Bearish -0.50% ▼
- USO 143.35 Bearish -4.44% ▼
Mixed: GLD is the most bullish mover at +1.32%, while IBIT is marginally Bullish at +0.25%. USO is the most bearish mover at -4.44%, and TLT is Bearish at -0.50%.
ETF, Mag7, and Cross-Market ETF Insights
Overall Tone
Mixed: narrow Bullish leadership in META and GLD contrasts with Bearish breadth across most equity ETFs, several Mag7 names, bonds, and oil.
Equity ETFs and Mag7:
Major Index ETFs were broadly Bearish, with QQQ marginally Bullish at +0.19%, while SPY fell -0.18%, DIA -0.22%, IWM -0.36%, and IJH was near-flat Bearish at -0.10%. Mag7 performance was selective: META was the most bullish mover at +3.24%, AMZN gained +0.21%, and MSFT was marginally Bearish at -0.05%; GOOG, NVDA, TSLA, and AAPL declined, with AAPL the most bearish mover at -2.66%. Equity performance was Mixed rather than broadly aligned.
Cross-Market ETFs:
Cross-market ETFs were Mixed, led by GLD as the most bullish mover at +1.32%, while IBIT added +0.25%. TLT declined -0.50% and USO was the most bearish mover at -4.44%, showing Bearish bond and oil performance against Bullish gold.
Futures Indices – Higher Time Frame Analysis
Summary of the current state of US Indices Futures based on higher time-frame (HTF) technical analysis as of: 2026-09-29: 17:00 CT.
US Indices Futures
- ES YSFG above F0%, MSFG/WSFG below F0%, benchmarks rising, UTrend intact, resistance 7848.50-7906.25, support 7764.75, 7636.25, 7575.00.
- NQ YSFG/MSFG upward, WSFG below F0%, benchmarks rising, HiLo UTrend, resistance 31094.75-31389.25, pivots 30223.00 and 28728.25, support 29053.00.
- YM YSFG above F0%, MSFG/WSFG weak, mixed benchmarks, daily DTrend, pivot resistance 52719, support 51447-51479, 55316 pivot high.
- EMD YSFG above F0%, MSFG/WSFG below F0%, benchmarks lower through 200-day, DTrend, support 3617.1-3628.7, rebound zone 3674.3-3716.7.
- RTY YSFG above F0%, MSFG/WSFG below F0%, short benchmarks declining, daily DTrend, support 2823.9, reversal pivot 2906.3, resistance 2931.2.
- FDAX YSFG above F0%, MSFG below F0%, WSFG near F0%, DTrend, support 25337, resistance 25990 and 26847, long benchmarks rising.
Overall State
- Short-Term: Bearish
- Intermediate-Term: Bearish
- Long-Term: Bullish
Conclusion
ES and NQ retain upward benchmark alignment and higher-timeframe UTrend structures despite WSFG/MSFG pullbacks. YM, EMD, RTY, and FDAX hold bearish short-term pivot structures, with EMD also below its 200-day benchmark. Yearly Fib-grid alignment and rising longer benchmarks remain broadly bullish outside EMD, while current directional correlation is dominated by September retracements and tests of listed swing supports.
Note: Intra-day counter-trend pullbacks or retracements may occur, HTF is context for informational usage and market structure. Glossary: Session Fib Grids periods of YSFG:’Yearly’, MSFG:’Monthly’, WSFG:’Weekly’
For full details visit: AlphaWebTrader Technicals
ES Daily View
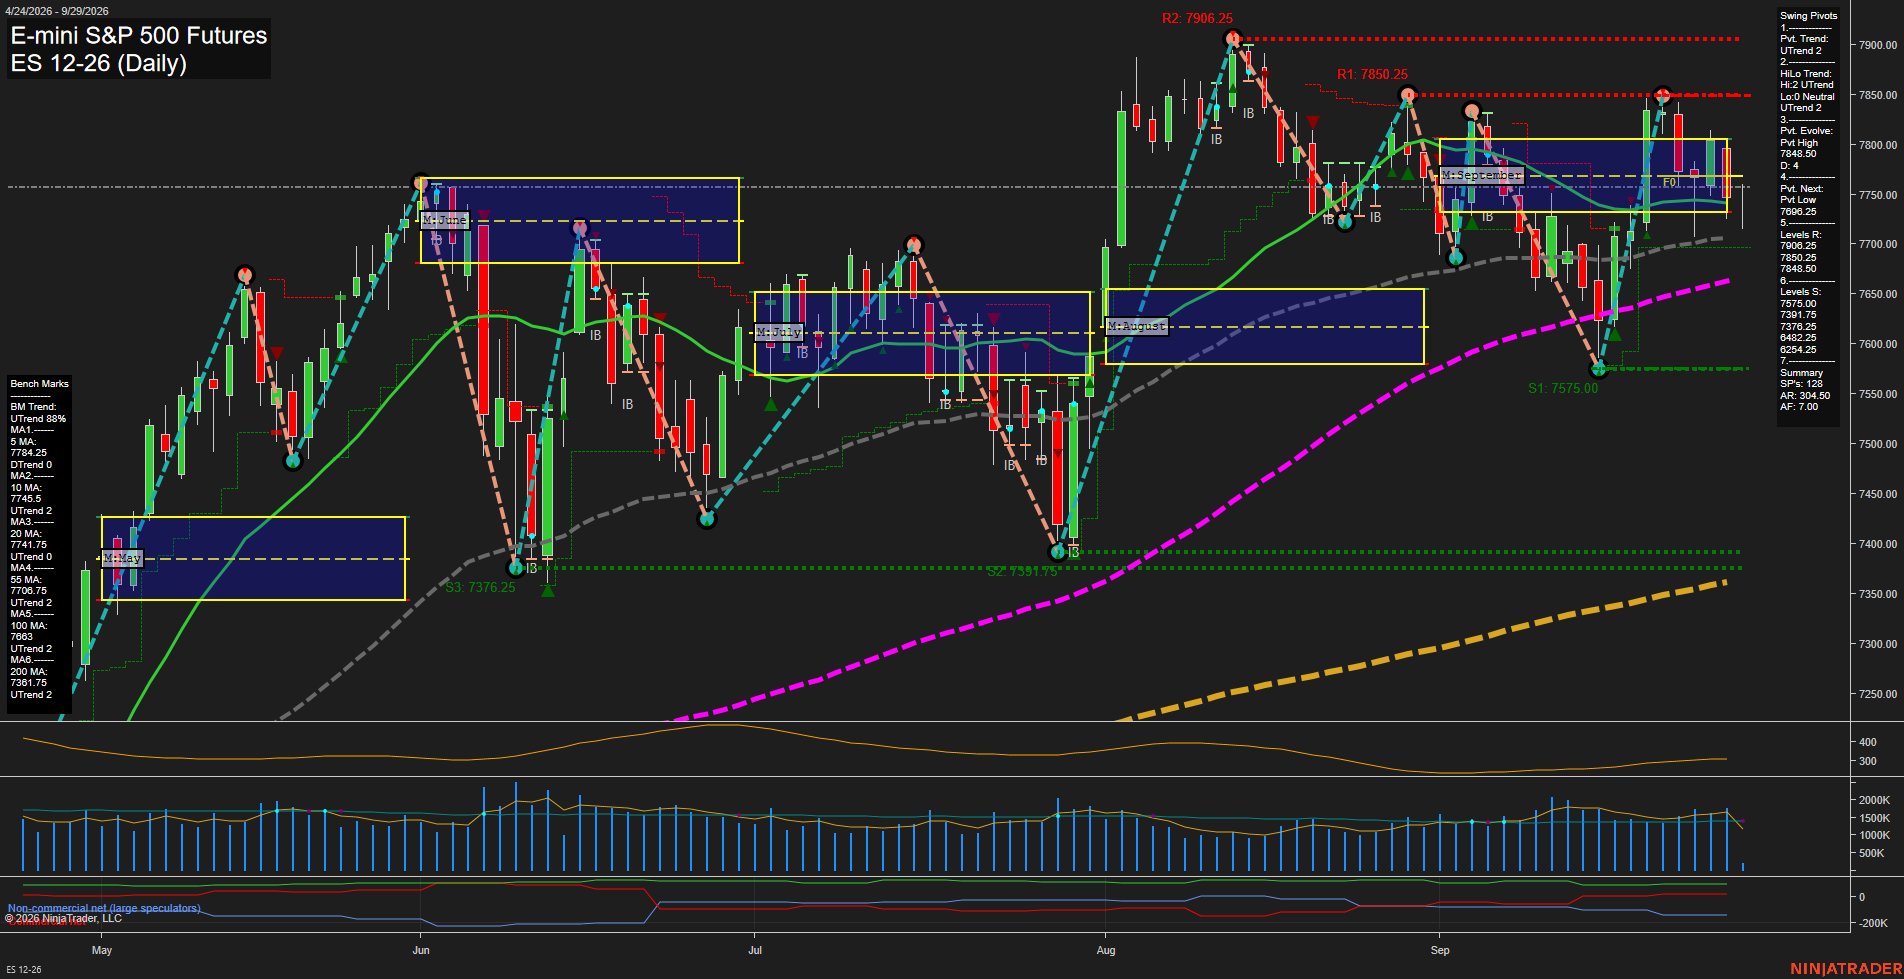
Overall Rating
- Short-Term: Neutral
- Intermediate-Term: Bullish
- Long-Term: Bullish.
Key Insights Summary
Price is consolidating beneath the 7848.50 to 7850.25 pivot-resistance cluster after a rebound from the 7575.00 swing low. The weekly and monthly Fib grids remain below their F0% lines, reflecting a short-term countertrend pullback, while the UTrend pivot structure and price above the 10, 20, 55, 100, and 200-day benchmarks preserve a broader constructive trend. The 7764.75 area is near the rising 10 and 20-day averages, with 7636.25 defining the next pivot-reversal level and 7575.00 the principal nearby swing support. Volatility remains elevated with ATR near 304.50, consistent with broad daily rotations inside an overall higher-timeframe advance.
View charts on: AlphaWebTrader HTF Charts
NQ Daily View
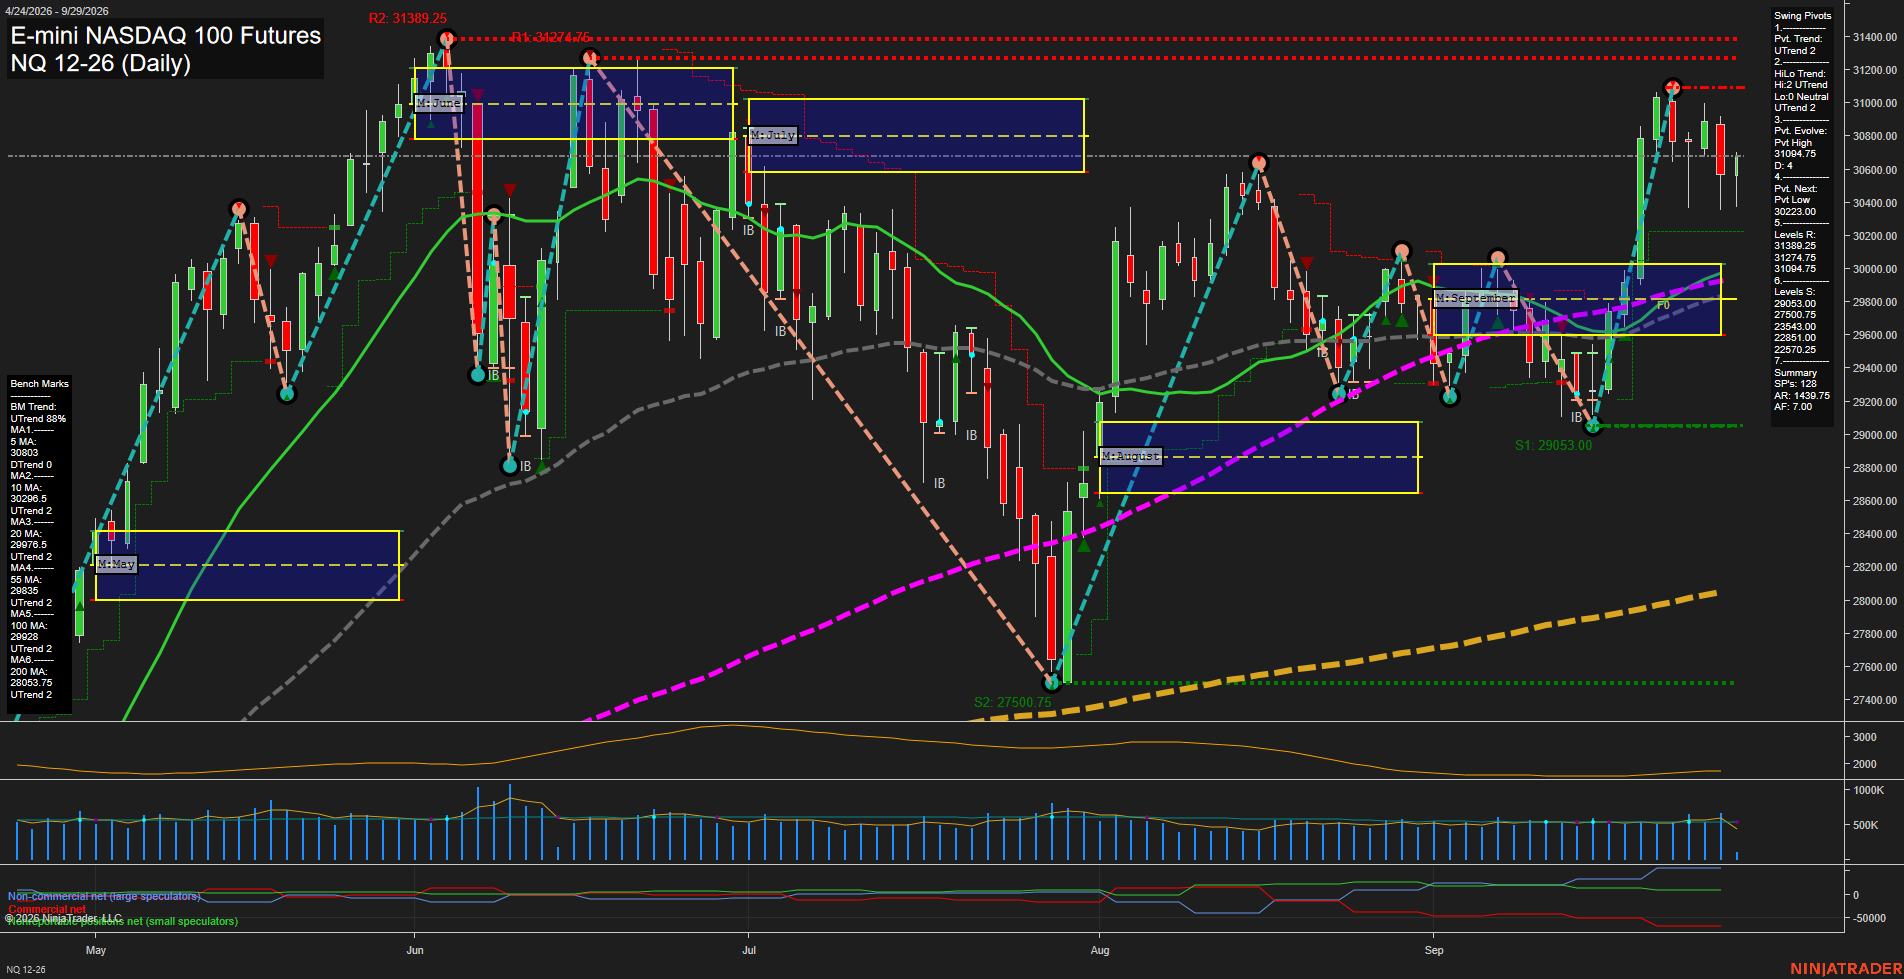
Overall Rating
- Short-Term: Neutral
- Intermediate-Term: Bullish
- Long-Term: Bullish.
Key Insights Summary
The daily structure remains broadly constructive, with price above the rising 10, 20, 55, 100, and 200-day benchmarks and the intermediate HiLo pivot trend still in UTrend. Short-term action has become mixed after rejection from the 31094.75 pivot-high area: the 5-day average is declining, the weekly fib-grid bias is below F0%, and the latest TR120 signal is short. Price is consolidating above the 30223.00 next-pivot level after a sharp September recovery, leaving 31094.75 as the nearest pivot resistance and 29053.00 as the principal swing support. Volatility remains elevated relative to the recent consolidation, consistent with medium-sized daily bars and a choppy pullback within the larger bullish structure.
View charts on: AlphaWebTrader HTF Charts
CL Daily View
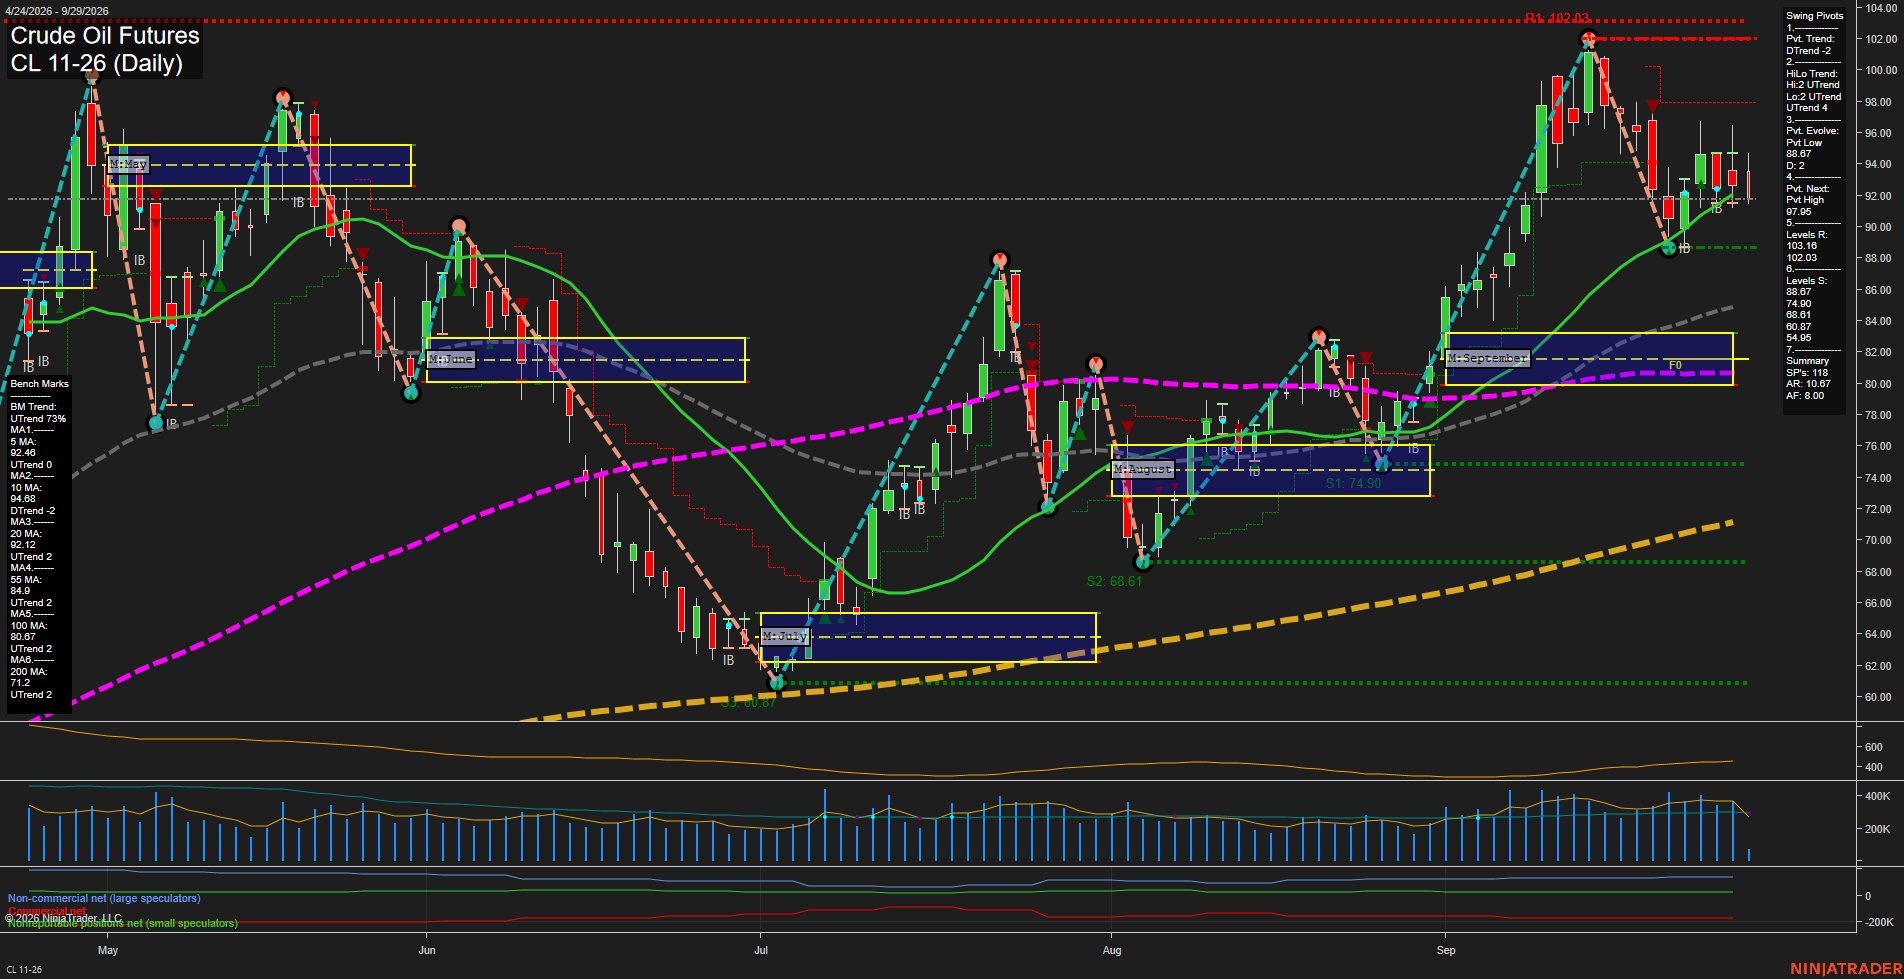
Overall Rating
- Short-Term: Bearish
- Intermediate-Term: Bullish
- Long-Term: Bullish.
Key Insights Summary
Price has shifted into a fast short-term pullback after rejection from the 102.03 swing-high resistance area. The daily pivot trend is down and price is below both the 5-day and 10-day benchmarks, while the weekly fib-grid position remains below its F0%/NTZ area. Intermediate and long-term structure remains constructive: the HiLo trend is up, price remains above the 20-day, 55-day, 100-day, and 200-day benchmarks, and the monthly and yearly fib-grid trends remain positive. The 88.67 pivot low is the primary nearby structural support, while 97.95 and 102.03 define the overhead pivot-reversal and major resistance zones.
View charts on: AlphaWebTrader HTF Charts
GC Daily View
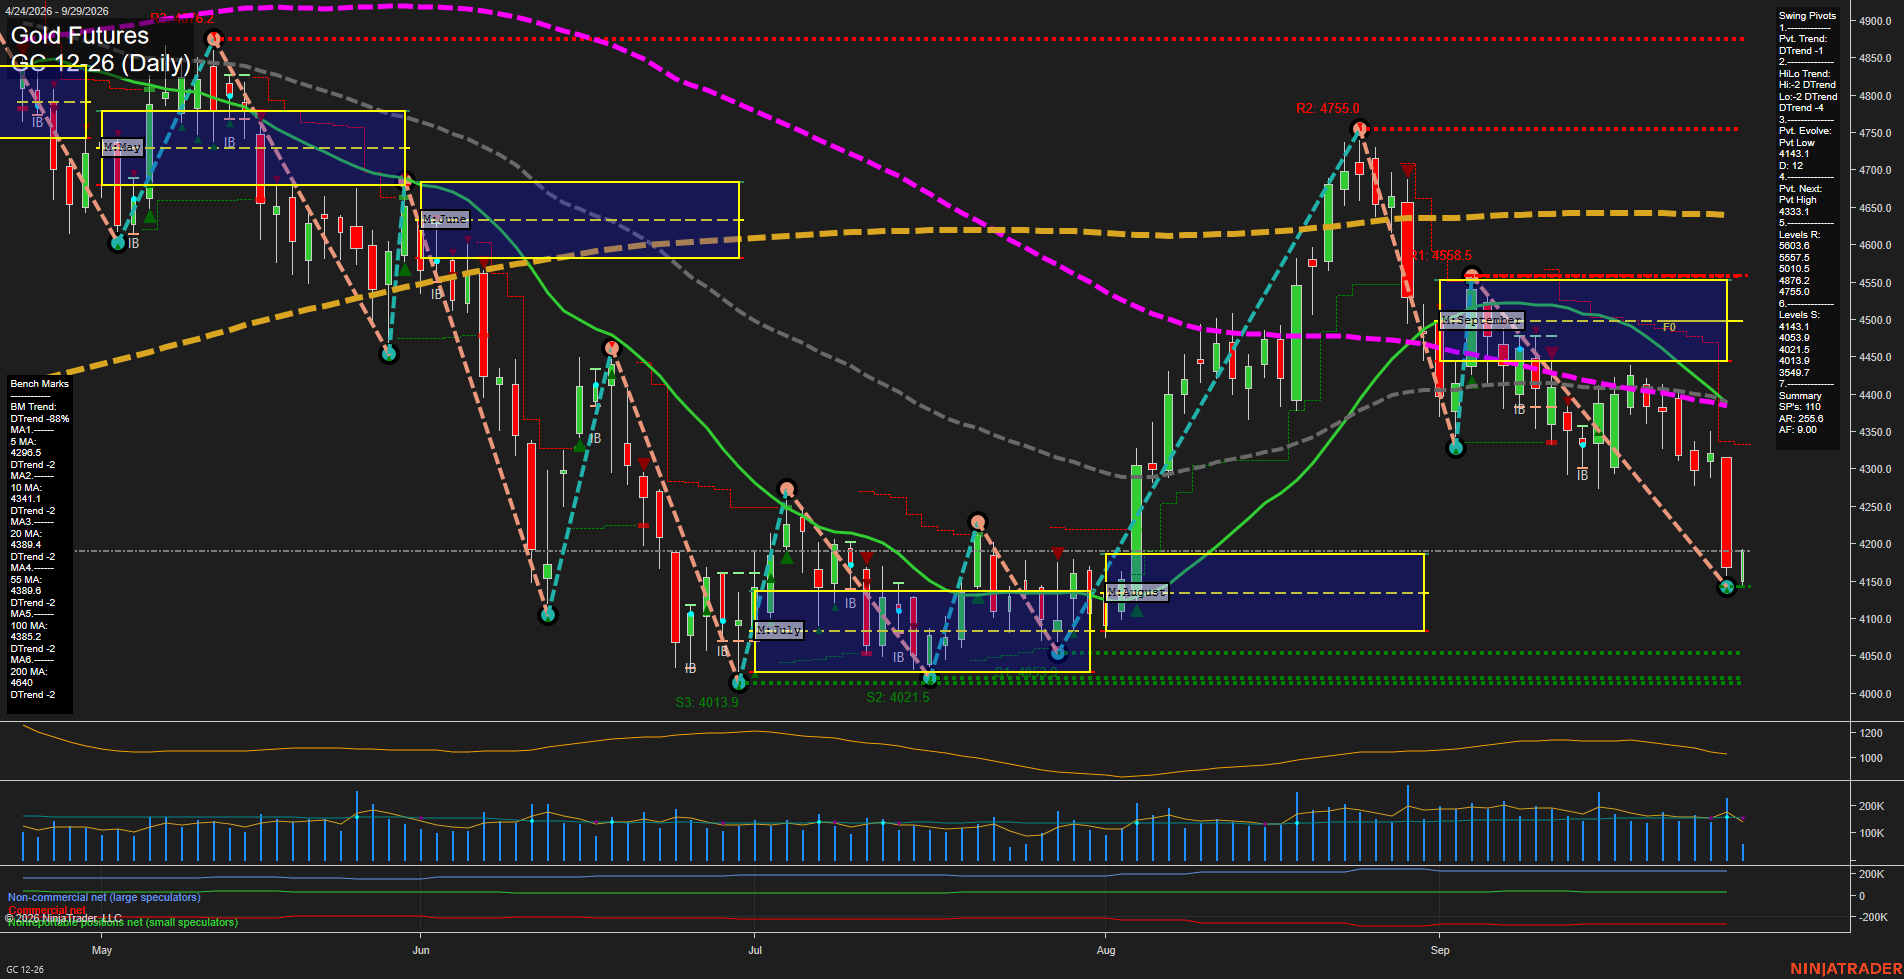
Overall Rating
- Short-Term: Bearish
- Intermediate-Term: Bearish
- Long-Term: Bearish.
Key Insights Summary
GC has accelerated lower from the late-August 4755.0 pivot high, producing a sequence of lower highs and lower lows that confirms both short-term and intermediate-term pivot downtrends. The large recent decline has pushed price below every daily benchmark and below the September MSFG F0%/NTZ area, while weekly, monthly, and yearly fib-grid readings remain negative. The 4143.1 pivot low is the immediate structural reference, with the clustered 4053.9 to 4013.9 supports representing the next downside zone. Overhead, the 4339.1 next-pivot threshold and the 5-to-100 day moving-average cluster near 4296.5 to 4389.8 define a broad bearish retracement ceiling. Elevated range expansion and persistent downside momentum characterize the current futures swing environment.
View charts on: AlphaWebTrader HTF Charts
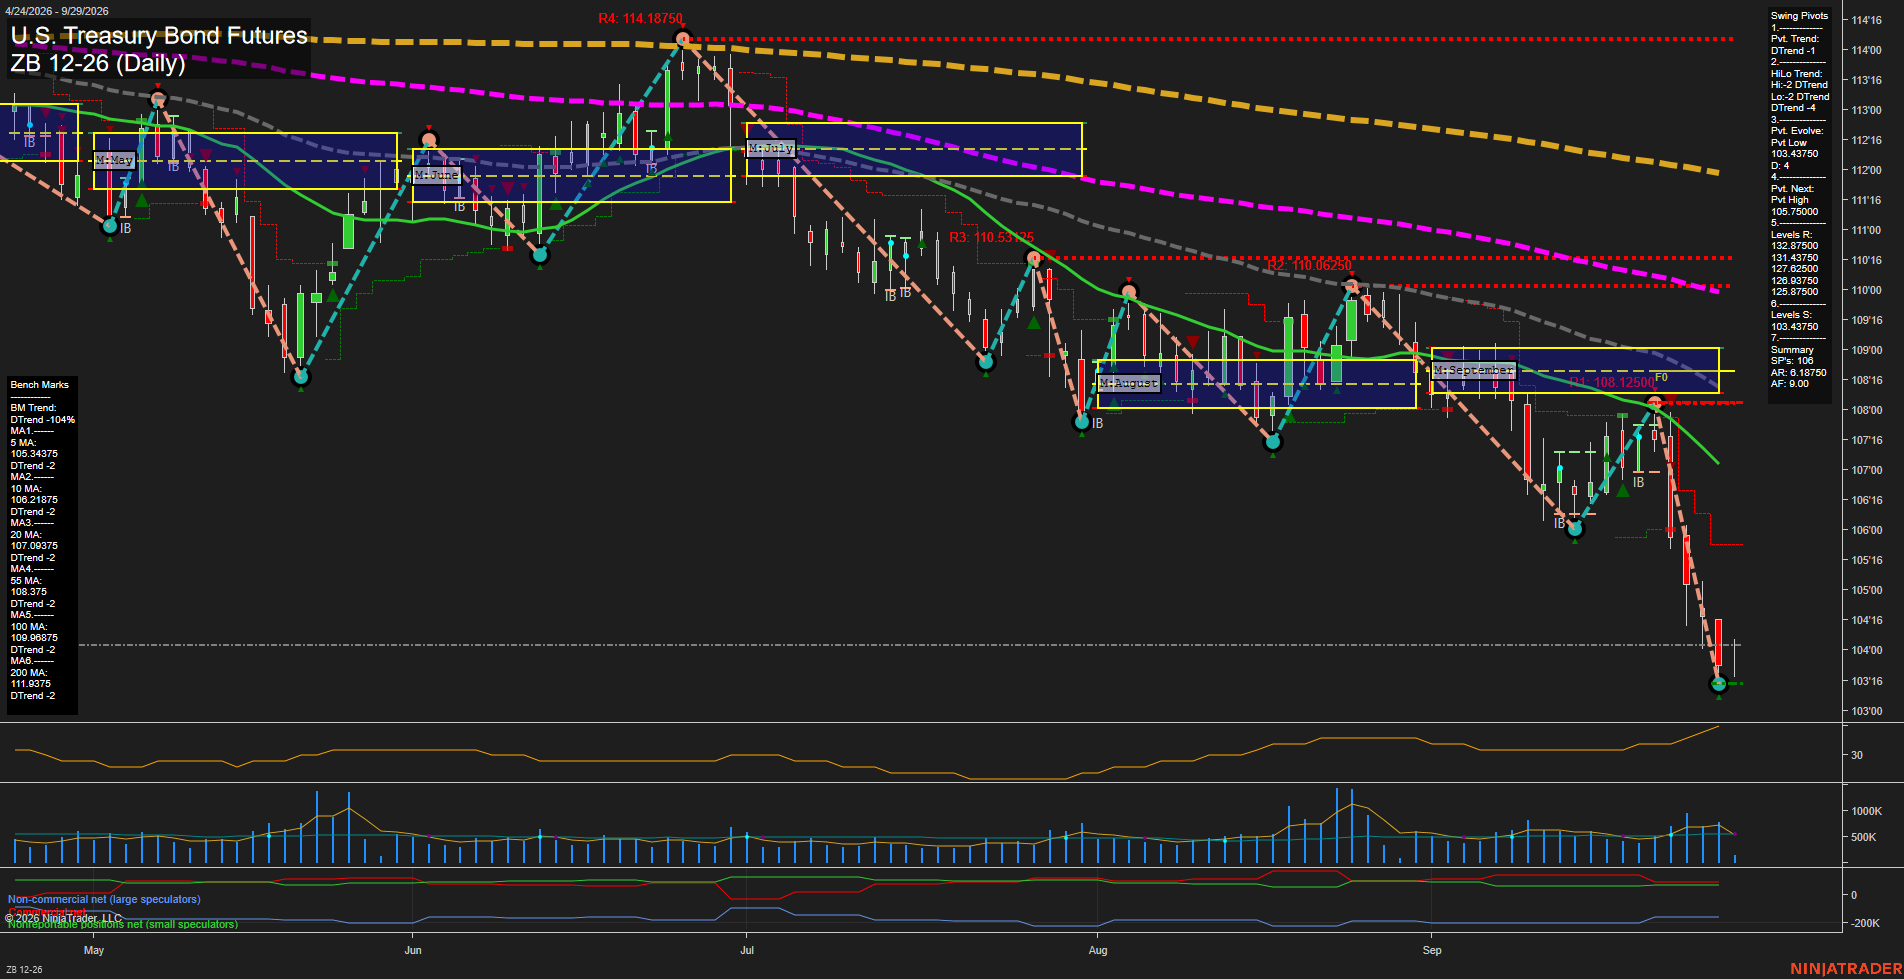
ZB Daily View
Overall Rating
- Short-Term: Bearish
- Intermediate-Term: Bearish
- Long-Term: Bearish.
Key Insights Summary
ZB remains in a broad, synchronized bearish trend: price is below every benchmark average, each average is declining, and both the short-term pivot trend and intermediate-term HiLo structure are in DTrend. The market has extended sharply beneath the September MSFG area near 108.1250 and is making lower highs and lower lows. The latest 103.4375 pivot low produced a modest bounce toward 104.0625, but momentum remains fast and the bounce is still structurally countertrend beneath the 5-day average at 105.34375. A reversal of the active pivot sequence would require a move through 105.7500, while 103.4375 remains the nearest established swing-low reference.
View charts on: AlphaWebTrader HTF Charts