U.S. stocks ended a volatile week higher as lower oil and AI strength offset elevated Treasury yields, while jobs data and Fed pricing stayed in focus.
Fundamentals: U.S. equities recovered late in the week as easing oil prices and gains in AI-related shares supported the S&P 500 and Nasdaq. Most sectors remained weaker, highlighting narrow market leadership, while long-dated Treasury yields near 5.2% continued to pressure valuations. Gold tested support as investors tracked inflation expectations, consumer sentiment, Middle East developments and upcoming jobs data.
Technicals: MSFT, AAPL and DIA led the listed ETF movers, while META, USO and TSLA declined. Futures analysis shows bullish multi-timeframe structures in ES and NQ, with both consolidating near resistance after strong recoveries. YM, EMD, RTY and FDAX remain under short-term downside pressure, though several retain constructive longer-term trend conditions.
After Market Close daily snapshot: market news summary and sentiment, major ETFs, Magnificent 7 analysis, Indices Futures Higher Time Frame Analysis, and E-mini S&P500, Nasdaq 100, NYMEX Crude, Gold Futures Daily Chart analysis.
As of: September 25, 2026 05:00 CT
Market News Summary:
U.S. equities ended a volatile week higher as easing oil prices offset pressure from elevated Treasury yields and rate-hike expectations.
Primary Drivers & Risks:
- Primary Driver: Lower oil prices support equities
- Primary Risk: Elevated yields and jobs data
Tone:
Mixed, with a late risk-on recovery amid persistent rate pressure.
Stock Market / ETFs / Indices:
The S&P 500 and Nasdaq were lifted by AI-related names while most sectors weakened. U.S. stocks recovered after earlier declines as oil fell, though market leadership remained narrow and concentration concerns persisted.
Geopolitical:
Hope for U.S.-Iran progress on opening the Strait of Hormuz helped reduce oil pressure. Middle East conflict risks remained a key energy and inflation cross-current, while U.S.-China concerns remained in focus.
Oil / Energy:
WTI and Brent pulled back toward technical support as Hormuz diplomacy eased supply concerns. Saudi crude exports reached 6 million barrels per day despite damage-related closure of the East-West pipeline, adding supply context to lower prices.
Gold / Metals:
Gold tested support near $4,300 and briefly reached $4,254 after consumer sentiment improved and inflation expectations rose. Falling oil and a softer dollar supported some rebound attempts, but high Treasury yields and hawkish Fed pricing limited gains. Chile’s Escondida copper mine faced labor-talk disruption following a worker fatality.
Fed / Financials:
Long-dated Treasury selling pushed TLT to a record low, with yields near 5.2% cited alongside persistent inflation and tighter-policy expectations. Commentary highlighted one to two additional 2026 Fed rate hikes, while 10-year yields near 5% increased competition between bonds and equities.
Macro / Other:
Final September consumer sentiment rose to 48.1 from the preliminary 47.8 reading but remained below August’s 51.7. Inflation expectations increased, and attention shifted toward upcoming U.S. jobs data after discussion of a stronger labor report and its implications for rates.
Conclusion:
Falling oil prices and strength in AI names supported the late-week equity recovery. Treasury yields remained near cycle highs and continued to shape index performance.
Jobs data, inflation expectations, and Fed-rate pricing remain major near-term cross-currents. Middle East developments affect both energy pricing and broader risk sentiment.
Market News Sentiment
Market News Articles: 35
- Neutral: 51.43%
- Negative: 28.57%
- Positive: 20.00%
Sentiment Summary: Of 35 market news articles, 51% were neutral, 29% negative, and 20% positive, indicating neutral coverage with a negative tilt.
Conclusion: Indices futures day traders are facing a predominantly neutral news backdrop, with negative articles exceeding positive articles.
GLD,Gold Articles: 14
- Negative: 35.71%
- Neutral: 35.71%
- Positive: 28.57%
Sentiment Summary: GLD and gold coverage is mixed-to-negative, with 36% negative, 36% neutral, and 29% positive articles across 14 articles.
Conclusion: Gold-related news tone is slightly negative overall, while neutral coverage remains equally represented.
USO,Oil Articles: 9
- Neutral: 55.56%
- Negative: 44.44%
Sentiment Summary: USO/Oil coverage is mixed, with 56% neutral articles and 44% negative articles across 9 items.
Conclusion: Oil-related news tone is predominantly neutral, with a substantial negative component relevant to index futures sentiment.
Market Data Snapshot
ETF Snapshot of major stock market ETFs, Mag7, and others as of: September 25, 2026 05:00
Top Movers & Losers
- MSFT 516.17 Bullish 3.66% ▲
- AAPL 341.07 Bullish 1.53% ▲
- DIA 517.49 Bullish 0.94% ▲
- TSLA 372.11 Bearish -1.54% ▼
- USO 148.33 Bearish -3.11% ▼
- META 751.66 Bearish -3.33% ▼
Major Index ETFs: SPY, QQQ, DIA, IWM, IJH
- DIA 517.49 Bullish 0.94% ▲
- SPY 771.35 Bullish 0.54% ▲
- QQQ 744.50 Bullish 0.46% ▲
- IJH 72.99 Bullish 0.36% ▲
- IWM 281.97 Bullish 0.11% ▲
Major Index ETFs were Bullish across the group. DIA was the most bullish mover at +0.94%, followed by SPY at +0.54% and QQQ at +0.46%. IJH added +0.36%. IWM was the least positive mover at +0.11%, a marginal gain.
Mag 7 Stocks: AAPL, MSFT, GOOG, AMZN, META, NVDA, TSLA
- MSFT 516.17 Bullish 3.66% ▲
- AAPL 341.07 Bullish 1.53% ▲
- GOOG 341.08 Bullish 0.61% ▲
- NVDA 225.07 Bullish 0.22% ▲
- AMZN 249.67 Bullish 0.12% ▲
- TSLA 372.11 Bearish -1.54% ▼
- META 751.66 Bearish -3.33% ▼
Mixed: MSFT is the most bullish mover at +3.66%, followed by AAPL at +1.53% and GOOG at +0.61%. NVDA at +0.22% and AMZN at +0.12% are modestly Bullish. META is the most bearish mover at -3.33%, with TSLA Bearish at -1.54%.
Cross-Market ETFs: TLT, GLD, USO, IBIT
- GLD 393.41 Bullish 0.44% ▲
- TLT 79.32 Bearish -0.13% ▼
- IBIT 47.57 Bearish -0.50% ▼
- USO 148.33 Bearish -3.11% ▼
Mixed cross-market snapshot: GLD is the most bullish mover at +0.44%, while USO is the most bearish mover at -3.11%. IBIT is Bearish at -0.50%, and TLT is marginally Bearish at -0.13%.
ETF, Mag7, and Cross-Market ETF Insights
Overall Tone
Mixed: equity ETFs were broadly Bullish, but concentrated Mag7 weakness and Bearish cross-market moves kept the tone selective.
Equity ETFs and Mag7:
Major Index ETFs were broadly Bullish, led by DIA at +0.94%, followed by SPY at +0.54% and QQQ at +0.46%; IJH gained +0.36% while IWM was marginally Bullish at +0.11%. Mag7 leadership was selective, with MSFT the most bullish mover at +3.66% and AAPL up +1.53%, while META was the most bearish mover at -3.33% and TSLA fell -1.54%. Equities were therefore broadly Bullish at the ETF level but Mixed within mega-cap technology.
Cross-Market ETFs:
Cross-market ETFs were Mixed: GLD was Bullish at +0.44%, while TLT was marginally Bearish at -0.13% and IBIT declined -0.50%. USO was the most bearish cross-market mover at -3.11%, creating notable commodity weakness versus the broadly Bullish equity ETF complex.
Futures Indices – Higher Time Frame Analysis
Summary of the current state of US Indices Futures based on higher time-frame (HTF) technical analysis as of: 2026-09-25: 17:00 CT.
US Indices Futures
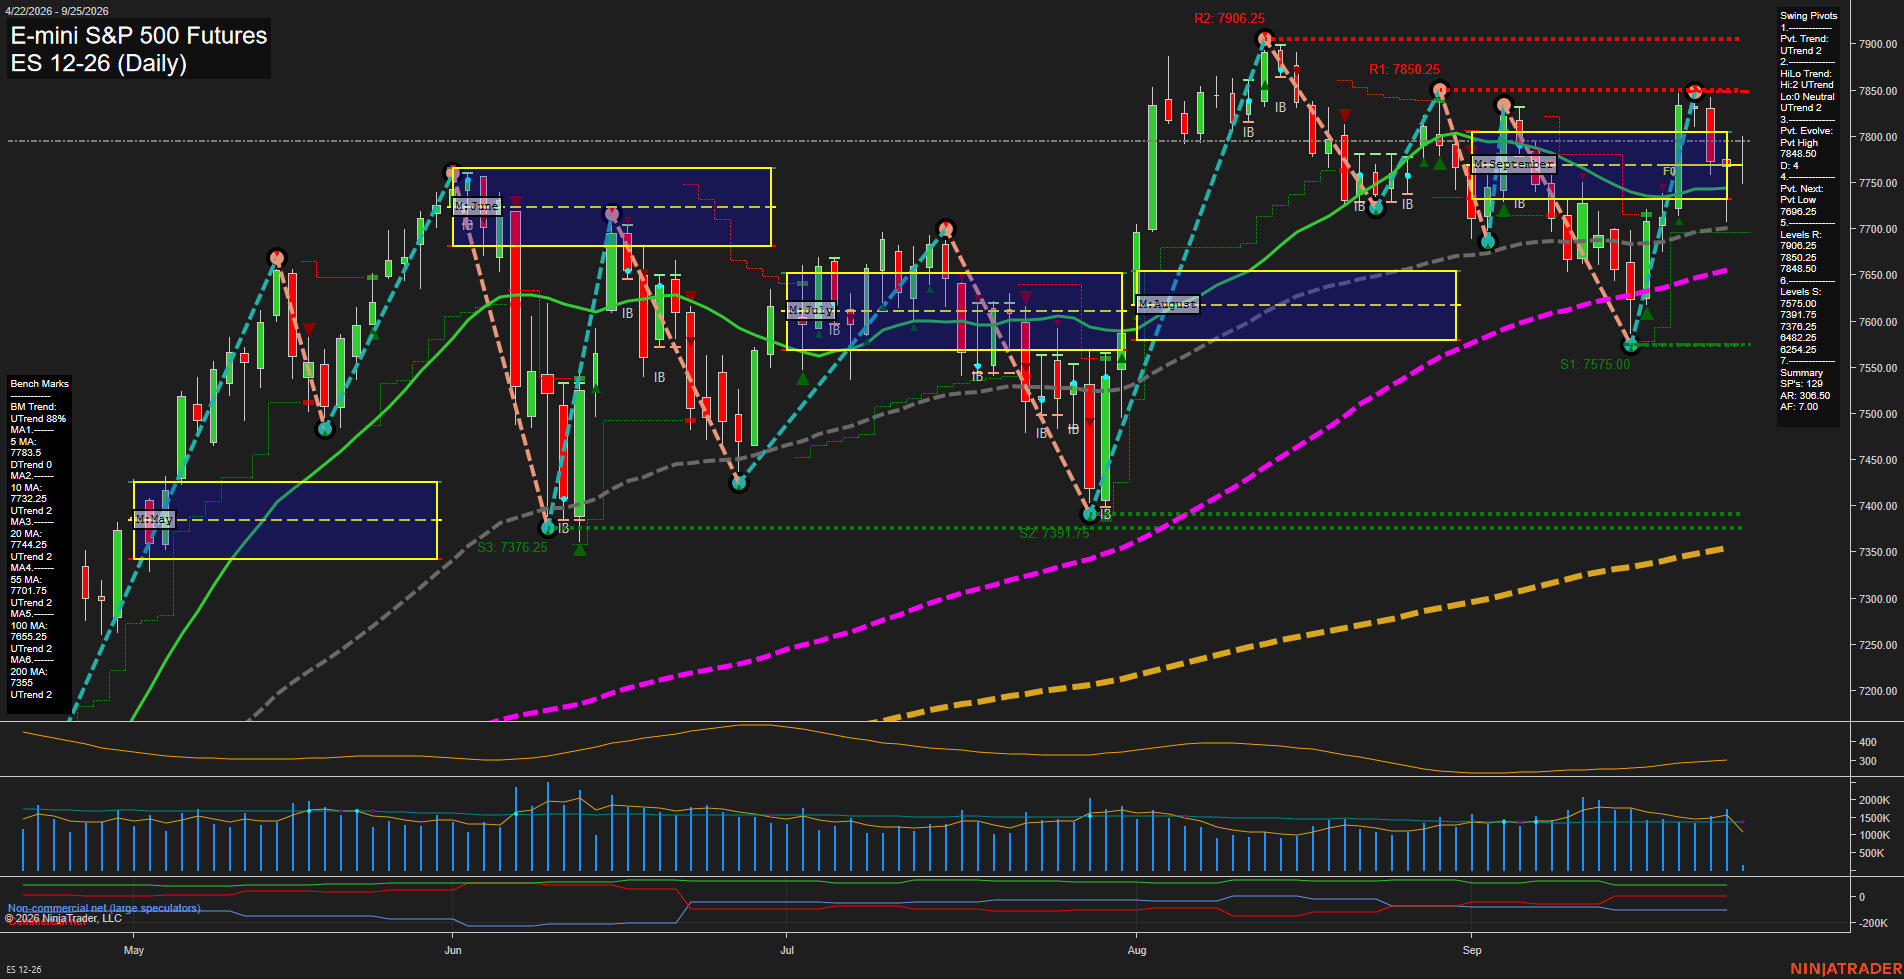
- ES YSFG/MSFG/WSFG above F0%, benchmarks rising, UTrend pivots, resistance 7848.50-7906.25, support 7550.25.
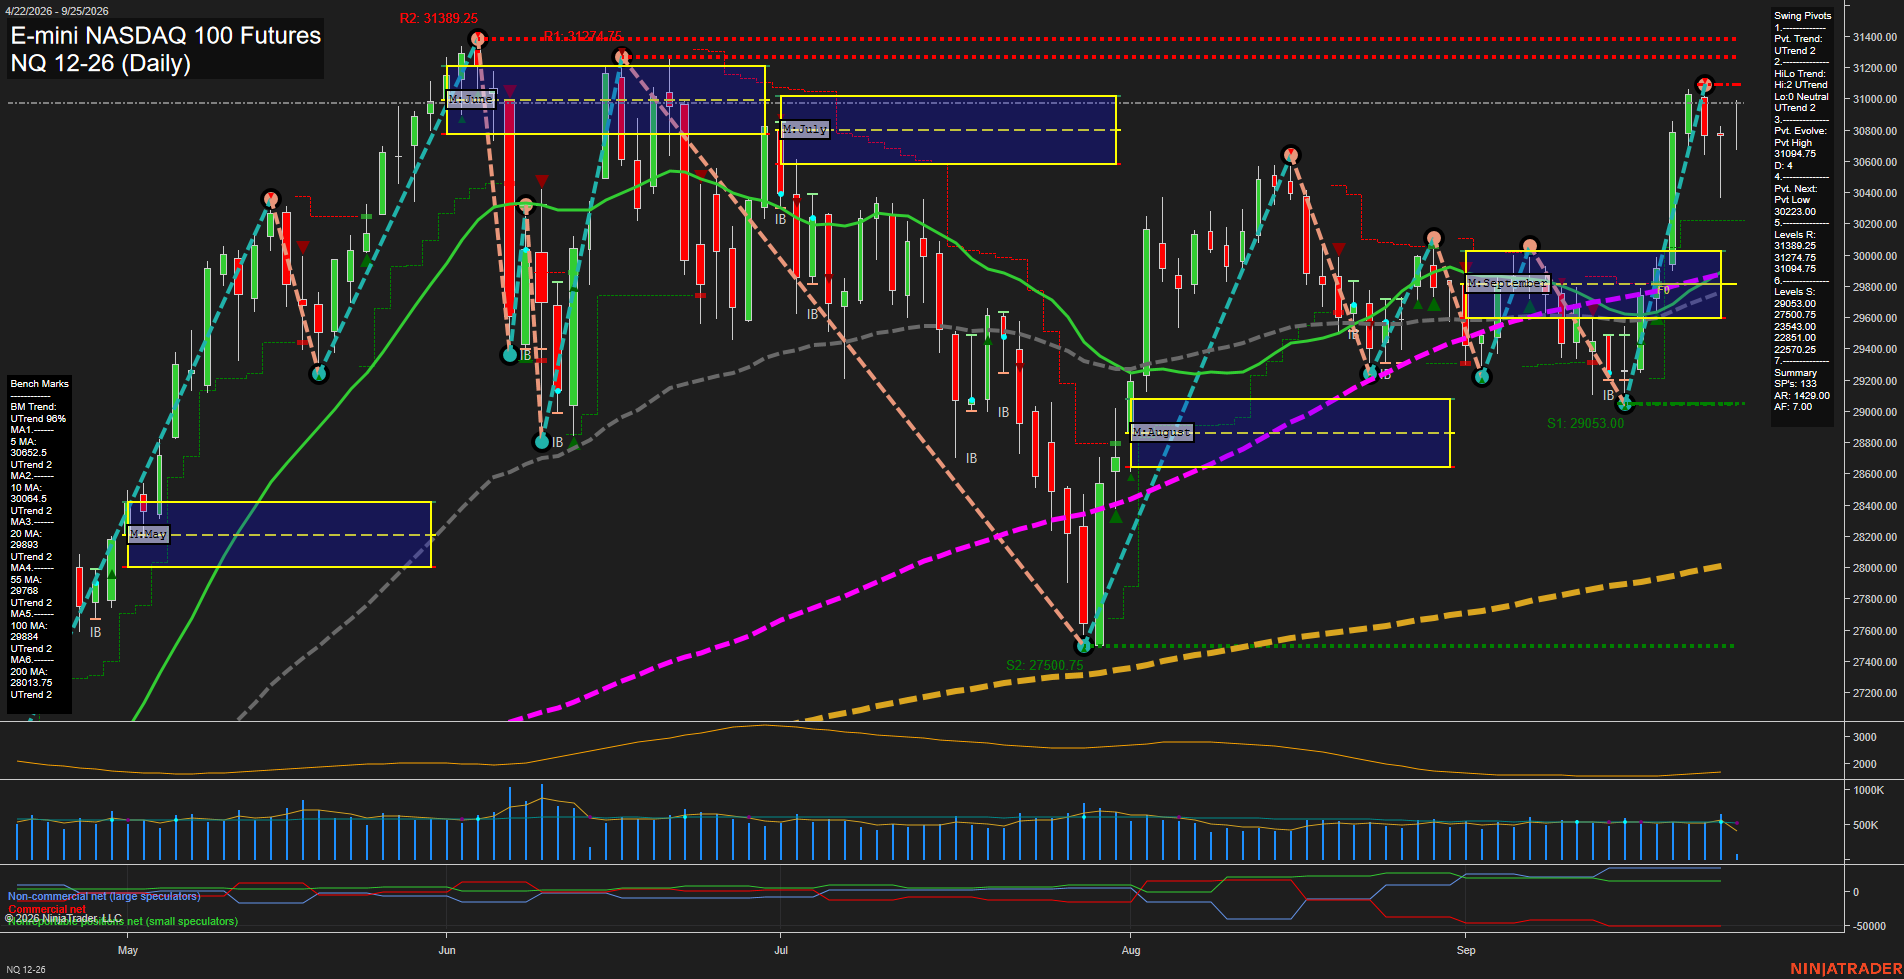
- NQ YSFG/MSFG/WSFG above F0%, above benchmarks, higher pivots, resistance 31094.75-31389.25, support 30223.00 and 28630.75.
- YM YSFG above F0%, MSFG/WSFG below F0%, short-term DTrend, support 51479/50568, resistance 52731-52944.
- EMD YSFG above F0%, MSFG below F0%, WSFG marginally above F0%, DTrend, support 3617.1-3636.2, reversal threshold 3725.2.
- RTY YSFG above F0%, MSFG/WSFG below F0%, DTrend, support 2829.9/2824, resistance 2997.7 and 3101.8.
- FDAX YSFG/WSFG above F0%, MSFG below F0%, DTrend, support 25337/24897, resistance 25943-25990 and 26847.
Overall State
- Short-Term: Bearish
- Intermediate-Term: Bearish
- Long-Term: Bullish
Conclusion
ES and NQ retain aligned HTF UTrend structures, rising benchmark arrays, and Fib-grid positioning above F0%, while testing pivot-high resistance. YM, EMD, RTY, and FDAX are in short-term DTrend retracements below weekly or monthly references and short-term benchmarks. Yearly-grid structure and longer benchmarks remain upward across most contracts, separating broad long-term structure from current corrective momentum.
Note: Intra-day counter-trend pullbacks or retracements may occur, HTF is context for informational usage and market structure. Glossary: Session Fib Grids periods of YSFG:’Yearly’, MSFG:’Monthly’, WSFG:’Weekly’
For full details visit: AlphaWebTrader Technicals
ES Daily View
Overall Rating
- Short-Term: Bullish
- Intermediate-Term: Bullish
- Long-Term: Bullish.
Key Insights Summary
Price remains in a broad daily uptrend, supported by the positive weekly, monthly, yearly Fib-grid structures and the aligned 10, 20, 55, 100, and 200-day benchmark trends. The short-term structure is consolidating beneath the 7848.50 to 7850.25 pivot-resistance cluster after a sharp rebound from the 7575.00 support area. The 5-day average is flattening/down while price holds above the 10-day and 20-day averages, describing a near-term pause within a still constructive intermediate and long-term trend. Daily ATR near 306.50 reflects elevated swing range conditions, while recent long signals across the short, intermediate, and long-term systems confirm the prevailing upside directional regime.
View charts on: AlphaWebTrader HTF Charts
NQ Daily View
Overall Rating
- Short-Term: Bullish
- Intermediate-Term: Bullish
- Long-Term: Bullish.
Key Insights Summary
NQ has resumed a strong upside swing from the September pivot low, reclaiming all major daily benchmarks and advancing above the weekly and monthly fib-grid equilibrium areas. The pivot structure is aligned upward across short- and intermediate-term measures, with the current evolving pivot high at 31074.5 pressing into the 31094.75 to 31389.25 resistance band. Momentum is fast after the sharp V-shaped recovery, while the most recent smaller candles beneath resistance indicate a pause or consolidation following the breakout impulse. The 30223.00 pivot-next level is the defining short-term structural reference, with the 5-day and 10-day averages providing nearby rising trend support. Longer-term structure remains constructive as price holds materially above the rising 55-day, 100-day, and 200-day benchmarks.
View charts on: AlphaWebTrader HTF Charts
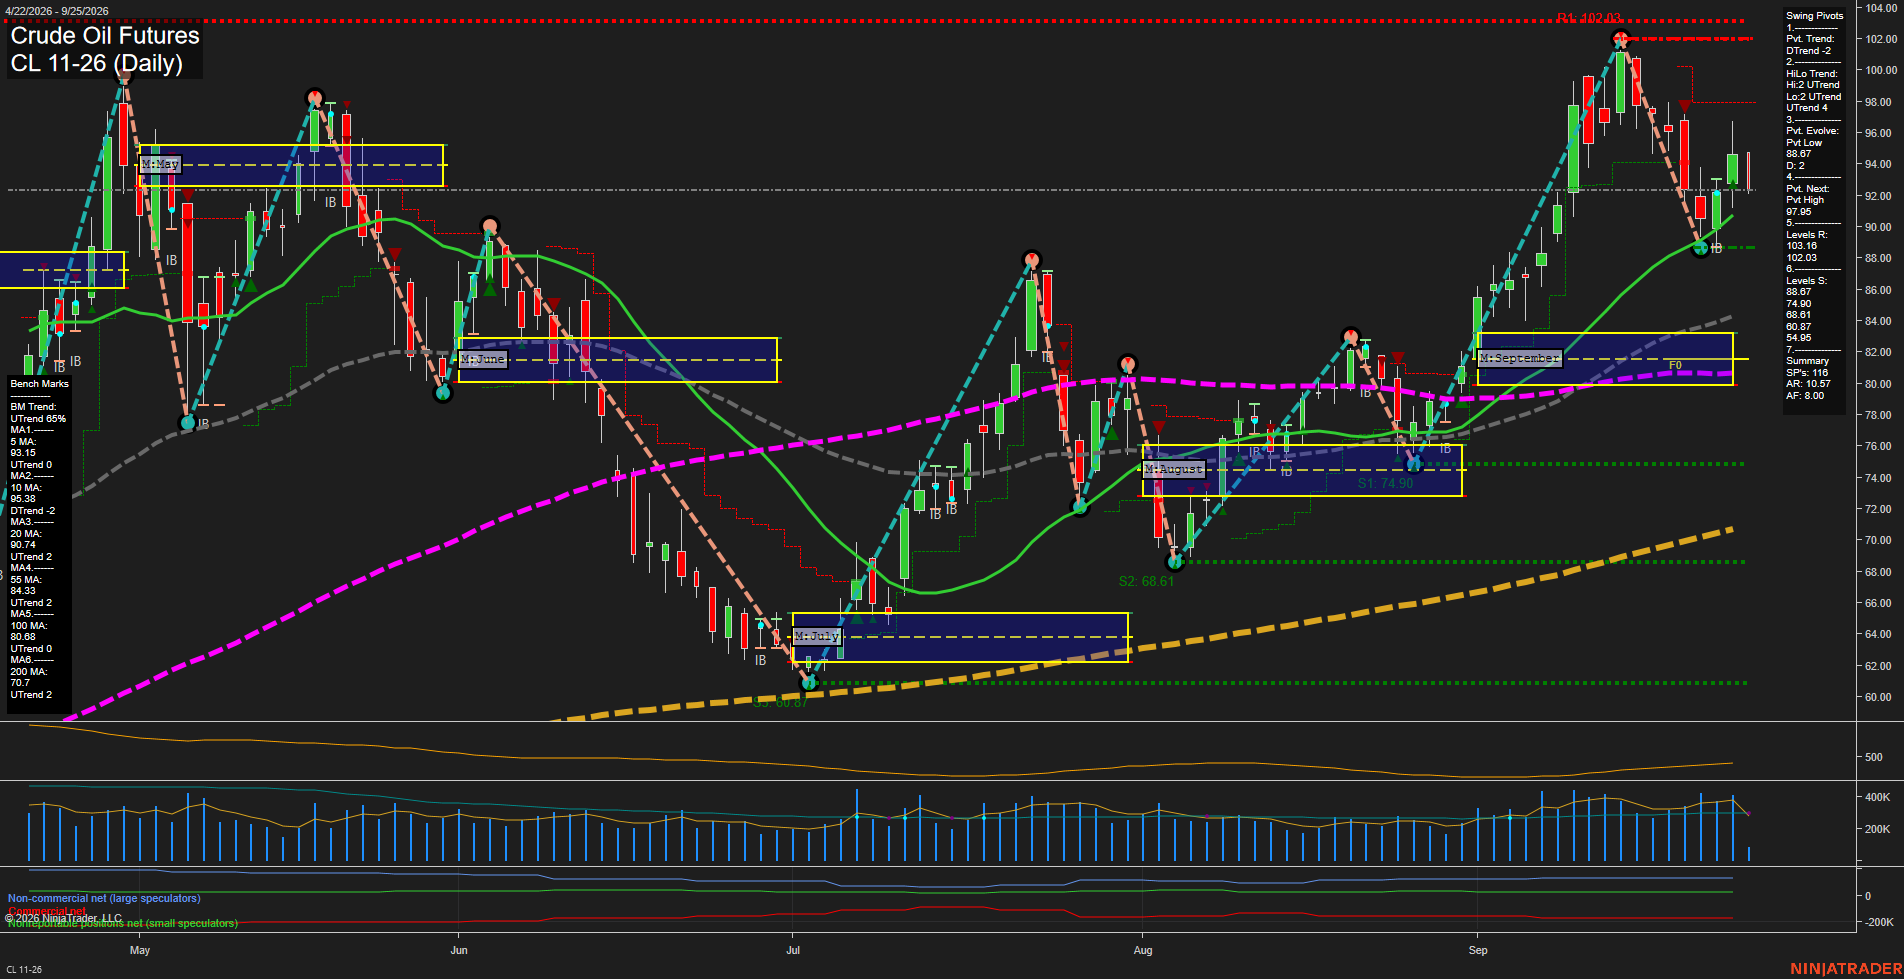
CL Daily View
Overall Rating
- Short-Term: Bearish
- Intermediate-Term: Bullish
- Long-Term: Bullish.
Key Insights Summary
Crude is rebounding from the 88.67 swing-low area after a sharp pullback from the 102.03 high, but the short-term pivot structure remains in DTrend and price remains below the declining 10-day benchmark. The medium-term structure remains constructive, with price above rising 20-, 55-, 100-, and 200-day benchmarks, a bullish HiLo trend, and September MSFG holding above F0%. The 97.95 pivot-next level defines the nearby upside swing threshold, while 88.67 is the key pullback support; the broader structure remains a higher-low recovery within an established long-term uptrend.
View charts on: AlphaWebTrader HTF Charts
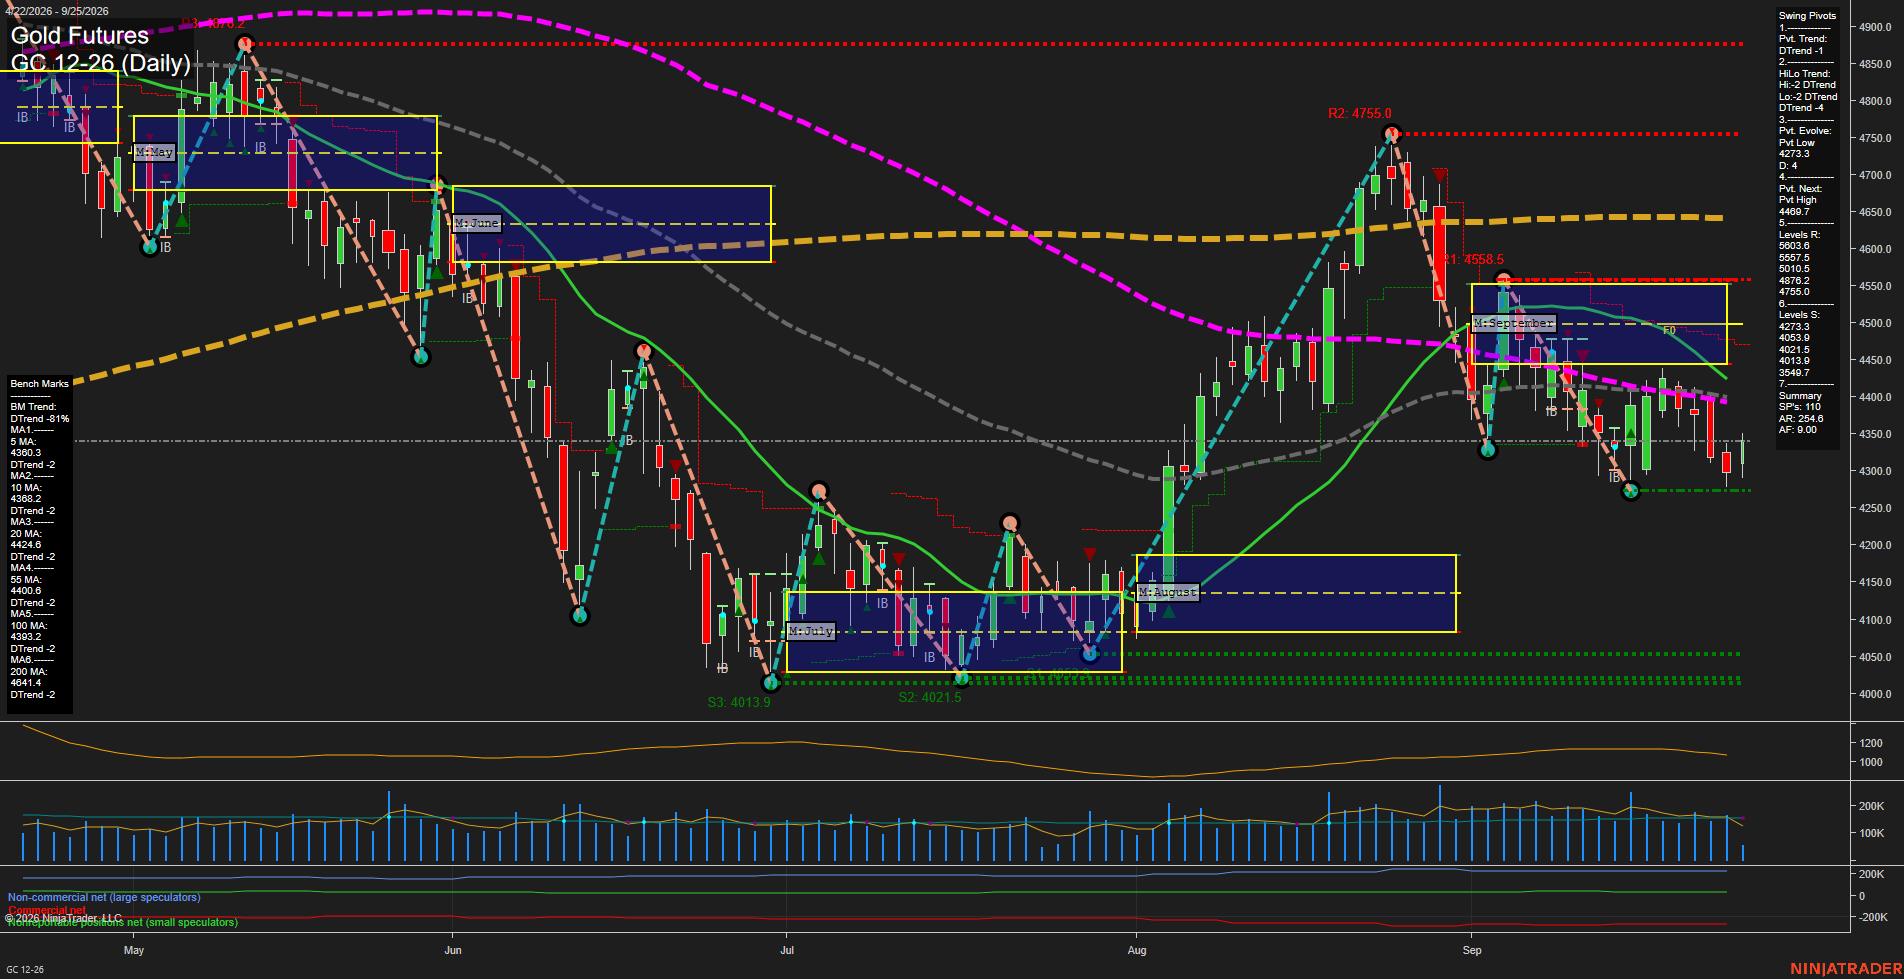
GC Daily View
Overall Rating
- Short-Term: Bearish
- Intermediate-Term: Bearish
- Long-Term: Bearish.
Key Insights Summary
Price remains below the weekly, monthly, and yearly Fib-grid reference levels, while all six benchmark averages are declining and positioned above or near the market. The pivot structure remains DTrend across both short- and intermediate-term measures following the rejection from 4755.0. The recent decline has slowed into smaller, choppier bars around 4350, but price remains beneath the nearby 5-day, 10-day, 55-day, and 100-day benchmarks. The 4273.3 pivot low is the nearest defined downside structure, while 4489.7 is the next pivot-reversal threshold and aligns with a broader overhead resistance zone.
View charts on: AlphaWebTrader HTF Charts
ZB Daily View
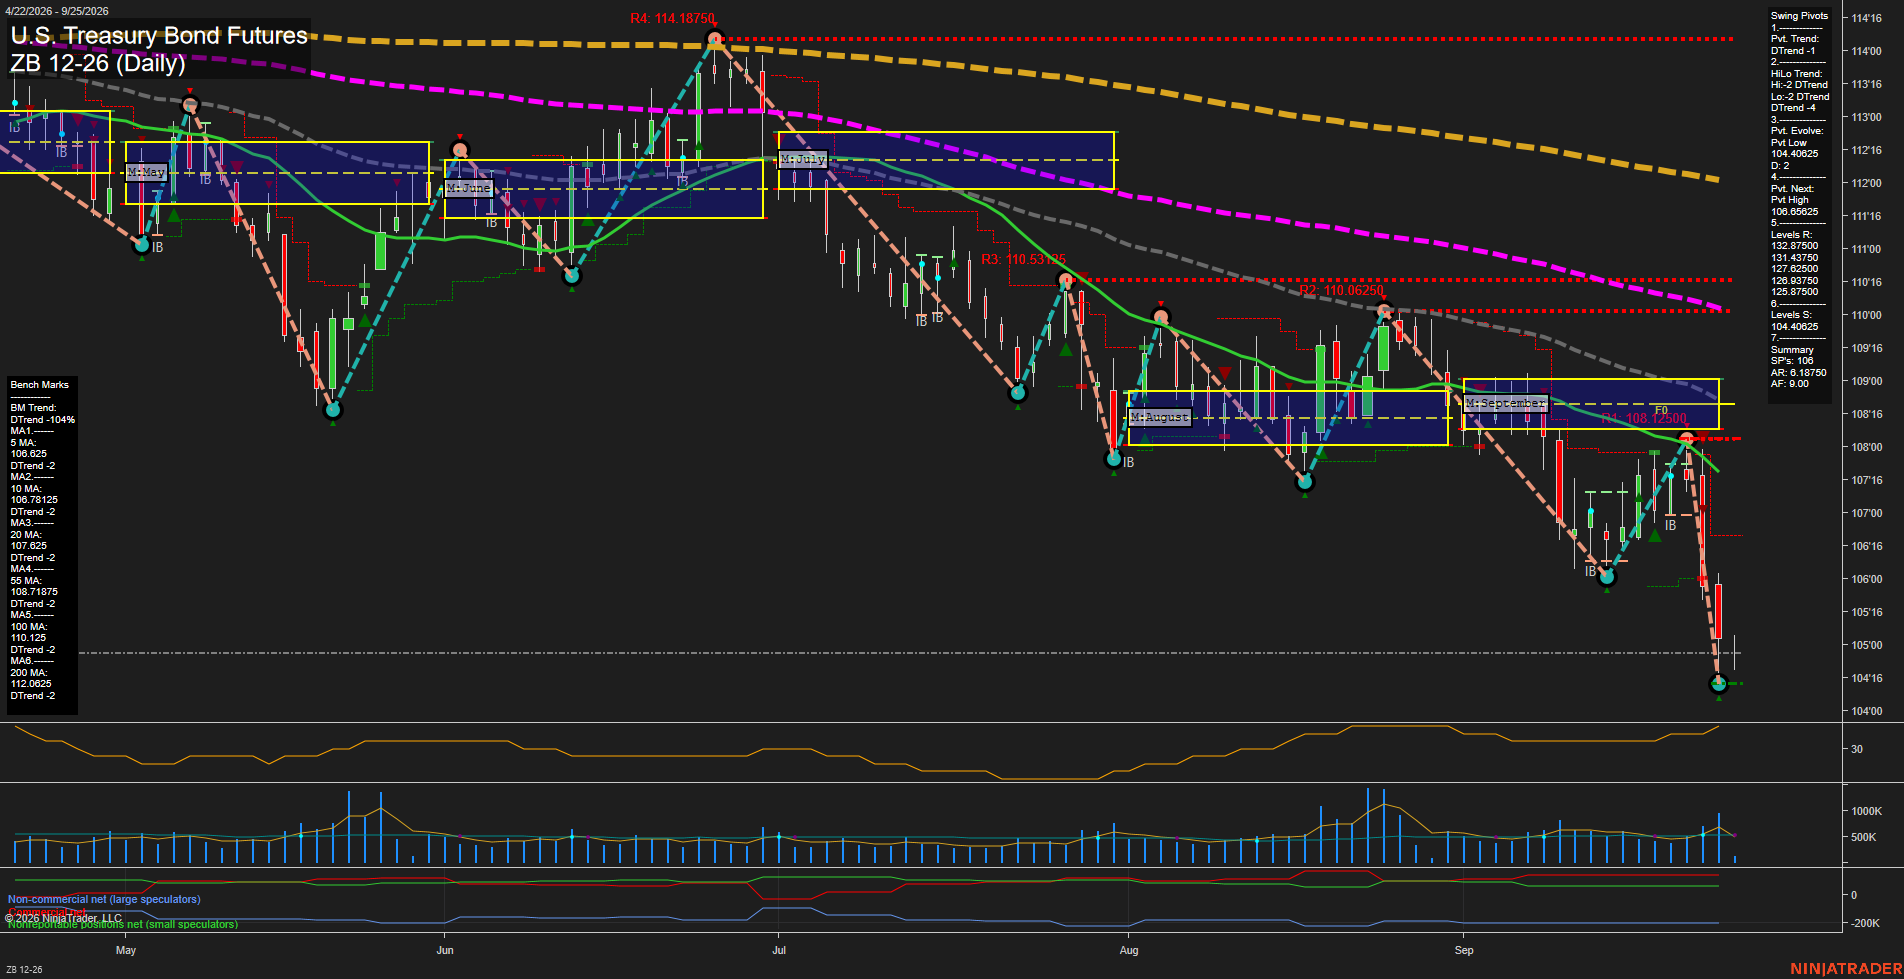
Overall Rating
- Short-Term: Bearish
- Intermediate-Term: Bearish
- Long-Term: Bearish.
Key Insights Summary
The daily structure is decisively bearish, with a fast downside momentum expansion and large-range selling pressure
View charts on: AlphaWebTrader HTF Charts