U.S. stocks closed lower as the 10-year Treasury yield topped 5%, strong PMI and inflation data lifted Fed-hike pricing, and oil rebounded again.
Fundamentals: U.S. equities ended lower after stronger activity and inflation readings pushed the 10-year Treasury yield above 5% and increased pricing for an October Fed rate hike. Technology shares faced pressure, while narrow leadership kept the S&P 500 near record levels. Oil recovered on diesel-supply concerns, and gold remained constrained by the stronger dollar and elevated yields.
Technicals: US ETFs showed diverging performance, led higher by USO, Meta and Microsoft while IBIT, Amazon and Google declined. ES and NQ futures maintained bullish alignment across daily and weekly timeframes near resistance. YM, EMD, RTY and FDAX reflected varying degrees of short-term or intermediate corrective pressure despite broadly constructive longer-term structures.
After Market Close daily snapshot: market news summary and sentiment, major ETFs, Magnificent 7 analysis, Indices Futures Higher Time Frame Analysis, and E-mini S&P500, Nasdaq 100, NYMEX Crude, Gold Futures Daily Chart analysis.
As of: September 23, 2026 05:00 CT
Market News Summary:
Equities retreated as strong activity and inflation data drove a sharp Treasury-yield surge and intensified October Fed-hike pricing.
Primary Drivers & Risks:
- Primary Driver: Surging Treasury yields and Fed repricing
- Primary Risk: Higher borrowing costs pressure equities
Tone:
Risk-off, with rate and inflation concerns dominating.
Stock Market / ETFs / Indices:
U.S. stocks finished lower as the 10-year Treasury yield moved above 5%, with the Dow down 352.10 points, or 0.68%. Hot services data, firmer crude prices, and higher yields weighed on technology shares. Market breadth remained narrow, with a small group of stocks carrying the S&P 500 near record territory.
Geopolitical:
Trump indicated that multiple deals were in focus for his summit with China’s Xi Jinping. Iran’s president stated that freedom of navigation through the Strait of Hormuz would not be allowed amid sanctions and a U.S. blockade.
Oil / Energy:
WTI and Brent rebounded as traders focused on a global diesel shortage after a multi-day decline. U.S. diesel futures fell 4% after a report of a proposed 90-day export ban, though the White House denied the report; refiners fell amid concerns that restrictions would raise domestic fuel prices. Senators also urged release of emergency heating-oil supplies as diesel prices reached records.
Gold / Metals:
Gold struggled around $4,300 as a stronger dollar and elevated yields pressured prices, with $4,270 cited as another technical support level. Separate bank research cited strong central-bank and Chinese sovereign demand, while maintaining bullish longer-term price targets.
Fed / Financials:
The 10-year Treasury yield reached 5.14%, its highest intraday level since 2007 and a 19-year high, amid a broad bond selloff. Strong PMI data and the hottest inflation reading in nearly four years pushed market pricing for an October Fed hike above 70%, while markets also priced two additional 2026 hikes. Treasury maintained a $6 billion cap on long-term bond buybacks.
Macro / Other:
Strong PMI readings pointed to rapid business growth and reinforced the higher-rate repricing. Bitcoin faced near-term pressure from a more hawkish Fed and delays to the CLARITY Act, despite its positive quarter-to-date performance.
Conclusion:
Higher Treasury yields and stronger inflation and activity data were the central market drivers. Fed-hike pricing intensified as the 10-year yield rose above 5%.
Equity weakness concentrated around rate-sensitive areas, while narrow market leadership remained a concern. Diesel-policy headlines, elevated fuel prices, gold’s yield sensitivity, and U.S.-China and Hormuz developments added cross-currents.
Market News Sentiment
Market News Articles: 37
- Neutral: 48.65%
- Positive: 29.73%
- Negative: 21.62%
Sentiment Summary: Of 37 market news articles, 49% were neutral, 30% positive, and 22% negative, indicating predominantly balanced coverage with a modest positive tilt.
Conclusion: Indices futures news flow was primarily neutral, with positive articles exceeding negative articles.
GLD,Gold Articles: 12
- Positive: 50.00%
- Negative: 41.67%
- Neutral: 8.33%
Sentiment Summary: GLD/Gold coverage is mixed, with 50% positive, 42% negative, and 8% neutral articles across 12 articles.
Conclusion: Gold-related sentiment is slightly positive but remains closely balanced, indicating no clear directional consensus for indices futures day traders.
USO,Oil Articles: 15
- Negative: 60.00%
- Neutral: 26.67%
- Positive: 13.33%
Sentiment Summary: USO and oil coverage was predominantly negative, with 60% negative, 27% neutral, and 13% positive articles.
Conclusion: The oil news tone was negative overall, indicating a potential risk-sensitive input for indices futures day traders.
Market Data Snapshot
ETF Snapshot of major stock market ETFs, Mag7, and others as of: September 23, 2026 05:00
Top Movers & Losers
- USO 148.83 Bullish 3.30% ▲
- META 744.10 Bullish 1.02% ▲
- MSFT 500.59 Bullish 0.52% ▲
- IBIT 47.88 Bearish -1.95% ▼
- AMZN 249.27 Bearish -2.24% ▼
- GOOG 334.98 Bearish -3.58% ▼
Major Index ETFs: SPY, QQQ, DIA, IWM, IJH
- IJH 73.03 Bearish -0.60% ▼
- DIA 514.30 Bearish -0.71% ▼
- SPY 767.81 Bearish -0.72% ▼
- QQQ 741.21 Bearish -0.84% ▼
- IWM 281.92 Bearish -1.84% ▼
Major index ETFs were Bearish across the group: IWM led losses at -1.84%, followed by QQQ at -0.84%, SPY at -0.72%, DIA at -0.71%, and IJH as the least negative mover at -0.60%.
Mag 7 Stocks: AAPL, MSFT, GOOG, AMZN, META, NVDA, TSLA
- META 744.10 Bullish 1.02% ▲
- MSFT 500.59 Bullish 0.52% ▲
- TSLA 380.12 Bullish 0.32% ▲
- AAPL 337.02 Bearish -0.80% ▼
- NVDA 225.51 Bearish -1.47% ▼
- AMZN 249.27 Bearish -2.24% ▼
- GOOG 334.98 Bearish -3.58% ▼
Mixed: META was the most bullish mover at +1.02%, followed by MSFT at +0.52% and TSLA at +0.32%. GOOG was the most bearish mover at -3.58%, with AMZN down -2.24% and NVDA down -1.47%; AAPL declined -0.80%.
Cross-Market ETFs: TLT, GLD, USO, IBIT
- USO 148.83 Bullish 3.30% ▲
- TLT 80.46 Bearish -1.58% ▼
- GLD 392.88 Bearish -1.80% ▼
- IBIT 47.88 Bearish -1.95% ▼
Other ETFs are Mixed: USO is the most bullish mover at +3.30%, while IBIT is the most bearish mover at -1.95%. GLD declined -1.80% and TLT fell -1.58%.
ETF, Mag7, and Cross-Market ETF Insights
Overall Tone
Mixed but broadly Bearish, as major equity ETFs declined while selective Mag7 strength and a sharp USO advance provided limited Bullish offsets.
Equity ETFs and Mag7:
Major Index ETFs were broadly Bearish: SPY -0.72%, QQQ -0.84%, DIA -0.71%, IJH -0.60%, and IWM -1.84%, with small caps leading the downside. Mag7 action was selective, with META the most bullish mover at +1.02%, followed by MSFT +0.52% and TSLA +0.32%, while GOOG was the most bearish mover at -3.58%, followed by AMZN -2.24%, NVDA -1.47%, and AAPL -0.80%. Equities were Mixed rather than broadly aligned, with index weakness alongside concentrated Bullish leadership.
Cross-Market ETFs:
USO was the most bullish cross-market mover at +3.30%, diverging sharply from Bearish TLT -1.58%, GLD -1.80%, and IBIT -1.95%. IBIT was the most bearish mover, while TLT was the least negative mover among the Bearish cross-market ETFs. The group was Mixed, with commodity strength contrasted by declines in bonds, gold, and bitcoin exposure.
Futures Indices – Higher Time Frame Analysis
Summary of the current state of US Indices Futures based on higher time-frame (HTF) technical analysis as of: 2026-09-23: 17:00 CT.
US Indices Futures
- ES YSFG/MSFG/WSFG bullish, benchmarks rising, UTrend pivots, resistance 7848.50-7850.25/7906.25, support 7575-7556.25.
- NQ YSFG/MSFG/WSFG bullish, all benchmarks rising, UTrend pivots, resistance 31094.75-31389.25, support 30230.75/29633.00.
- YM YSFG bullish, MSFG bearish, short benchmarks mixed, recovery pivots, resistance 53544/54259-54294/55316, support 51809/51609.
- EMD YSFG and WSFG bullish, MSFG bearish, short benchmarks declining, DTrend pivots, resistance 3704.5-3825.3, support 3636.2/3617.1.
- RTY YSFG and WSFG bullish, MSFG bearish, mixed benchmarks, daily UTrend versus weekly DTrend, resistance 2931.2/3005.2, support 2850-2852.
- FDAX YSFG and WSFG bullish, MSFG bearish, short benchmarks declining, mixed pivots, resistance 25990-26027/26847, support 25444/25362.
Overall State
- Short-Term: Bullish
- Intermediate-Term: Neutral
- Long-Term: Bullish
Conclusion
ES and NQ maintain aligned bullish YSFG, MSFG, WSFG, pivot, and benchmark structures while testing swing-high resistance. YM, EMD, RTY, and FDAX retain bullish yearly structures but show MSFG weakness and intermediate corrective conditions. EMD and RTY are testing nearby pivot support; FDAX remains below short-term benchmarks. Long-term benchmark alignment remains broadly upward across all contracts.
Note: Intra-day counter-trend pullbacks or retracements may occur, HTF is context for informational usage and market structure. Glossary: Session Fib Grids periods of YSFG:’Yearly’, MSFG:’Monthly’, WSFG:’Weekly’
For full details visit: AlphaWebTrader Technicals
ES Daily View
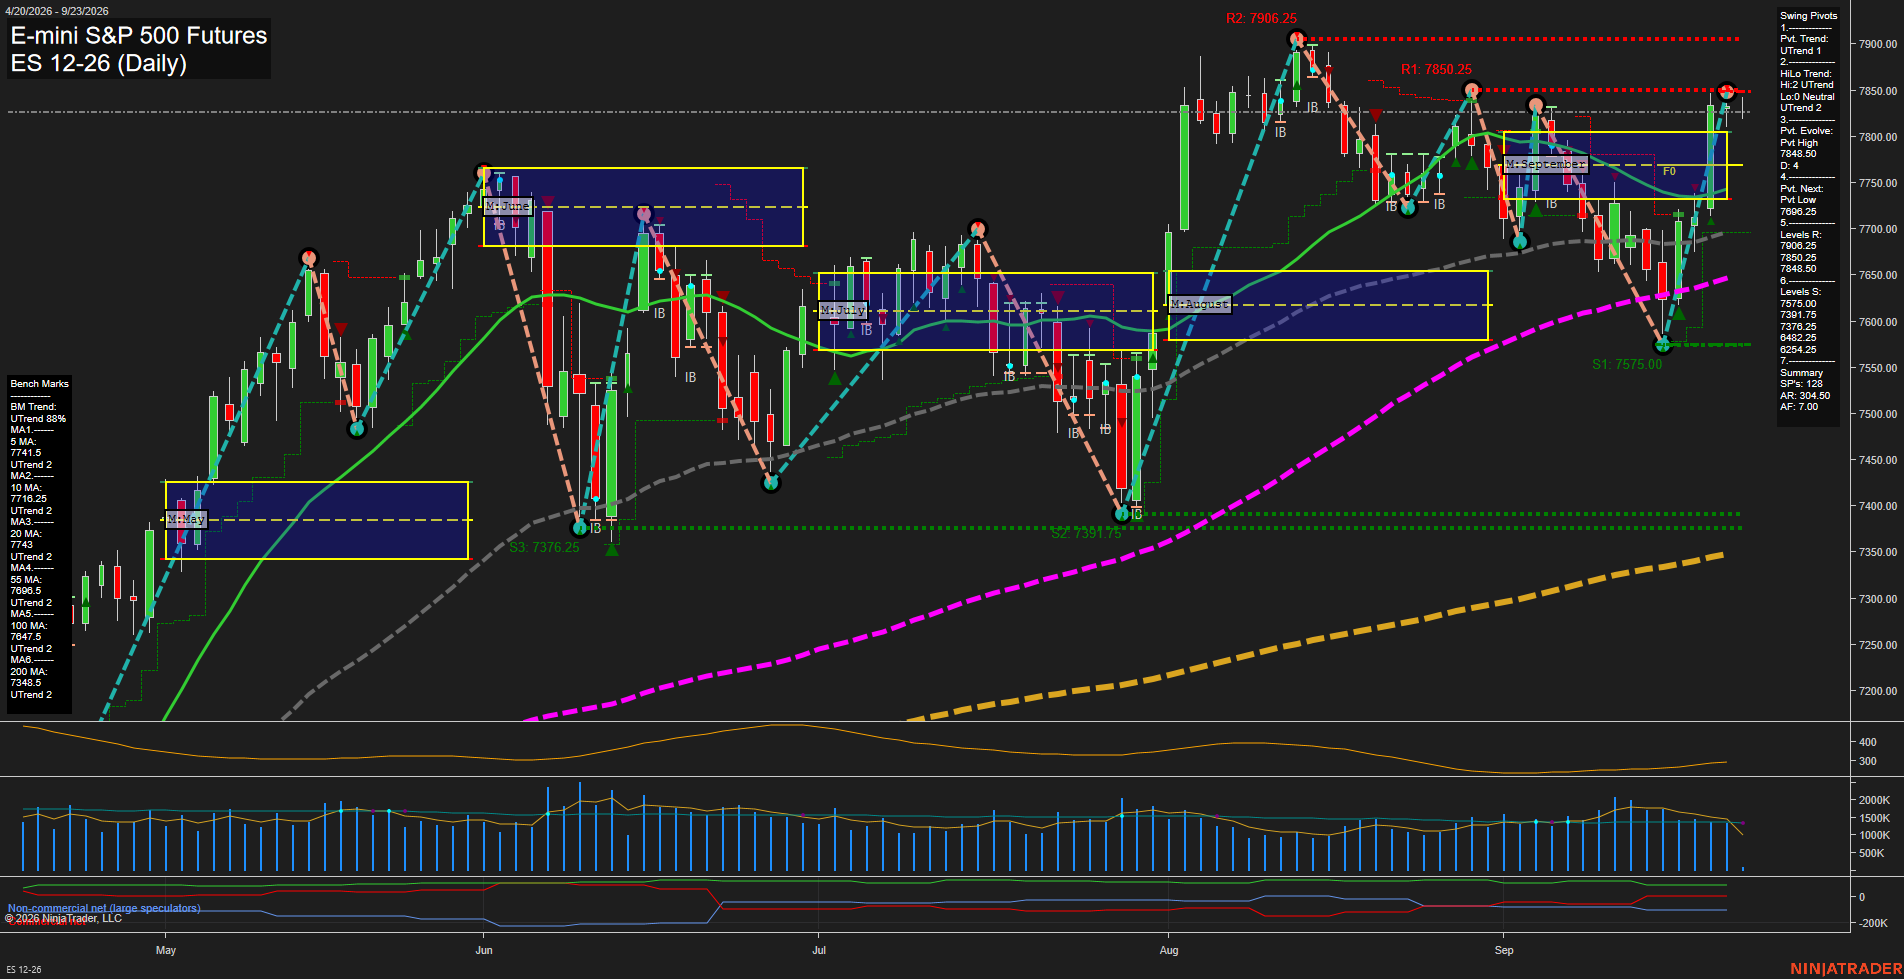
Overall Rating
- Short-Term: Bullish
- Intermediate-Term: Bullish
- Long-Term: Bullish.
Key Insights Summary
ES has staged a sharp V-style recovery from the 7575 swing-low area and is trading above all six rising daily benchmarks. Short-term momentum is fast as price approaches the clustered 7848.50 to 7850.25 pivot-resistance zone; 7906.25 is the next higher resistance reference. Both pivot-trend measures remain in UTrend, while the monthly and yearly Fib-grid structure remains positive. The recent long-direction signals align across short-, intermediate-, and long-term models, with the market structure characterized by higher lows and a renewed test of the prior swing-high region.
View charts on: AlphaWebTrader HTF Charts
NQ Daily View
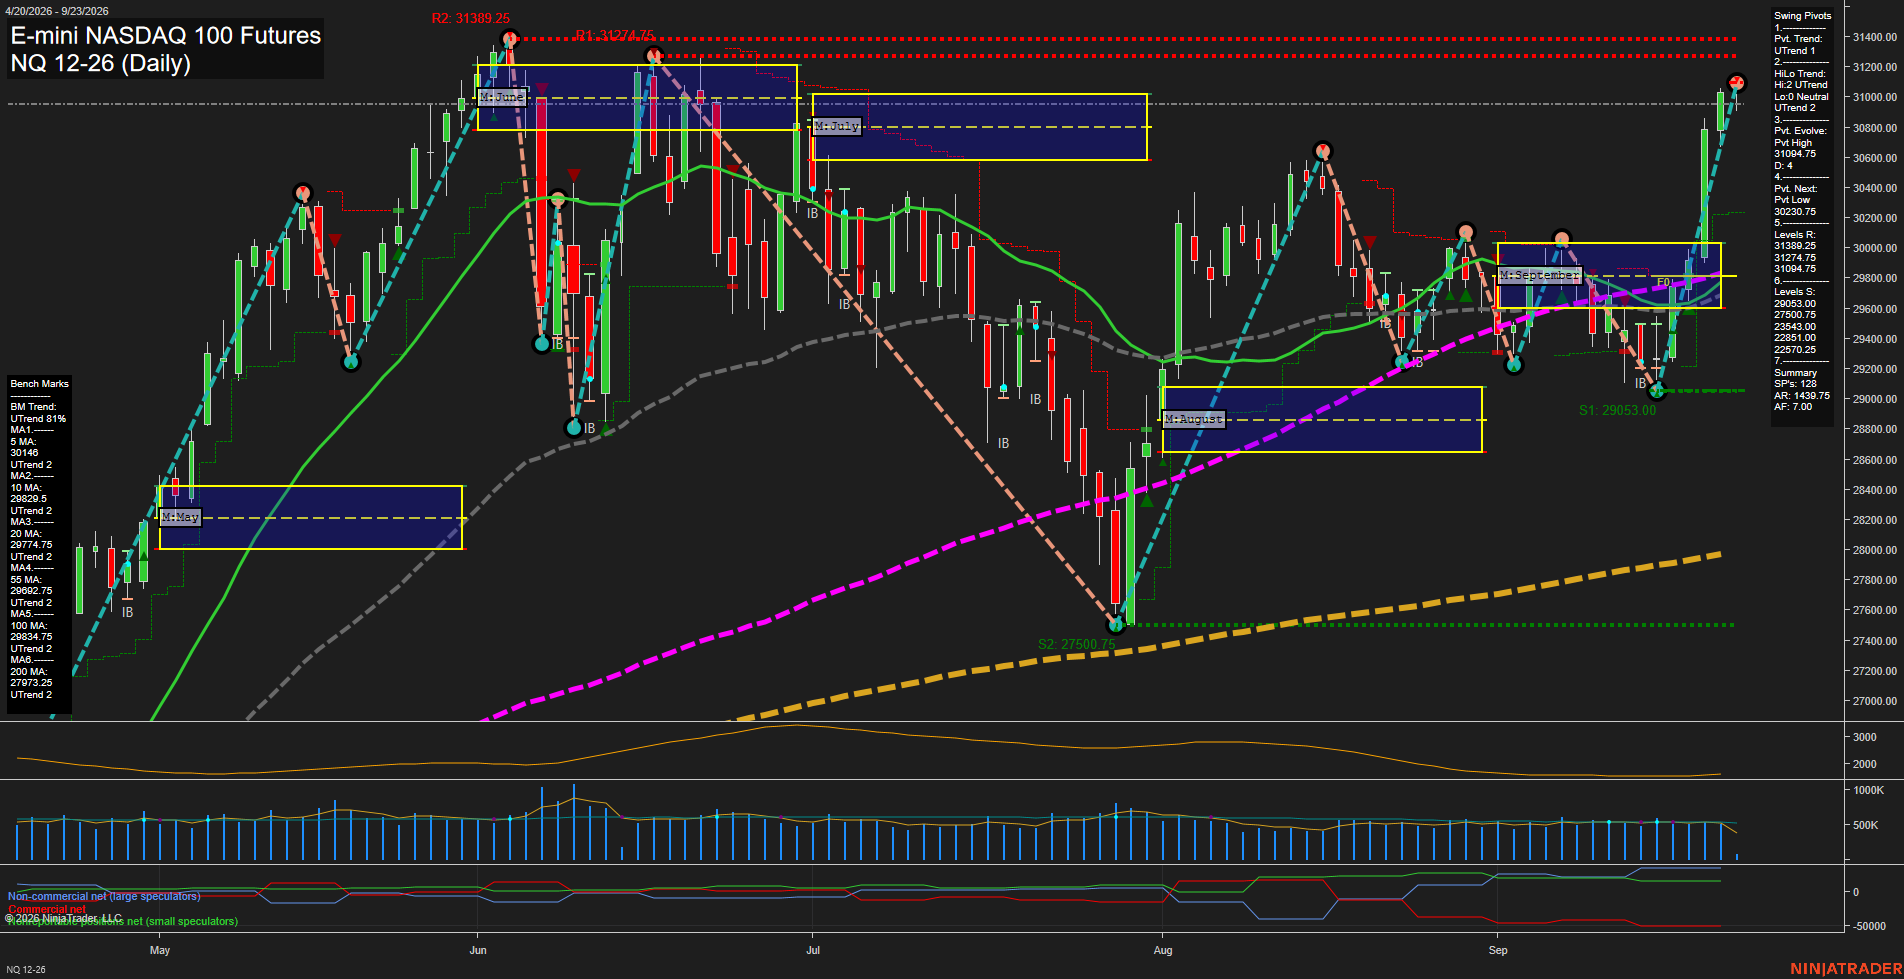
Overall Rating
- Short-Term: Bullish
- Intermediate-Term: Bullish
- Long-Term: Bullish.
Key Insights Summary
Price has produced a sharp V-recovery from the September pivot low and expanded above the monthly F0% area, with large bullish daily bars carrying momentum into the 31094.75 pivot-high area. Short-term and intermediate pivot structures are both in UTrend, while price is above every benchmark average and all six averages are rising. The immediate swing structure is pressing clustered resistance at 31094.75, 31274.75, and 31389.25; 30230.75 is the next pivot-reversal reference, with the 29633.00 area representing deeper structural support. The rally is technically broad-based but fast, reflecting elevated directional range expansion rather than a quiet consolidation.
View charts on: AlphaWebTrader HTF Charts
CL Daily View
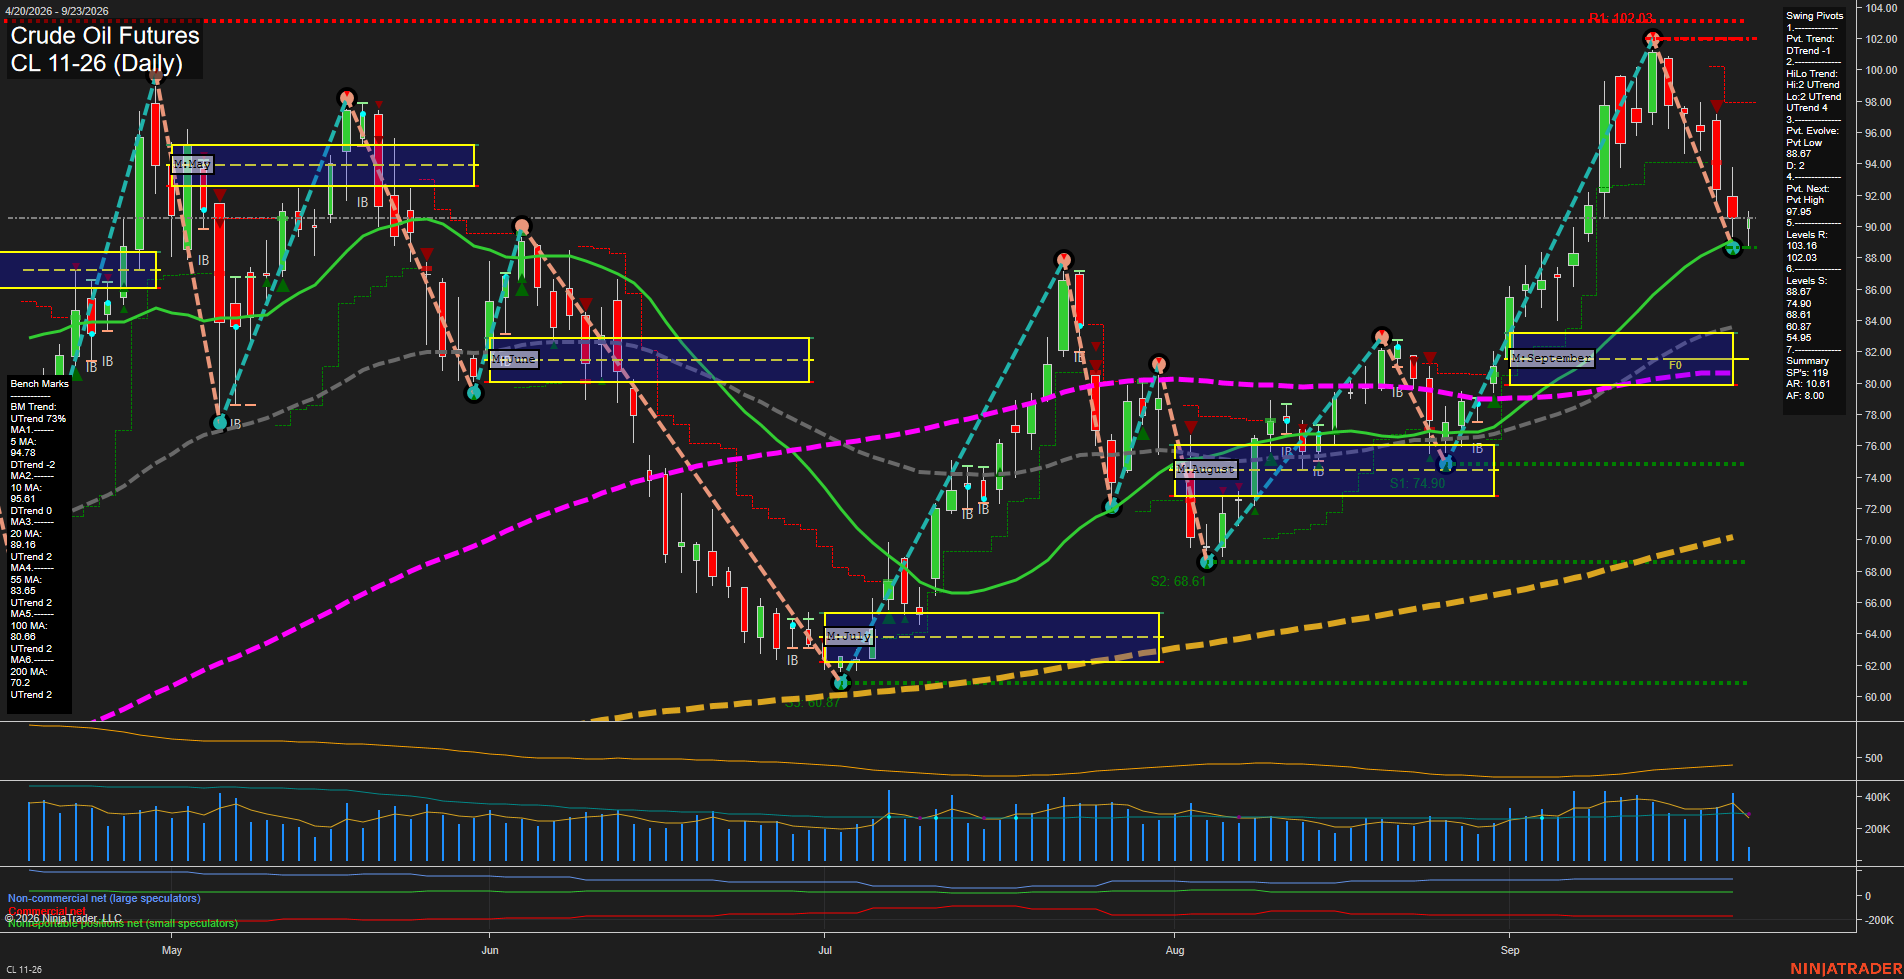
Overall Rating
- Short-Term: Bearish
- Intermediate-Term: Bullish
- Long-Term: Bullish.
Key Insights Summary
Price has undergone a fast, large-bar retracement from the 102.03 pivot-high resistance area, shifting the short-term pivot structure into DTrend and placing price below declining 5- and 10-day benchmarks. The 88.67 pivot-low support and nearly coincident rising 20-day average at 89.16 define the immediate technical inflection area. Intermediate and long-term structure remains constructive: the HiLo trend is UTrend, price remains above the monthly F0% region, and the 20-, 55-, 100-, and 200-day benchmarks retain upward trends. The current pattern is a sharp countertrend pullback within the broader advance, with 91.16 as nearby resistance and 97.95-102.03 marking the upper recovery and prior-high zone.
View charts on: AlphaWebTrader HTF Charts
GC Daily View
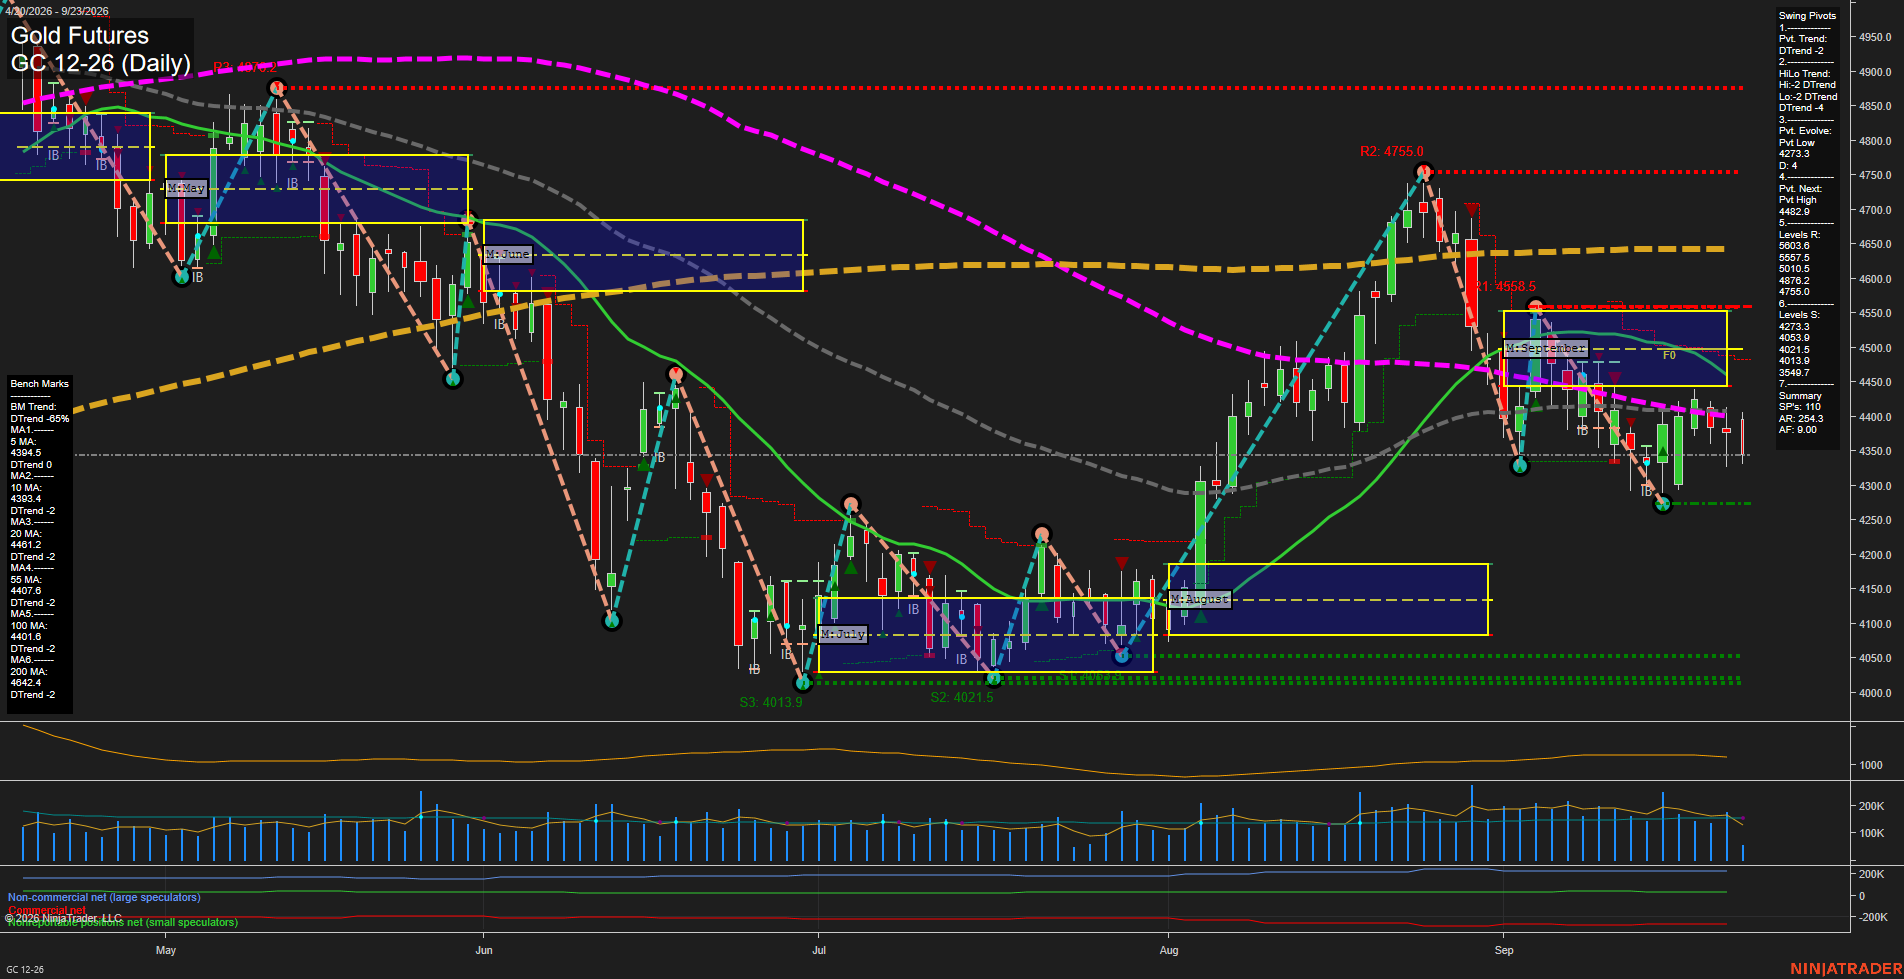
Overall Rating
- Short-Term: Bearish
- Intermediate-Term: Bearish
- Long-Term: Bearish.
Key Insights Summary
Gold remains in a broad bearish swing structure: price is below every benchmark average, both pivot trends are down, and the weekly, monthly, and yearly Fib-grid readings remain below their F0% levels. The late-August rally to 4755.0 was rejected sharply, creating a lower-high sequence followed by a decline toward the 4273.3 pivot-low area. Recent candles show a smaller-range consolidation near 4350 after the selloff, indicating slower downside momentum rather than a confirmed trend reversal. The 4393-4408 moving-average cluster and 4482.9 next-pivot level define the principal overhead resistance zone, while 4273.3 is the nearest swing support within the current declining structure.
View charts on: AlphaWebTrader HTF Charts
ZB Daily View
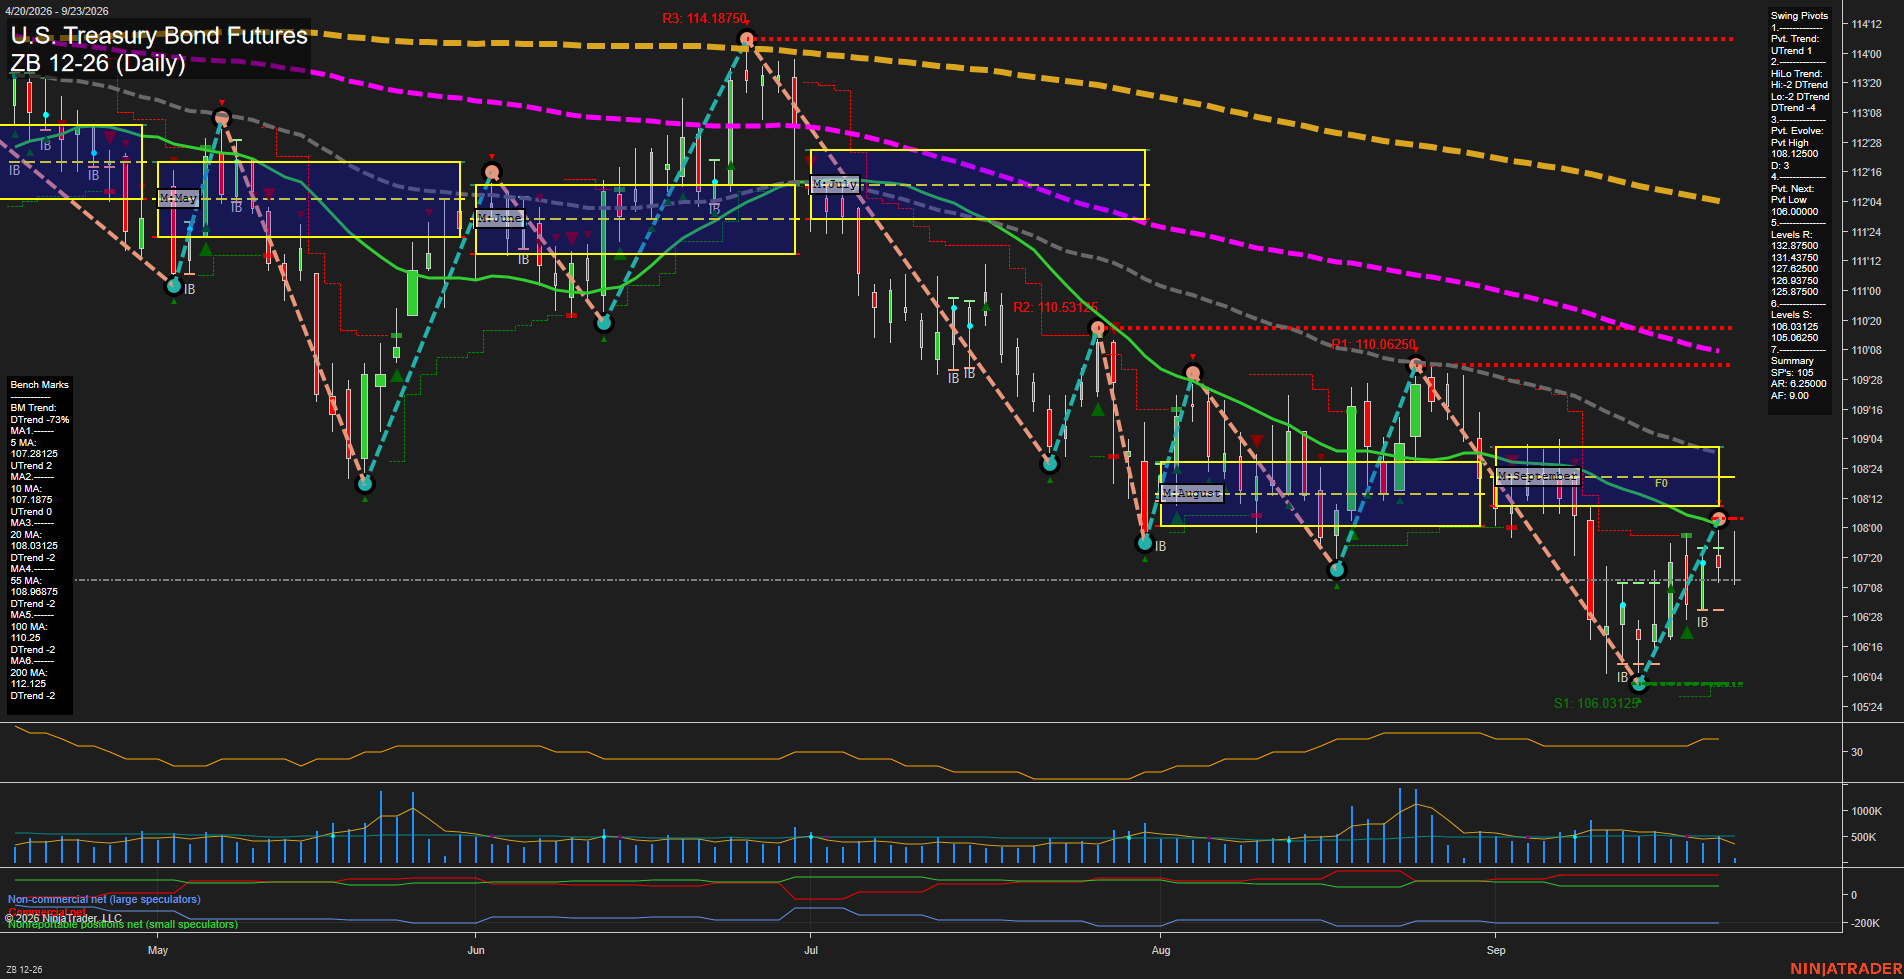
Overall Rating
- Short-Term: Bullish
- Intermediate-Term: Bearish
- Long-Term: Bearish.
Key Insights Summary
The daily structure shows a short-term recovery from the 106.00000 pivot-low area, confirmed by the UTrend pivot state and rising 5-day and 10-day benchmarks. This rebound remains countertrend within a broader intermediate and long-term decline: price is below the September MSFG F0%/NTZ area and below the declining 20-, 55-, 100-, and 200-day benchmarks. The current swing is characterized by a rebound followed by consolidation near 107-08, with 108.03125 and the monthly grid area defining the nearest intermediate-term overhead technical zone, while 106.03125 and 105.06250 remain the principal downside swing-support references.
View charts on: AlphaWebTrader HTF Charts