Pre-market futures review finds ES and NQ in bullish technical setups, while oil above $100, weak breadth and tighter credit add near-term caution.
Fundamentals: Pre-market sentiment is cautiously constructive as AI-linked technology strength and shifting hopes for U.S.-Iran diplomacy support risk appetite. Brent crude remains above $100 a barrel, keeping inflation and Middle East supply concerns in focus. Near-record U.S. index levels contrast with weak market breadth, widening credit spreads and scrutiny of a $69 billion Treasury auction.
Technicals: Pre-market technical readings show broad strength in S&P 500 and Nasdaq futures after sharp recoveries, with both markets above key averages and nearing resistance. Dow, Russell 2000 and EMD futures retain mixed short-term conditions, while FDAX is rebounding within a corrective phase. META, IBIT and TSLA led prior-session movers.
Pre-Market Trading 360° view Market Radar of: holidays, earnings, eco-news, market-news summary, news sentiment, prior session major ETFs, MAG7, Higher Time Frame Analysis Indices Futures Summary, and E-mini S&P500, Nasdaq 100, NYMEX Crude, Gold Futures Daily Chart analysis.
As of: September 22, 2026 07:16 CT
EcoNews Radar U.S. Events
| Day | Time | Impact | Event |
|---|---|---|---|
| Wed | 10:30 | Low | Crude Oil Inventories |
| Thu | 08:30 | Medium | Unemployment Claims |
| Fri | 10:00 | Medium | Revised UoM Consumer Sentiment |
| Fri | 10:00 | Medium | Revised UoM Inflation Expectations |
EcoNews Summary
No qualifying high-impact EcoNews events are listed. The week’s listed energy-related release is USD Crude Oil Inventories, which provides a supply snapshot for the petroleum market.
Event Notes:
- Wednesday 10:30 USD Crude Oil Inventories: Reports the weekly change in U.S. crude-oil stockpiles, reflecting petroleum supply conditions and influencing energy-price sensitivity.
Conclusion:
Wednesday at 10:30, USD Crude Oil Inventories, is the single most important listed event because it directly relates to petroleum supply. High oil prices directly affect markets through inflation and geopolitical concerns.
For full details visit: Forex Factory EcoNews
Market News Summary:
Equity sentiment is supported by AI and diplomatic optimism, while rising oil, thin market breadth, and tighter financial conditions temper the backdrop.
Primary Drivers & Risks:
- Primary Driver: AI-led technology strength
- Primary Risk: Oil-driven inflation and credit stress
Tone:
Cautiously constructive, with widening cross-currents.
Stock Market / ETFs / Indices:
Asian equities rose with Wall Street gains, while the Nikkei and Kospi were identified as vulnerable to sharp short-covering rallies. U.S. futures were mixed to slightly flat after an AI-led advance, supported by Meta’s new AI assistant and strong technology-related corporate results. The S&P 500 traded within 1% of its record high, but more constituents posted 52-week lows than highs, indicating weak breadth. European technology gains lost momentum as oil moved back into focus.
Geopolitical:
Markets are focused on Trump-Xi summit developments and on diplomacy surrounding the U.S.-Iran conflict. Hopes for U.S.-Iran talks supported risk appetite at points, while fading optimism and U.S. action targeting Iranian airlines revived tension concerns.
Oil / Energy:
Brent held above $100 a barrel as crude rebounded after several days of declines. Prices reacted to shifting expectations for U.S.-Iran talks, Iranian airline restrictions, and Middle East supply concerns; Saudi export recovery and possible diplomacy eased some supply fears, while Qatar LNG disruptions kept gas markets tight. Persistent regional disruption was cited as a pathway to substantially tighter crude supplies, and higher oil prices were linked to renewed inflation pressure.
Gold / Metals:
Gold rose in early Asian trading, supported by longer-term fundamentals. Basic materials had outperformed in 2026, though macro headwinds were cited as a constraint on momentum.
Fed / Financials:
A $69 billion two-year Treasury auction faced potential headwinds and possible concessions. Financial conditions were tightening as global credit spreads widened, raising valuation concerns for equities. Oil-rate correlation reached a 35-year high, increasing the relevance of energy moves for rates markets.
Macro / Other:
Asian currencies were mixed against the dollar, with U.S.-Iran diplomacy influencing risk appetite. India’s National Stock Exchange IPO drew bids exceeding $10 billion for a $2.3 billion offering, reflecting strong institutional and high-net-worth demand.
Conclusion:
AI-related technology strength and diplomatic optimism underpin equity sentiment. Oil’s rebound and Middle East developments are central near-term market inputs.
Weak index breadth, tighter credit conditions, and Treasury auction pressure add caution beneath near-record index levels. Energy-driven inflation concerns and elevated oil-rate linkage broaden the cross-asset risk backdrop.
Market News Sentiment
Market News Articles: 45
- Neutral: 55.56%
- Positive: 24.44%
- Negative: 20.00%
Sentiment Summary: Among 45 market news articles, sentiment was 56% neutral, 24% positive, and 20% negative, indicating predominantly balanced news flow.
Conclusion: Indices futures day traders face a neutral overall news tone, with positive coverage modestly exceeding negative coverage.
GLD,Gold Articles: 8
- Positive: 37.50%
- Neutral: 37.50%
- Negative: 25.00%
Sentiment Summary: Gold coverage is mixed, with 38% positive, 38% neutral, and 25% negative sentiment across 8 articles.
Conclusion: The gold news tone is balanced overall, with positive and neutral coverage equally represented.
USO,Oil Articles: 14
- Negative: 42.86%
- Positive: 35.71%
- Neutral: 21.43%
Sentiment Summary: USO and oil coverage is mixed with a negative tilt: 43% negative, 36% positive, and 21% neutral across 14 articles.
Conclusion: For indices futures day traders, oil-related news tone is modestly negative overall, with substantial positive and neutral coverage indicating no uniform sentiment direction.
Market Data Snapshot
ETF Snapshot of major stock market ETFs, Mag7, and others as of: September 22, 2026 07:16
Top Movers & Losers
- META 741.25 Bullish 11.34% ▲
- IBIT 49.01 Bullish 6.50% ▲
- TSLA 375.30 Bullish 3.03% ▲
- IJH 73.25 Bullish 0.37% ▲
- GLD 398.38 Bearish -0.70% ▼
- USO 148.16 Bearish -3.68% ▼
Major Index ETFs: SPY, QQQ, DIA, IWM, IJH
- QQQ 741.47 Bullish 2.77% ▲
- SPY 773.50 Bullish 1.55% ▲
- DIA 519.78 Bullish 0.76% ▲
- IWM 285.58 Bullish 0.52% ▲
- IJH 73.25 Bullish 0.37% ▲
All major index ETFs are Bullish. QQQ is the most bullish mover at +2.77%, followed by SPY at +1.55%. DIA gained +0.76%, while IWM rose +0.52%. IJH is the least positive mover at +0.37%.
Mag 7 Stocks: AAPL, MSFT, GOOG, AMZN, META, NVDA, TSLA
- META 741.25 Bullish 11.34% ▲
- TSLA 375.30 Bullish 3.03% ▲
- NVDA 227.38 Bullish 2.30% ▲
- GOOG 350.87 Bullish 1.88% ▲
- AMZN 258.45 Bullish 1.87% ▲
- MSFT 501.61 Bullish 1.59% ▲
- AAPL 338.98 Bullish 0.85% ▲
Mag7 is Bullish across the group, led by META at +11.34%. TSLA +3.03% and NVDA +2.30% follow, while GOOG +1.88%, AMZN +1.87%, and MSFT +1.59% add broad support. AAPL is the least positive mover at +0.85%.
Cross-Market ETFs: TLT, GLD, USO, IBIT
- IBIT 49.01 Bullish 6.50% ▲
- TLT 81.80 Bullish 0.68% ▲
- GLD 398.38 Bearish -0.70% ▼
- USO 148.16 Bearish -3.68% ▼
Cross-market conditions are Mixed: IBIT is the most bullish mover at +6.50%, while USO is the most bearish mover at -3.68%. TLT is Bullish at +0.68%, and GLD is Bearish at -0.70%.
ETF, Mag7, and Cross-Market ETF Insights
Overall Tone
Bullish overall tone, led by broad equity gains and strong IBIT participation, while GLD and USO were Bearish.
Equity ETFs and Mag7:
Major Index ETFs were broadly Bullish: QQQ gained +2.77%, SPY rose +1.55%, DIA added +0.76%, IWM increased +0.52%, and IJH was the least positive equity mover at +0.37%. Mag7 leadership was concentrated in META, the most bullish equity mover at +11.34%, followed by TSLA +3.03%, NVDA +2.30%, GOOG +1.88%, AMZN +1.87%, MSFT +1.59%, and AAPL +0.85%. Equities were broadly aligned Bullish, with technology and META showing the strongest leadership.
Cross-Market ETFs:
Cross-market ETFs were Mixed: IBIT was the most bullish mover at +6.50%, while TLT rose +0.68%. GLD was Bearish at -0.70%, and USO was the most bearish mover at -3.68%. The strength in IBIT and TLT diverged from Bearish gold and oil performance.
Futures Indices – Higher Time Frame Analysis
Summary of the current state of US Indices Futures based on higher time-frame (HTF) technical analysis as of: 2026-09-22: 07:16 CT.
US Indices Futures
- ES: YSFG/MSFG/WSFG upward, above benchmarks, UTrend pivots; resistance 7847.25-7906.25, support/reversal 7556.25.
- NQ: YSFG/MSFG/WSFG upward, above rising benchmarks, pivots advancing; resistance 30916.50-31389.25, support 30079.50 then 28459.00.
- YM: YSFG/WSFG upward, MSFG below F0%; below short benchmarks and DTrend daily pivots; resistance 52747-53957, support 51609-51689.
- EMD: YSFG/WSFG upward, MSFG below F0%; below key short/intermediate benchmarks, DTrend pivots; resistance 3725.2-3896.8, support 3617.1-3638.2.
- RTY: YSFG upward, MSFG below F0%, WSFG constructive; below declining benchmarks and down pivots; resistance 2927.1-3017.5, support 2851.9.
- FDAX: YSFG upward, MSFG mixed/below F0%, WSFG corrective; short-term rebound above benchmarks, resistance 25990-26847, support 25362.
Overall State
- Short-Term: Neutral
- Intermediate-Term: Neutral
- Long-Term: Bullish
Conclusion
ES and NQ retain aligned bullish YSFG, MSFG, WSFG, benchmark, and pivot structures, with price near upper swing resistance. YM, EMD, and RTY remain in corrective phases, with MSFG below F0% and declining intermediate benchmarks. FDAX has a short-term recovery within an intermediate corrective structure. Broad long-term alignment remains bullish through rising yearly grids and longer-period benchmarks, while directional correlation is mixed across short and intermediate horizons.
Note: Intra-day counter-trend pullbacks or retracements may occur, HTF is context for informational usage and market structure. Glossary: Session Fib Grids periods of YSFG:’Yearly’, MSFG:’Monthly’, WSFG:’Weekly’
For full details visit: AlphaWebTrader Technicals
ES Daily View
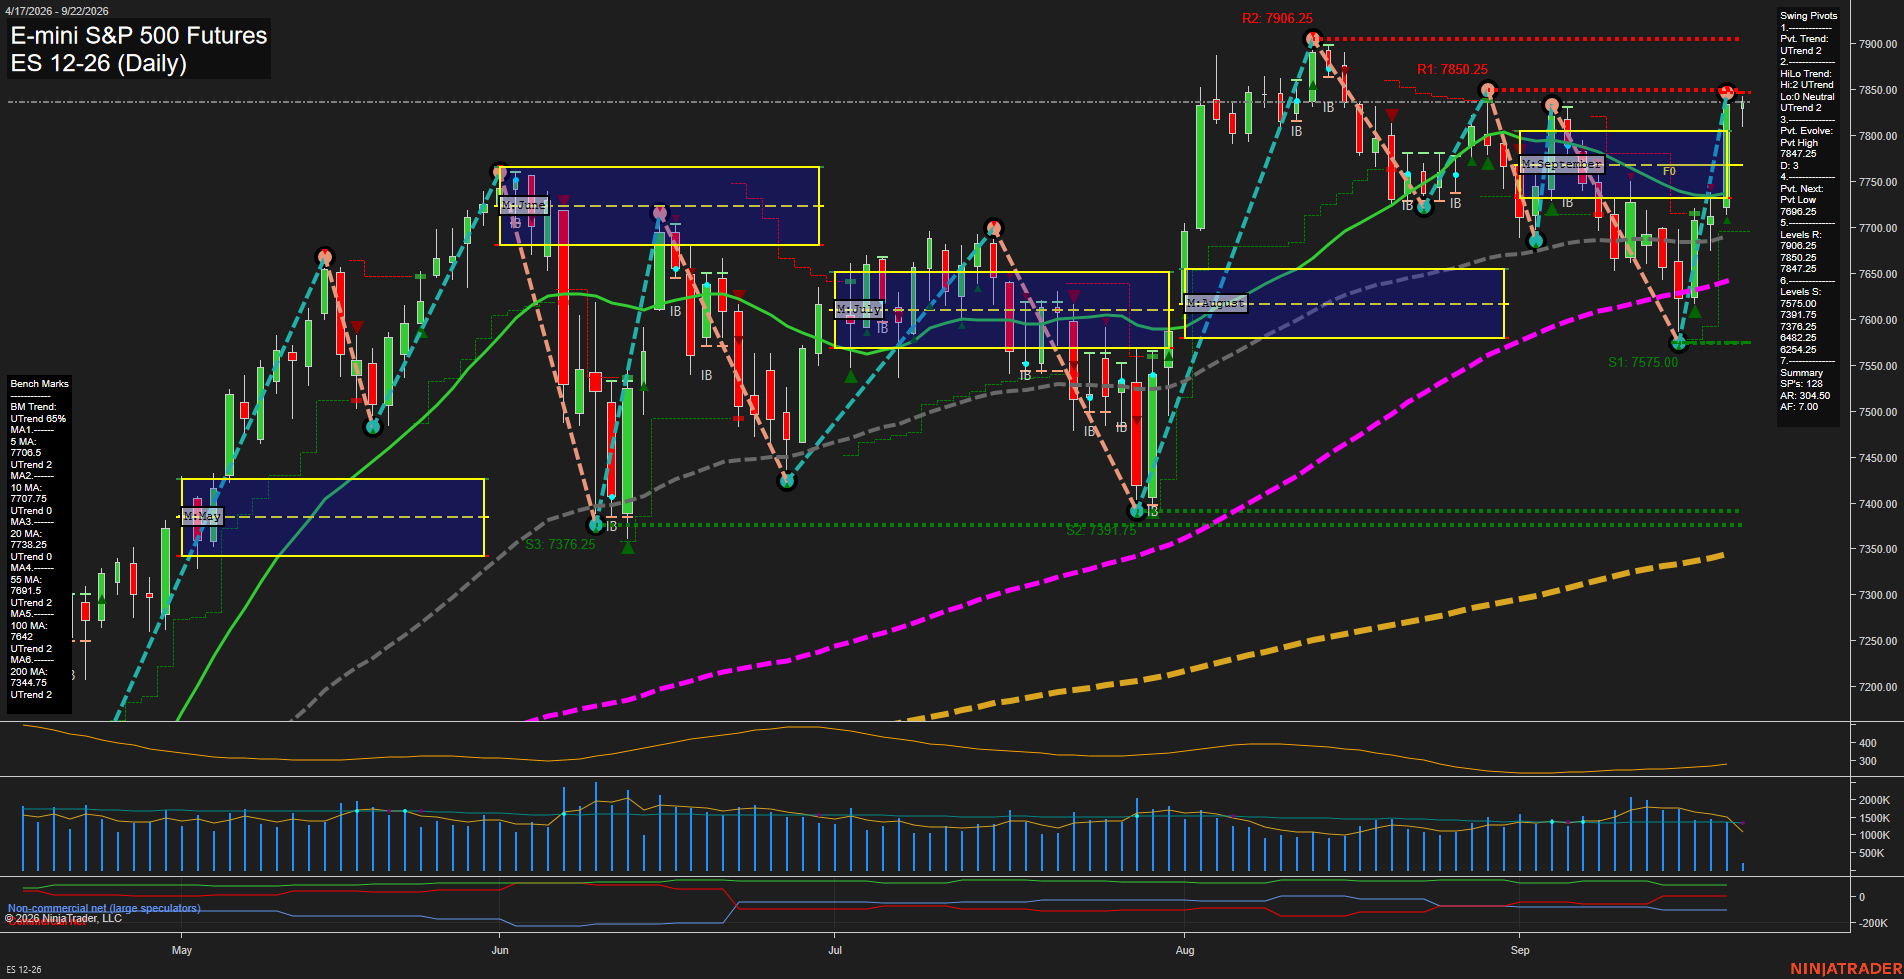
Overall Rating
- Short-Term: Bullish
- Intermediate-Term: Bullish
- Long-Term: Bullish.
Key Insights Summary
The daily structure reflects a sharp V-shaped recovery from the 7391.75-7376.25 support cluster, with large-range upside bars carrying ES back above all benchmark averages and above both weekly and monthly F0% levels. Short-term momentum is fast and the active pivot sequence remains upward, although price is testing the 7847.25-7850.25 resistance area beneath the 7906.25 swing-high level. Intermediate and long-term conditions remain aligned higher through rising pivot structure, positive MSFG and YSFG positioning, and broad moving-average separation.
View charts on: AlphaWebTrader HTF Charts
NQ Daily View
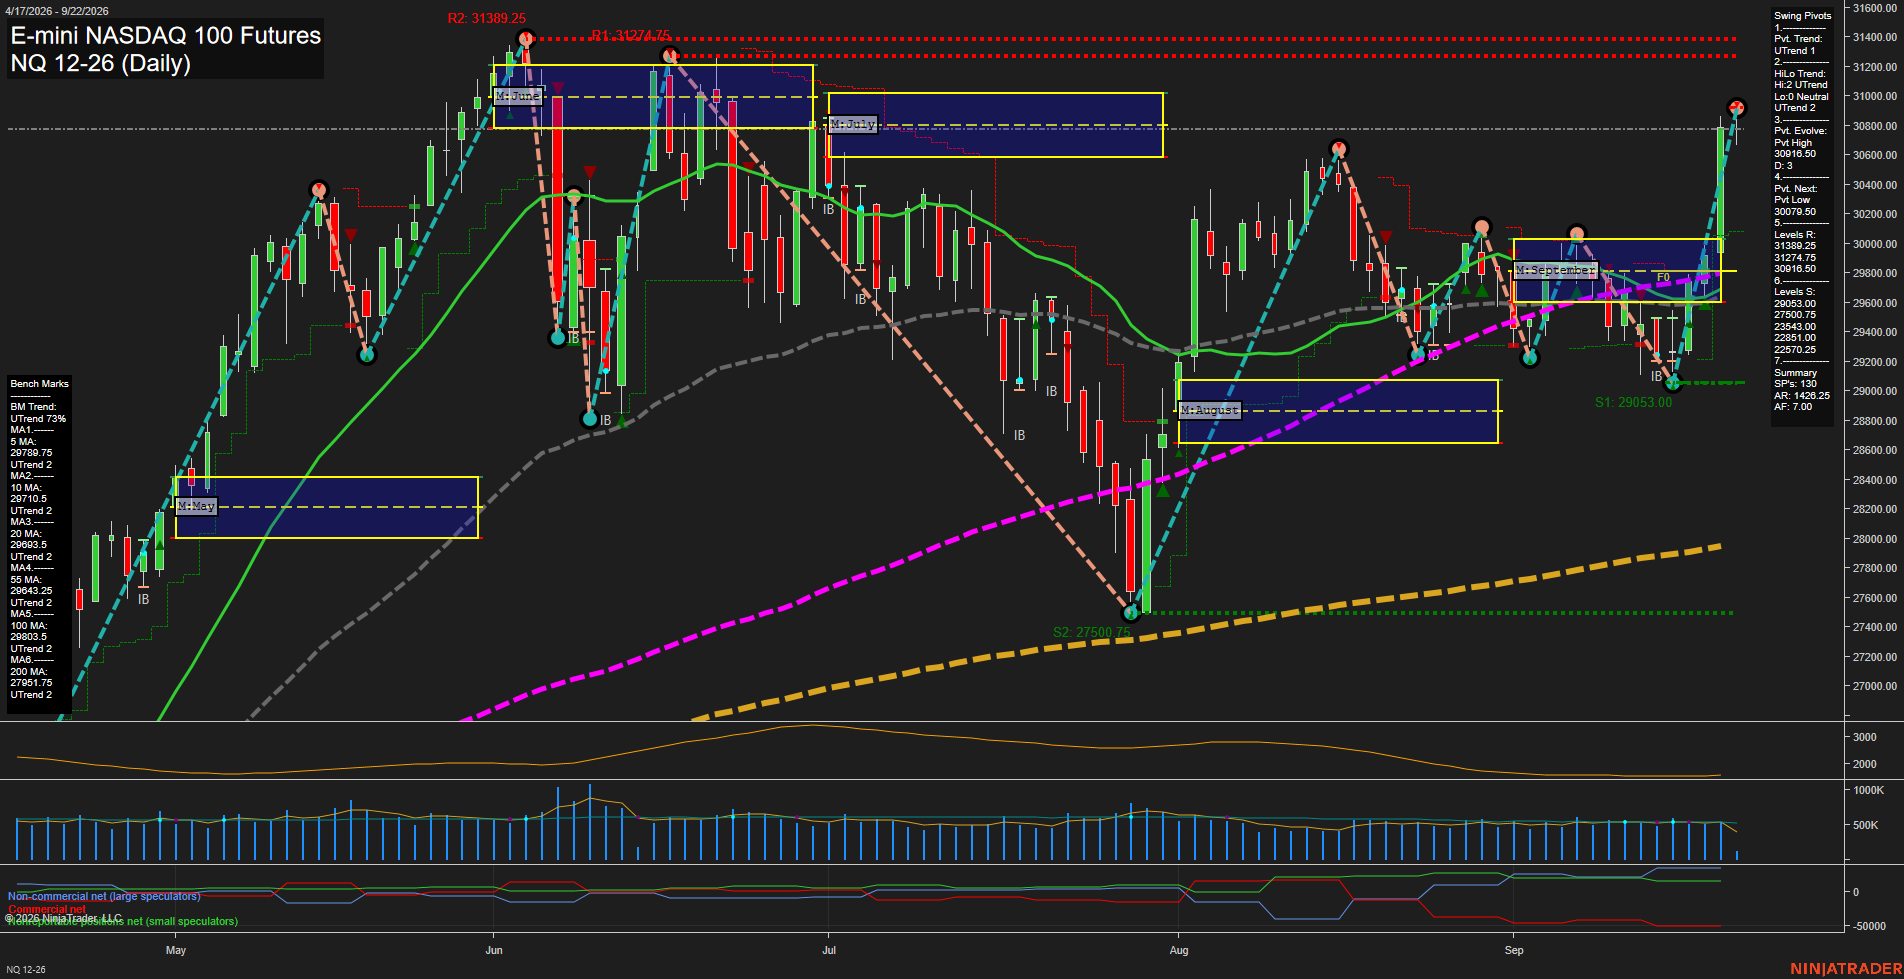
Overall Rating
- Short-Term: Bullish
- Intermediate-Term: Bullish
- Long-Term: Bullish.
Key Insights Summary
Price action has produced a sharp upside continuation from the September pullback, with large-range bars and fast momentum lifting NQ above the weekly and monthly fib-grid centers. The pivot structure remains aligned upward across short- and intermediate-term horizons, while price is positioned above all benchmark averages. The 30916.50 pivot high is the immediate reference point beneath the higher resistance cluster at 31274.75 to 31389.25; 30079.50 is the active opposite-pivot level, with 29053.00 the larger swing-support reference. Elevated ATR reflects a high-volatility advance rather than a quiet consolidation, and recent long signals remain aligned across short-, intermediate-, and long-term systems.
View charts on: AlphaWebTrader HTF Charts
CL Daily View
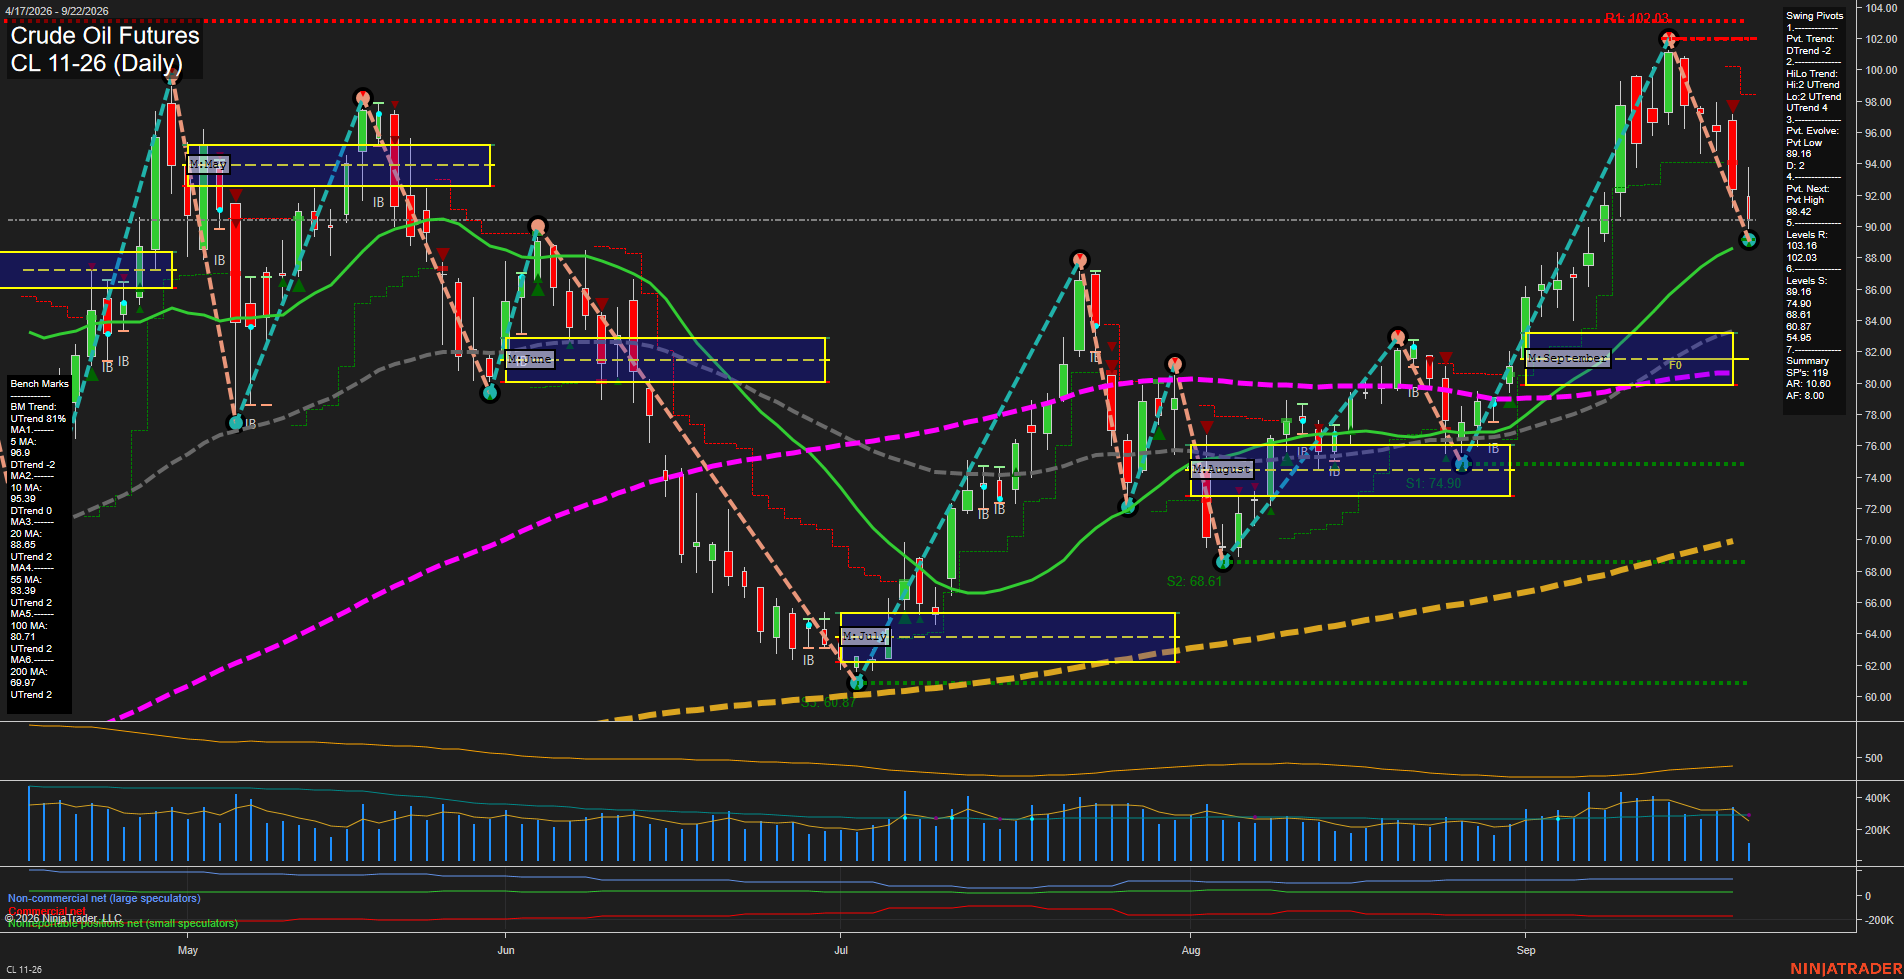
Overall Rating
- Short-Term: Bearish
- Intermediate-Term: Bullish
- Long-Term: Bullish.
Key Insights Summary
Price has undergone a fast, large-range pullback from the 102.03 swing-high resistance area and has shifted the short-term pivot structure into DTrend. The decline has reached the 89.16 pivot-low area, while price remains above the rising 20, 55, 100, and 200-day benchmarks. This creates a bearish short-term countertrend within a still constructive intermediate- and long-term higher-low structure. The weekly grid remains below F0% and down, while the September monthly grid remains above F0% and up. Resistance is layered at 101.03 and 102.03; 89.16 is the immediate pivot support, followed by 74.90. Elevated momentum and the sharp retreat from the recent high indicate an active volatility phase rather than a mature low-volatility consolidation.
View charts on: AlphaWebTrader HTF Charts
GC Daily View
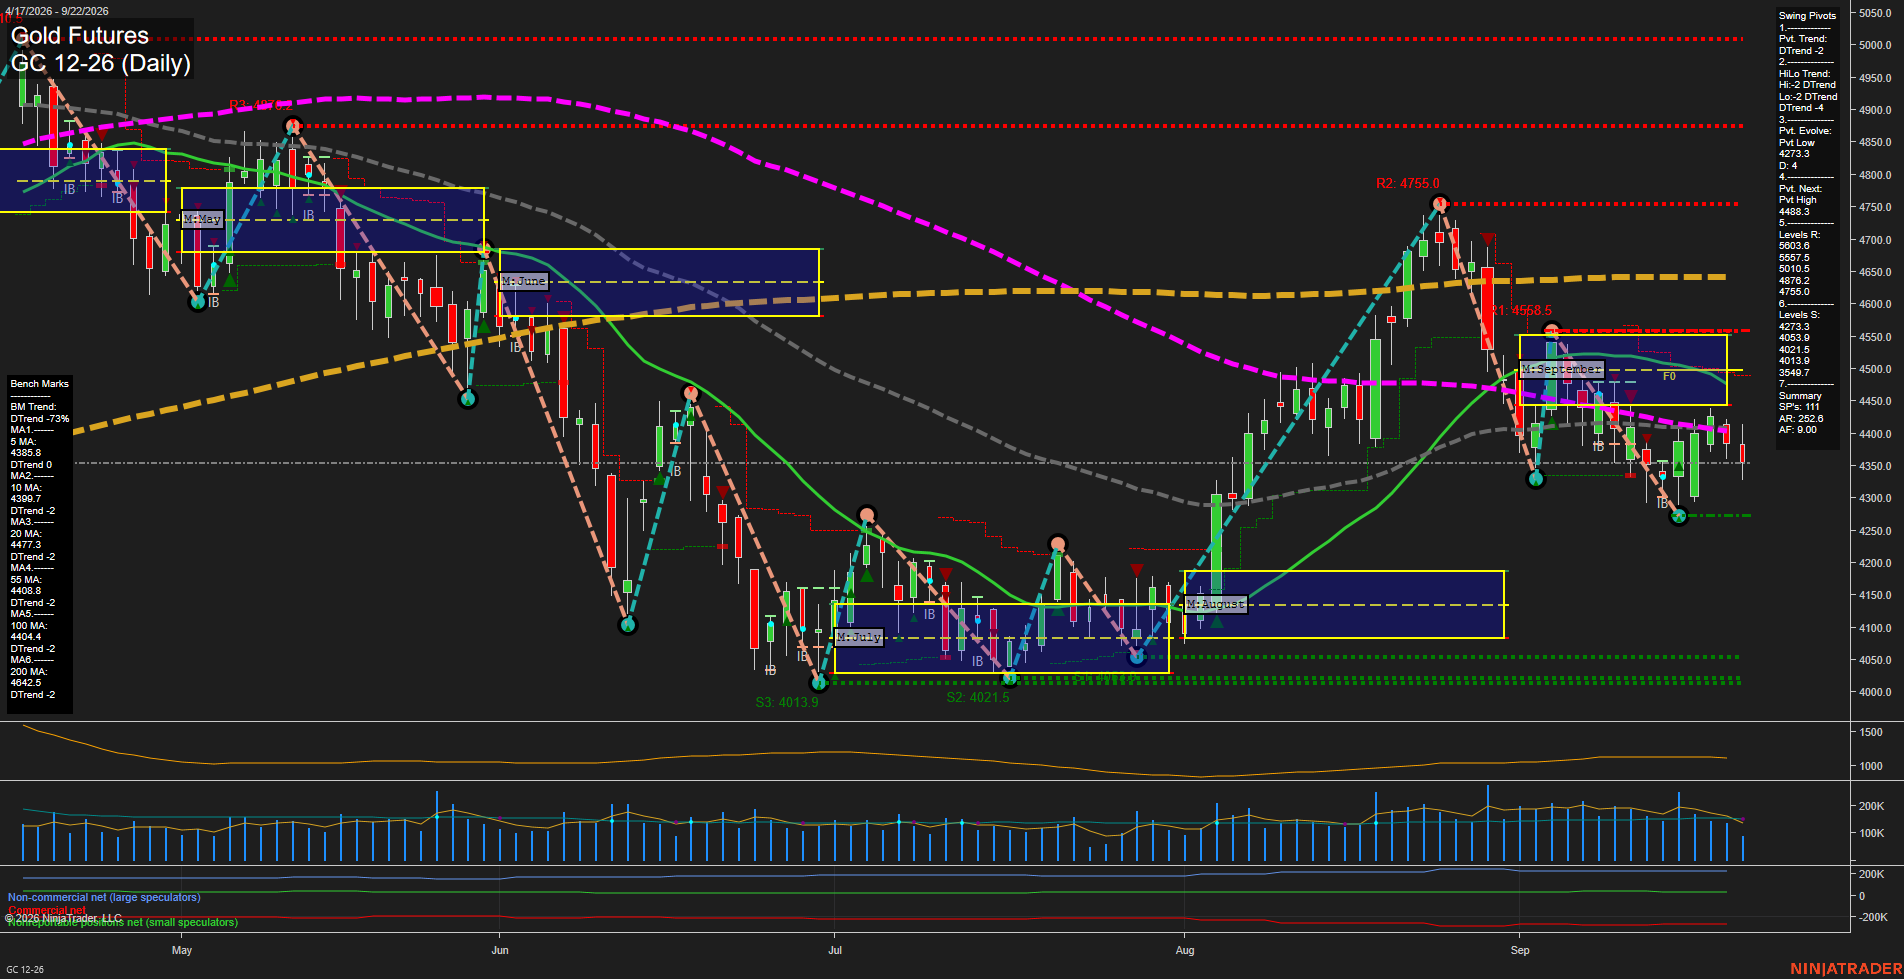
Overall Rating
- Short-Term: Bearish
- Intermediate-Term: Bearish
- Long-Term: Bearish.
Key Insights Summary
Gold remains in a broad bearish swing structure: price is below every benchmark average, below the weekly and monthly F0% levels, and both pivot-trend measures remain in DTrend. The rebound from the 4273.3 pivot low has not altered the lower-high sequence, with 4488.3 defining the next pivot-reversal threshold and the 4477.3 20-day average reinforcing overhead resistance. Price action is consolidating beneath clustered 5-, 10-, 55-, and 100-day averages near 4386 to 4408, while the recent short signals align with the prevailing downside cycle. Volatility remains elevated relative to the daily range structure, supporting medium-sized bars and choppy countertrend bounces within the broader decline.
View charts on: AlphaWebTrader HTF Charts
ZB Daily View
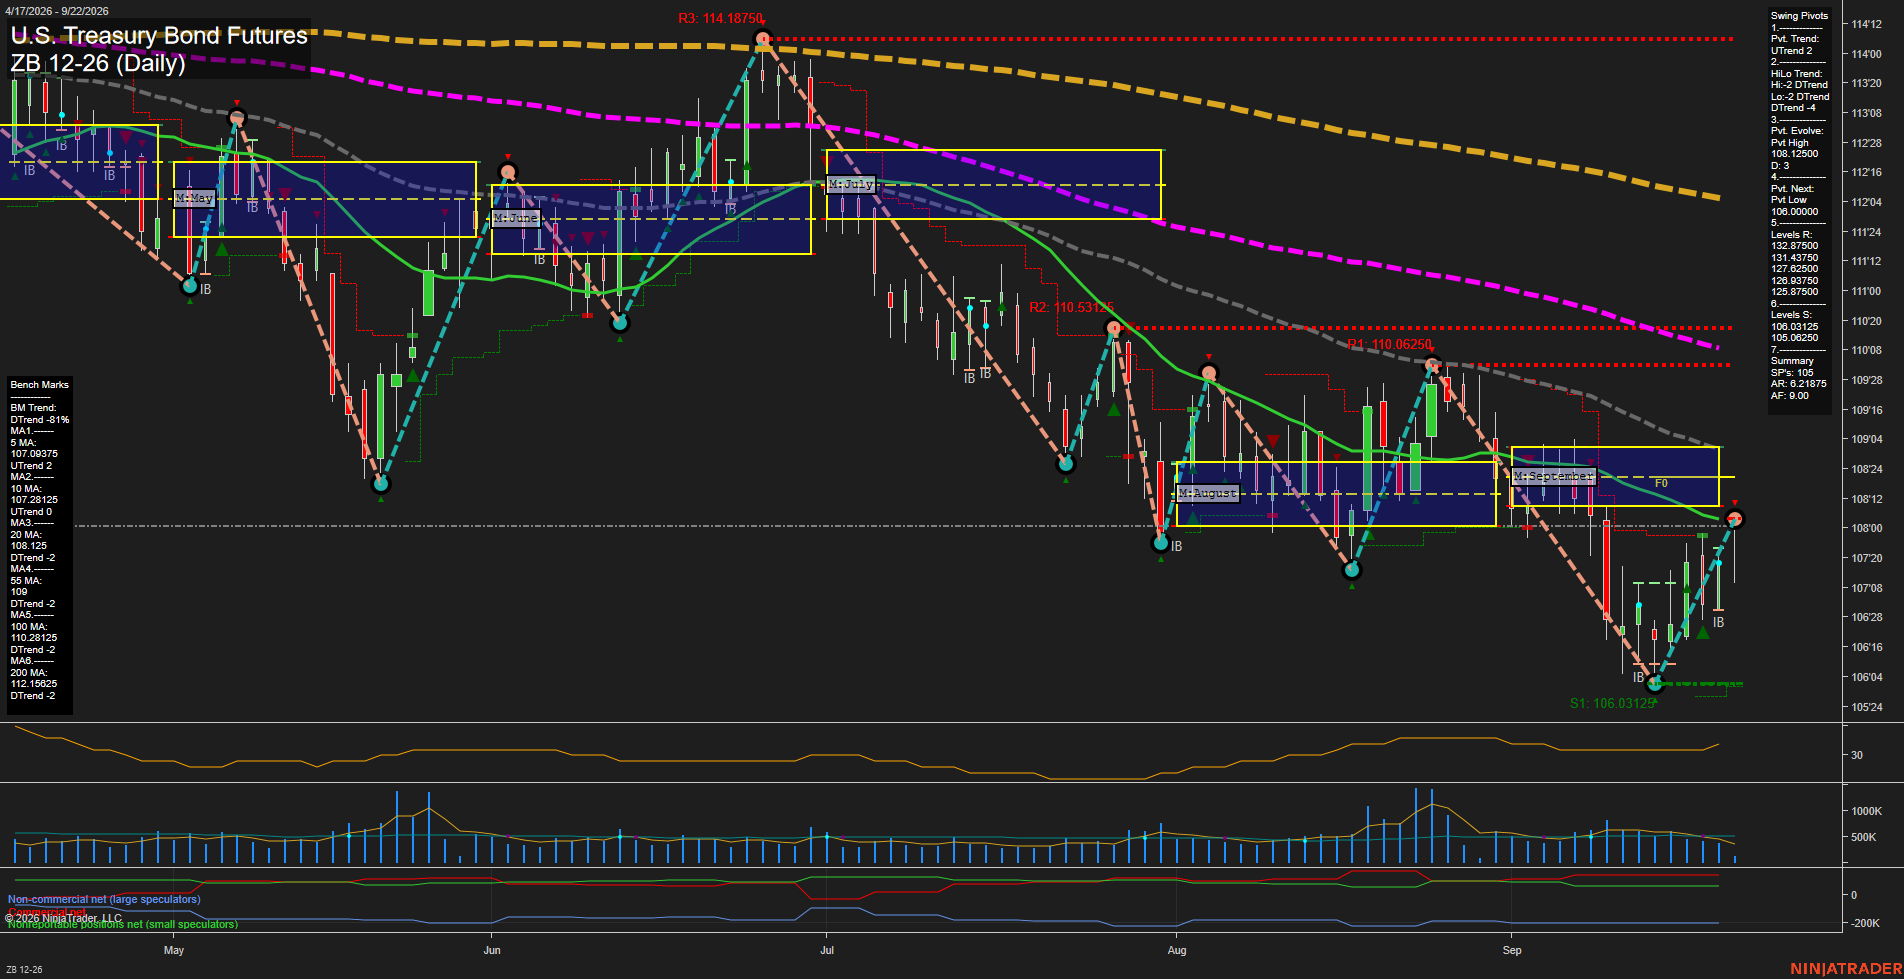
Overall Rating
- Short-Term: Bullish
- Intermediate-Term: Bearish
- Long-Term: Bearish.
Key Insights Summary
The daily chart shows a sharp short-term V-style rebound from the 106.03125 swing-support area, with price recovering above the rising 5-day and 10-day benchmarks and the pivot trend turning UTrend. The rebound remains countertrend within the broader structure: the HiLo trend is DTrend, price remains beneath the declining 20-day through 200-day benchmarks, and September MSFG positioning is below its F0/NTZ area. The 108.12500 20-day average is the immediate overhead technical pivot; the 106.03125 support remains the defining lower swing level. Rising momentum and medium-sized bars reflect an active recovery phase, while the descending intermediate- and long-term average alignment continues to characterize the larger daily cycle as bearish.
View charts on: AlphaWebTrader HTF Charts