US equities gained as oil fell below $100 and chip shares rallied, but weak market breadth, rich valuations and higher-rate risks remained in focus.
Fundamentals: Stocks advanced Monday, with the S&P 500 rising more than 1% as lower oil prices and renewed semiconductor strength eased inflation concerns. Diplomatic developments involving Iran supported risk sentiment, while declining Treasury yields aided bonds. However, weak participation beneath the index gains, elevated valuations, concentrated earnings growth and ongoing Fed, trade and geopolitical risks remained notable cross-currents.
Technicals: META, IBIT and TSLA led the session’s top ETF movers, while GLD and USO declined. Futures technicals remained broadly bullish for ES and NQ across daily and weekly views, supported by rising benchmarks and recovery patterns. YM, EMD, RTY and FDAX showed more mixed conditions, with short-term corrective pressure contrasting with generally constructive longer-term structures.
After Market Close daily snapshot: market news summary and sentiment, major ETFs, Magnificent 7 analysis, Indices Futures Higher Time Frame Analysis, and E-mini S&P500, Nasdaq 100, NYMEX Crude, Gold Futures Daily Chart analysis.
As of: September 21, 2026 05:00 CT
Market News Summary:
Equities advanced as falling oil prices and renewed chip strength eased inflation concerns, while weak market breadth and elevated valuations tempered the backdrop.
Primary Drivers & Risks:
- Primary Driver: Oil retreat and chip-led rally
- Primary Risk: Narrow breadth and higher rates
Tone:
Constructive index action with notable internal caution.
Stock Market / ETFs / Indices:
The S&P 500 rose more than 1% Monday and moved within 1% of a record after a marginal weekly decline. Technology and chip stocks led the advance, but participation remained weak: roughly 60% of S&P 500 components sat over 20% below their highs, and new 52-week lows exceeded new highs. Earnings estimates for 2026 have risen sharply, while commentary highlighted concentration of earnings gains in technology and energy and historically elevated market valuations.
Geopolitical:
Diplomacy surrounding the US-Iran war supported risk sentiment and reduced energy-market anxiety, although Iran outlined conditions for talks and military-action tensions remained in focus. Trump and Xi Jinping are meeting amid a fragile trade truce, with AI controls, tariffs, sanctions, rare earths, and Iran among unresolved issues.
Oil / Energy:
Oil fell below $100 and headed for its longest decline since June as Strait of Hormuz flows remained robust and US-Iran diplomacy cooled the recent rally. Lower crude eased inflation concerns and supported stocks and bonds, while refinery supply constraints and diesel headwinds remained a separate fuel-market issue. AI-related power demand and grid capacity constraints remained a prominent energy-equity theme.
Gold / Metals:
Gold retreated as the dollar strengthened, despite lower Treasury yields and oil prices. The recent Fed rate increase, fiscal concerns, and broader political uncertainty remained central factors in gold-market commentary.
Fed / Financials:
The Fed raised interest rates last week, its first increase in multiple years. A call for higher rates from a Fed official kept rate-sensitive equity risk in focus, even as Treasury yields declined during Monday’s session.
Macro / Other:
Commentary cited GDP growth averaging 1.2%, alongside concerns that recent aggregate earnings strength relies heavily on AI-related technology demand and conflict-driven energy pricing. Bitcoin rose alongside declining oil prices and Treasury yields.
Conclusion:
Falling oil prices, US-Iran diplomatic hopes, and renewed technology leadership drove the session’s positive index performance. Lower inflation anxiety supported both equities and bonds.
Market breadth remained weak beneath the index advance, while rich valuations and concentrated earnings growth remained key cross-currents. Higher-rate policy, Iran developments, and US-China trade and technology issues remained active risks.
Market News Sentiment
Market News Articles: 41
- Neutral: 56.10%
- Positive: 24.39%
- Negative: 19.51%
Sentiment Summary: Of 41 market news articles, 56% were neutral, 24% positive, and 20% negative, indicating predominantly balanced coverage.
Conclusion: Indices futures headlines reflect a neutral tone, with positive coverage modestly exceeding negative coverage.
GLD,Gold Articles: 9
- Neutral: 44.44%
- Negative: 33.33%
- Positive: 22.22%
Sentiment Summary: GLD and gold coverage is neutral overall, with 44% neutral, 33% negative, and 22% positive articles.
Conclusion: For indices futures day traders, gold-related news tone is mixed with a neutral-to-negative skew.
USO,Oil Articles: 13
- Negative: 76.92%
- Positive: 15.38%
- Neutral: 7.69%
Sentiment Summary: USO and oil coverage was predominantly negative, with 77% negative, 15% positive, and 8% neutral articles across 13 reports.
Conclusion: The news tone around oil was broadly negative, which may be relevant context for indices futures traders monitoring energy-sector sentiment.
Market Data Snapshot
ETF Snapshot of major stock market ETFs, Mag7, and others as of: September 21, 2026 05:00
Top Movers & Losers
- META 741.25 Bullish 11.34% ▲
- IBIT 49.01 Bullish 6.50% ▲
- TSLA 375.30 Bullish 3.03% ▲
- IJH 73.25 Bullish 0.37% ▲
- GLD 398.38 Bearish -0.70% ▼
- USO 148.16 Bearish -3.68% ▼
Major Index ETFs: SPY, QQQ, DIA, IWM, IJH
- QQQ 741.47 Bullish 2.77% ▲
- SPY 773.50 Bullish 1.55% ▲
- DIA 519.78 Bullish 0.76% ▲
- IWM 285.58 Bullish 0.52% ▲
- IJH 73.25 Bullish 0.37% ▲
Major index ETFs were Bullish across the group: QQQ led with +2.77%, followed by SPY at +1.55%. DIA gained +0.76%, while IWM rose +0.52%. IJH was the least positive mover at +0.37%.
Mag 7 Stocks: AAPL, MSFT, GOOG, AMZN, META, NVDA, TSLA
- META 741.25 Bullish 11.34% ▲
- TSLA 375.30 Bullish 3.03% ▲
- NVDA 227.38 Bullish 2.30% ▲
- GOOG 350.87 Bullish 1.88% ▲
- AMZN 258.45 Bullish 1.87% ▲
- MSFT 501.61 Bullish 1.59% ▲
- AAPL 338.98 Bullish 0.85% ▲
Mag7 was Bullish across the group, led by META at +11.34%. TSLA followed at +3.03%, while NVDA gained +2.30%. GOOG and AMZN advanced +1.88% and +1.87%, respectively, with MSFT up +1.59%. AAPL was the least positive mover at +0.85%.
Cross-Market ETFs: TLT, GLD, USO, IBIT
- IBIT 49.01 Bullish 6.50% ▲
- TLT 81.80 Bullish 0.68% ▲
- GLD 398.38 Bearish -0.70% ▼
- USO 148.16 Bearish -3.68% ▼
Mixed cross-market snapshot: IBIT is the most bullish mover at +6.50%, while USO is the most bearish mover at -3.68%. TLT is Bullish at +0.68%, while GLD is Bearish at -0.70%.
ETF, Mag7, and Cross-Market ETF Insights
Overall Tone
Bullish risk-on tone, led by strong technology and digital-asset participation, while GLD and USO are Bearish.
Equity ETFs and Mag7:
Major Index ETFs are broadly Bullish: QQQ led at +2.77%, ahead of SPY at +1.55%, DIA at +0.76%, IWM at +0.52%, and IJH at +0.37%; QQQ was the most bullish equity ETF, while IJH was the least positive. Mag7 participation was strongly Bullish and selective, led by META at +11.34%, the most bullish mover across all groups, followed by TSLA at +3.03% and NVDA at +2.30%. AAPL was the least positive Mag7 name at +0.85%, while all seven Mag7 names remained Bullish.
Cross-Market ETFs:
Cross-market ETFs were Mixed: IBIT was strongly Bullish at +6.50%, the group’s most bullish mover, while TLT was modestly Bullish at +0.68%. GLD was Bearish at -0.70% and USO was Bearish at -3.68%, making USO the most bearish mover across all groups. The divergence of strong IBIT gains against Bearish gold and oil aligned with the Bullish equity backdrop.
Futures Indices – Higher Time Frame Analysis
Summary of the current state of US Indices Futures based on higher time-frame (HTF) technical analysis as of: 2026-09-21: 17:00 CT.
US Indices Futures
- ES YSFG/MSFG/WSFG above F0%, benchmarks rising, UTrend, resistance 7780-7906.25, support 7559.25.
- NQ YSFG/MSFG/WSFG above F0%, benchmarks aligned higher, UTrend, resistance 30266.75-31389.25, support 29476.25-29053.00.
- YM YSFG/WSFG above F0%, MSFG below F0%, short benchmarks declining, DTrend, resistance 52747-53953, support 51609.
- EMD YSFG above F0%, MSFG below F0%, short benchmarks declining, DTrend, resistance 3725.2-3833.8, support 3636.2.
- RTY YSFG/WSFG above F0%, MSFG below F0%, short benchmarks declining, DTrend, resistance 2927.1-3005.2, support 2850.
- FDAX YSFG constructive, MSFG below F0%, near 20-week benchmark, weekly DTrend, resistance 25990-26847, support 25362.
Overall State
- Short-Term: Neutral
- Intermediate-Term: Bearish
- Long-Term: Bullish
Conclusion
ES and NQ maintain aligned bullish YSFG, MSFG, WSFG, benchmark, and pivot structures, leading the index complex. YM, EMD, RTY, and FDAX remain in corrective short-to-intermediate-term structures, with MSFG weakness and declining near-term benchmarks. All listed contracts retain bullish long-term context through YSFG positioning and rising longer-period benchmarks, while pivot support and resistance levels define current HTF structure.
Note: Intra-day counter-trend pullbacks or retracements may occur, HTF is context for informational usage and market structure. Glossary: Session Fib Grids periods of YSFG:’Yearly’, MSFG:’Monthly’, WSFG:’Weekly’
For full details visit: AlphaWebTrader Technicals
ES Daily View
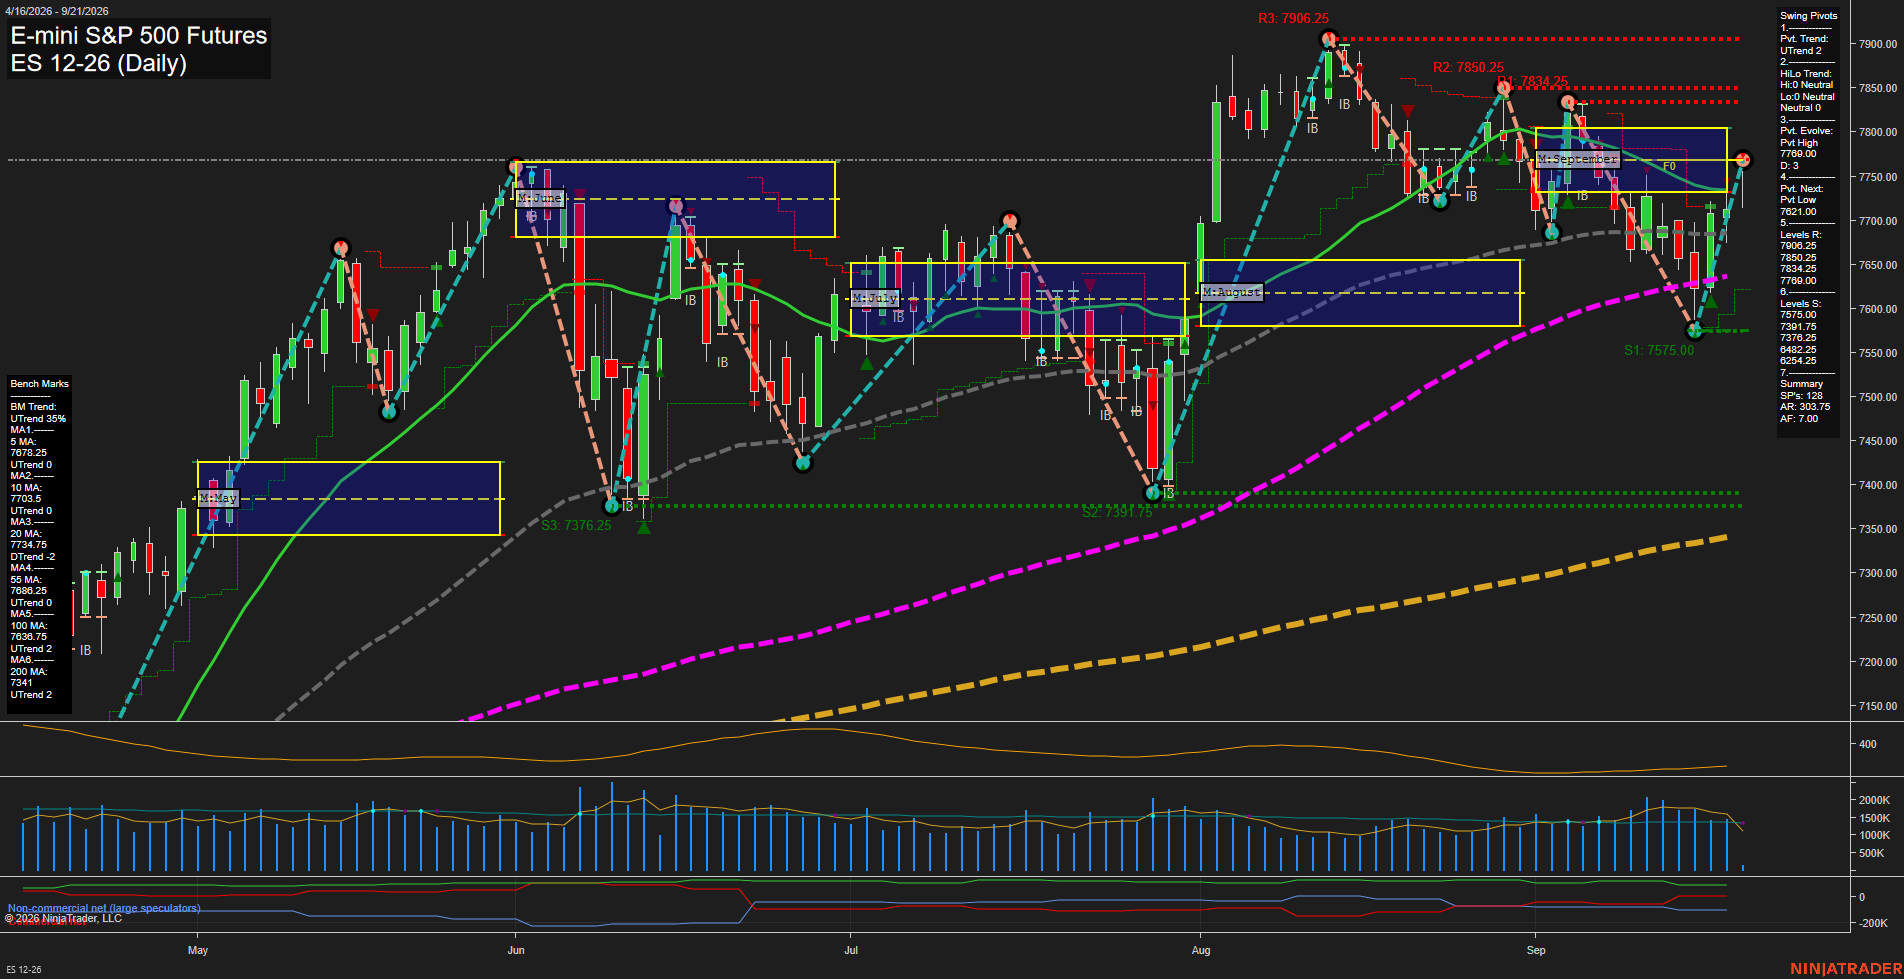
Overall Rating
- Short-Term: Bullish
- Intermediate-Term: Bullish
- Long-Term: Bullish.
Key Insights Summary
The daily structure has regained upside momentum through a large recovery bar, with price above the weekly and monthly F0% areas and above all major benchmarks except the declining 20-day average. The short-term pivot trend is upward and price is pressing the 7780.00 resistance area after a sharp rebound from the 7391.75 pivot-support zone. Intermediate and long-term structure remains constructive through rising 55-, 100-, and 200-day averages, while the 20-day average reflects the recent corrective swing. The immediate pattern is a V-shaped recovery within a broader uptrend, with 7780.00, 7834.25, and 7850.25 defining the nearby overhead pivot-resistance sequence.
View charts on: AlphaWebTrader HTF Charts
NQ Daily View
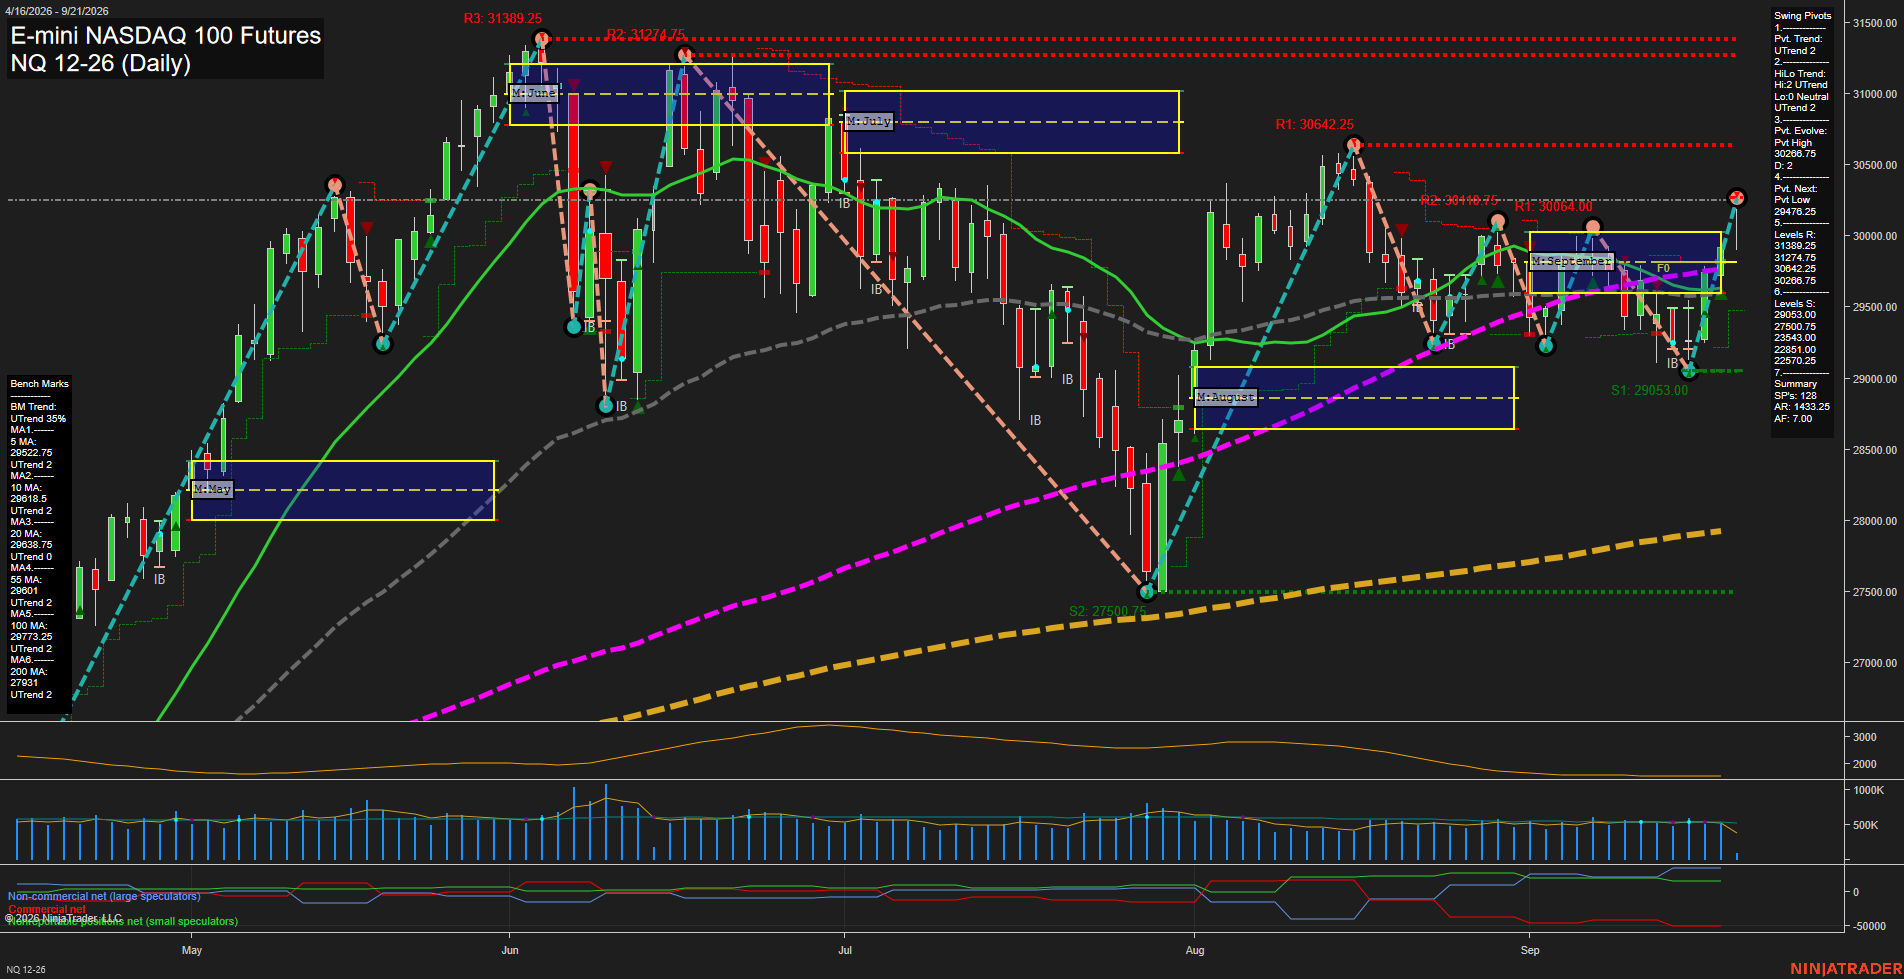
Overall Rating
- Short-Term: Bullish
- Intermediate-Term: Bullish
- Long-Term: Bullish.
Key Insights Summary
The daily structure reflects a strong V-recovery continuation: price has surged from the 29053.00 swing-support area, reclaimed every displayed benchmark average, and established a new short-term pivot high at 30266.75. Weekly, monthly, and yearly Fib-grid positioning remains above F0%, aligning the short-, intermediate-, and long-term trend themes. Fast momentum and large daily bars indicate an expansion phase rather than a quiet consolidation, with 30064.00 through 30642.25 defining the nearest overhead pivot-resistance band. The 29476.25 pivot-next level and 29053.00 support are the principal nearby structural references beneath the advance.
View charts on: AlphaWebTrader HTF Charts
CL Daily View
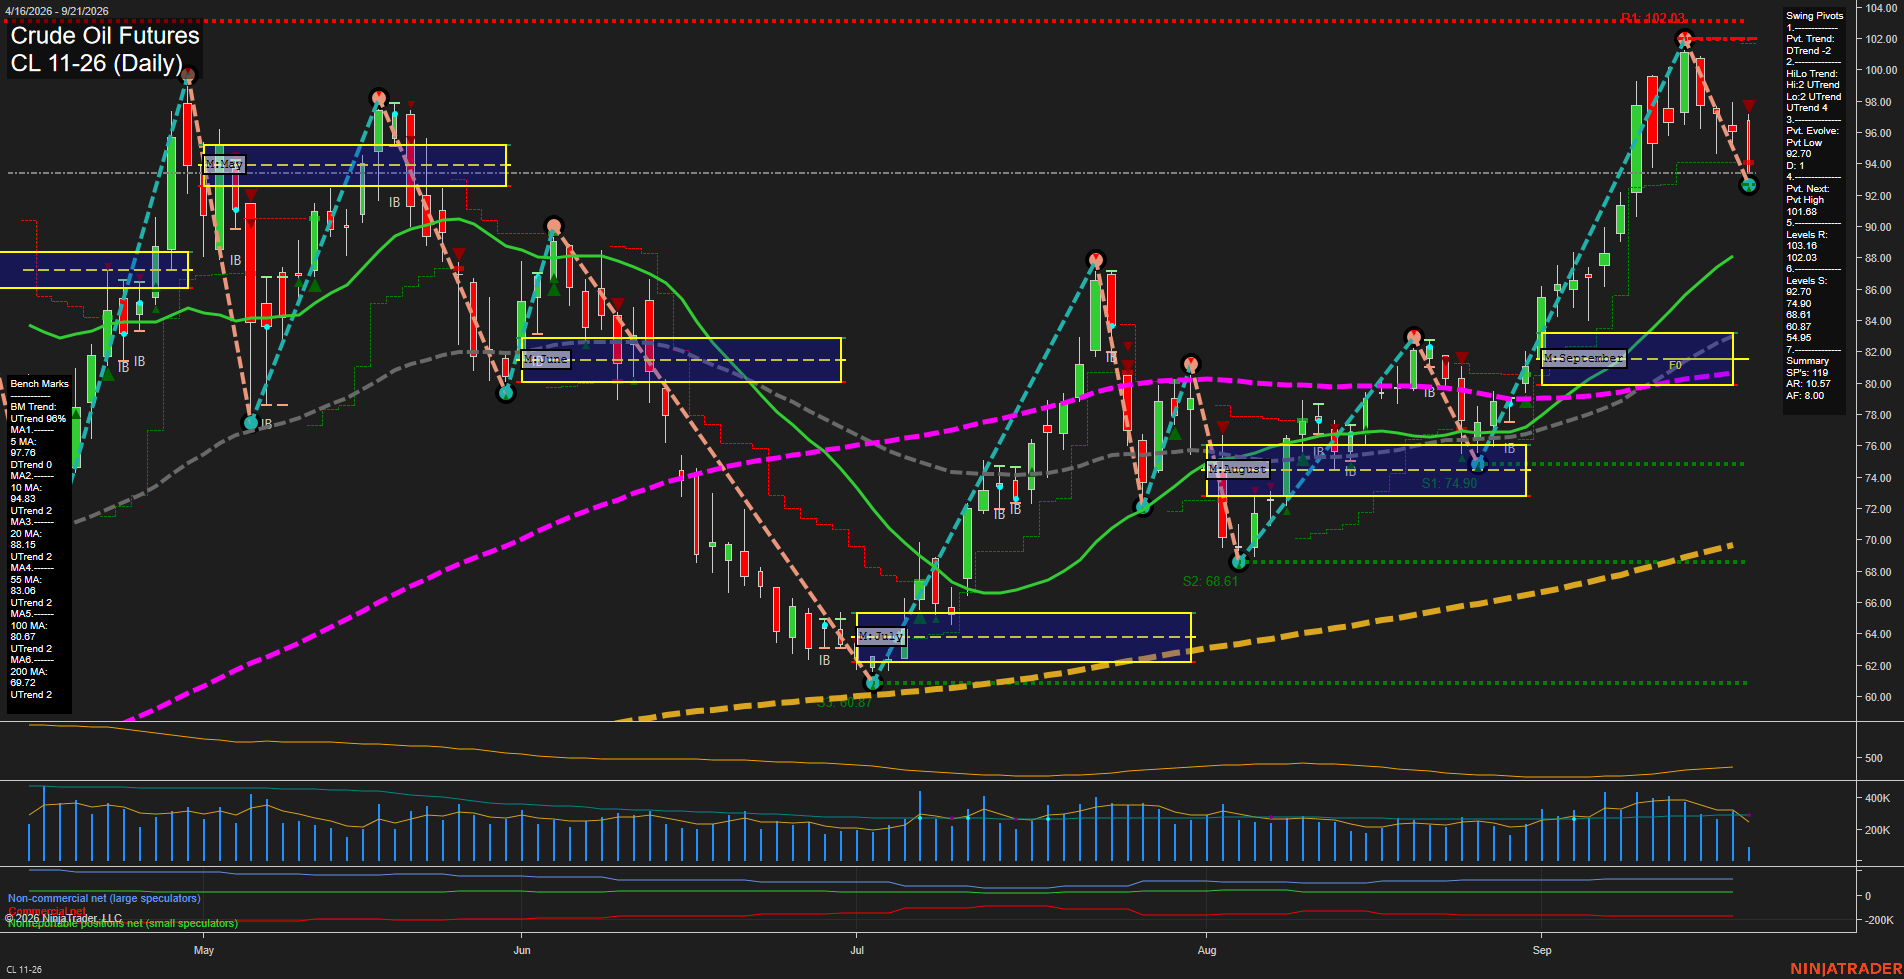
Overall Rating
- Short-Term: Bearish
- Intermediate-Term: Bullish
- Long-Term: Bullish.
Key Insights Summary
Price has undergone a fast, large-bar retracement from the 102.03 pivot resistance area, shifting the short-term pivot structure into DTrend and placing price below the weekly F0% grid. The 5-day benchmark is declining and price is below the 10-day average, confirming near-term downside momentum. The broader structure remains constructive: price holds above the rising 20-, 55-, 100-, and 200-day benchmarks, the monthly grid remains positive, and the intermediate HiLo pivot trend is still UTrend. The 92.70 pivot low is the immediate short-term structural level, while 101.68 to 102.03 defines the overhead swing-high resistance zone.
View charts on: AlphaWebTrader HTF Charts
GC Daily View
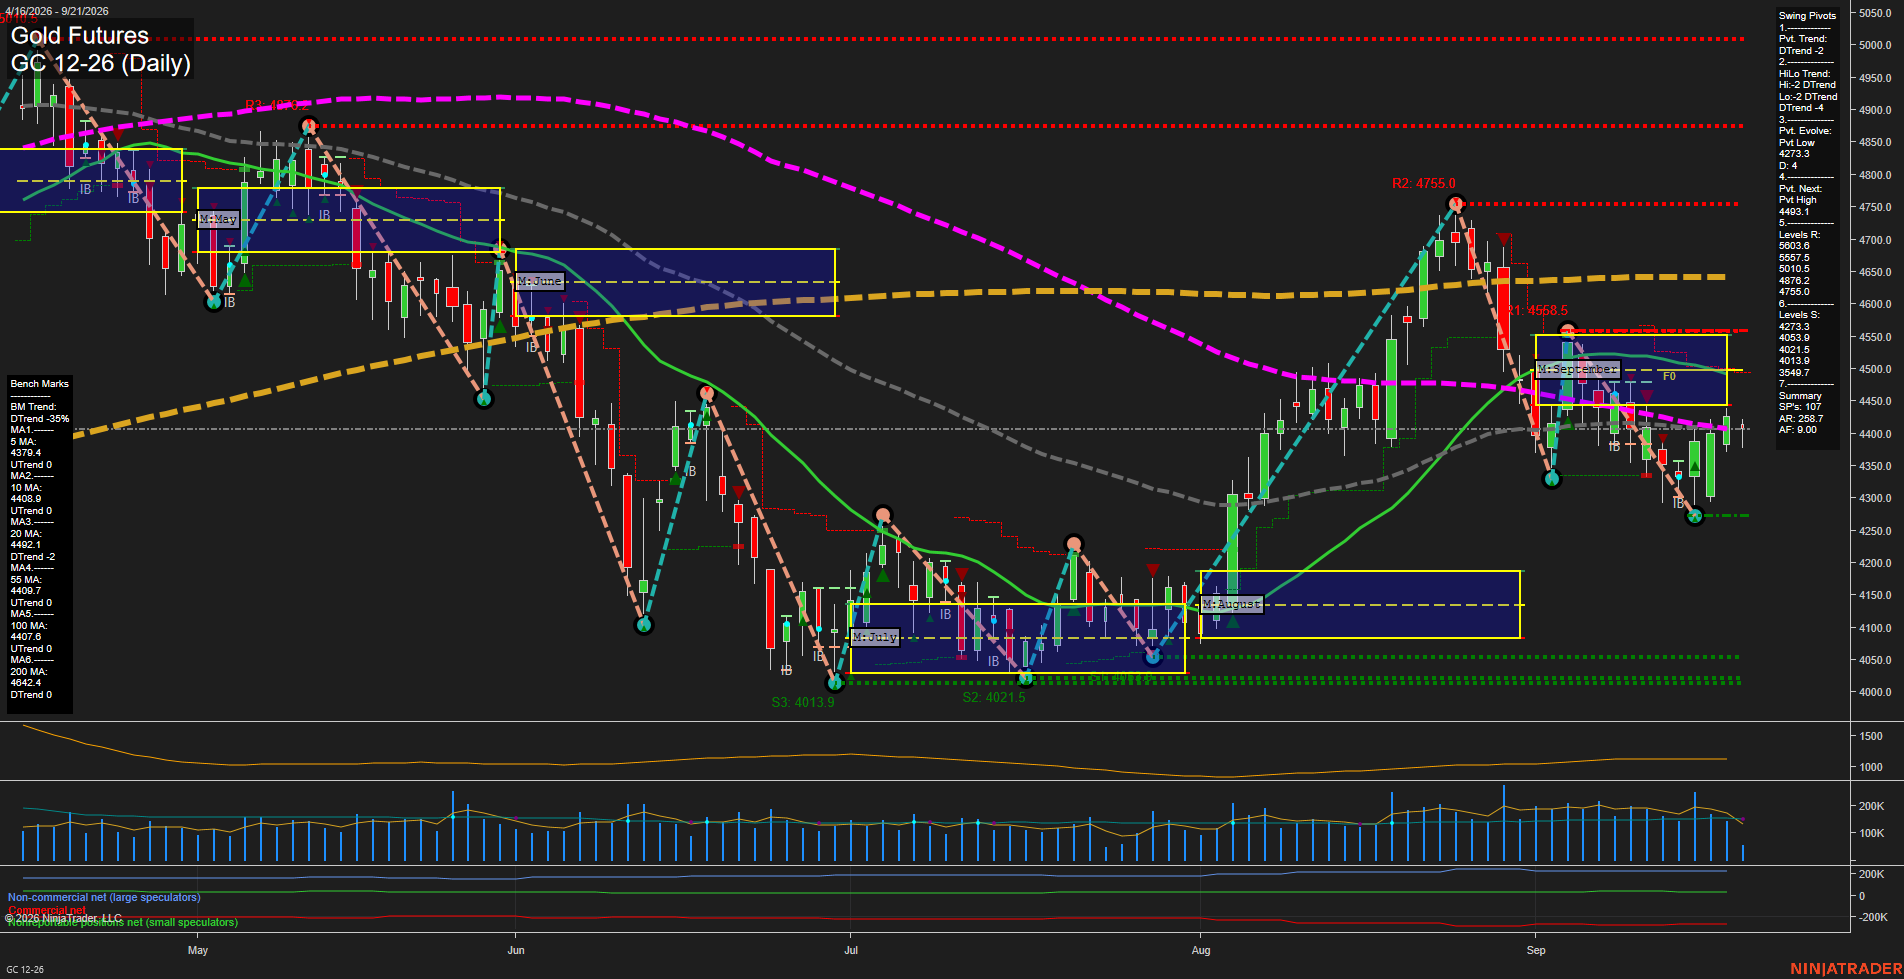
Overall Rating
- Short-Term: Bearish
- Intermediate-Term: Bearish
- Long-Term: Bearish.
Key Insights Summary
Price is rebounding from the 4271.3 pivot low, but the broader swing structure remains downward with both Pivot Trend and HiLo Trend in DTrend. The recovery has lifted price marginally above the 5-day, 10-day, 55-day, and 100-day benchmarks, while the declining 20-day average at 4442.9 and the 4493.1 pivot-reversal threshold define the nearby overhead test zone. Weekly, monthly, and yearly fib-grid readings remain below F0%, reflecting a bearish multi-timeframe backdrop. The recent action is a volatile counter-trend bounce within a larger decline, with 4273.3 as primary nearby support and 4755.0 as major visible swing resistance.
View charts on: AlphaWebTrader HTF Charts
ZB Daily View
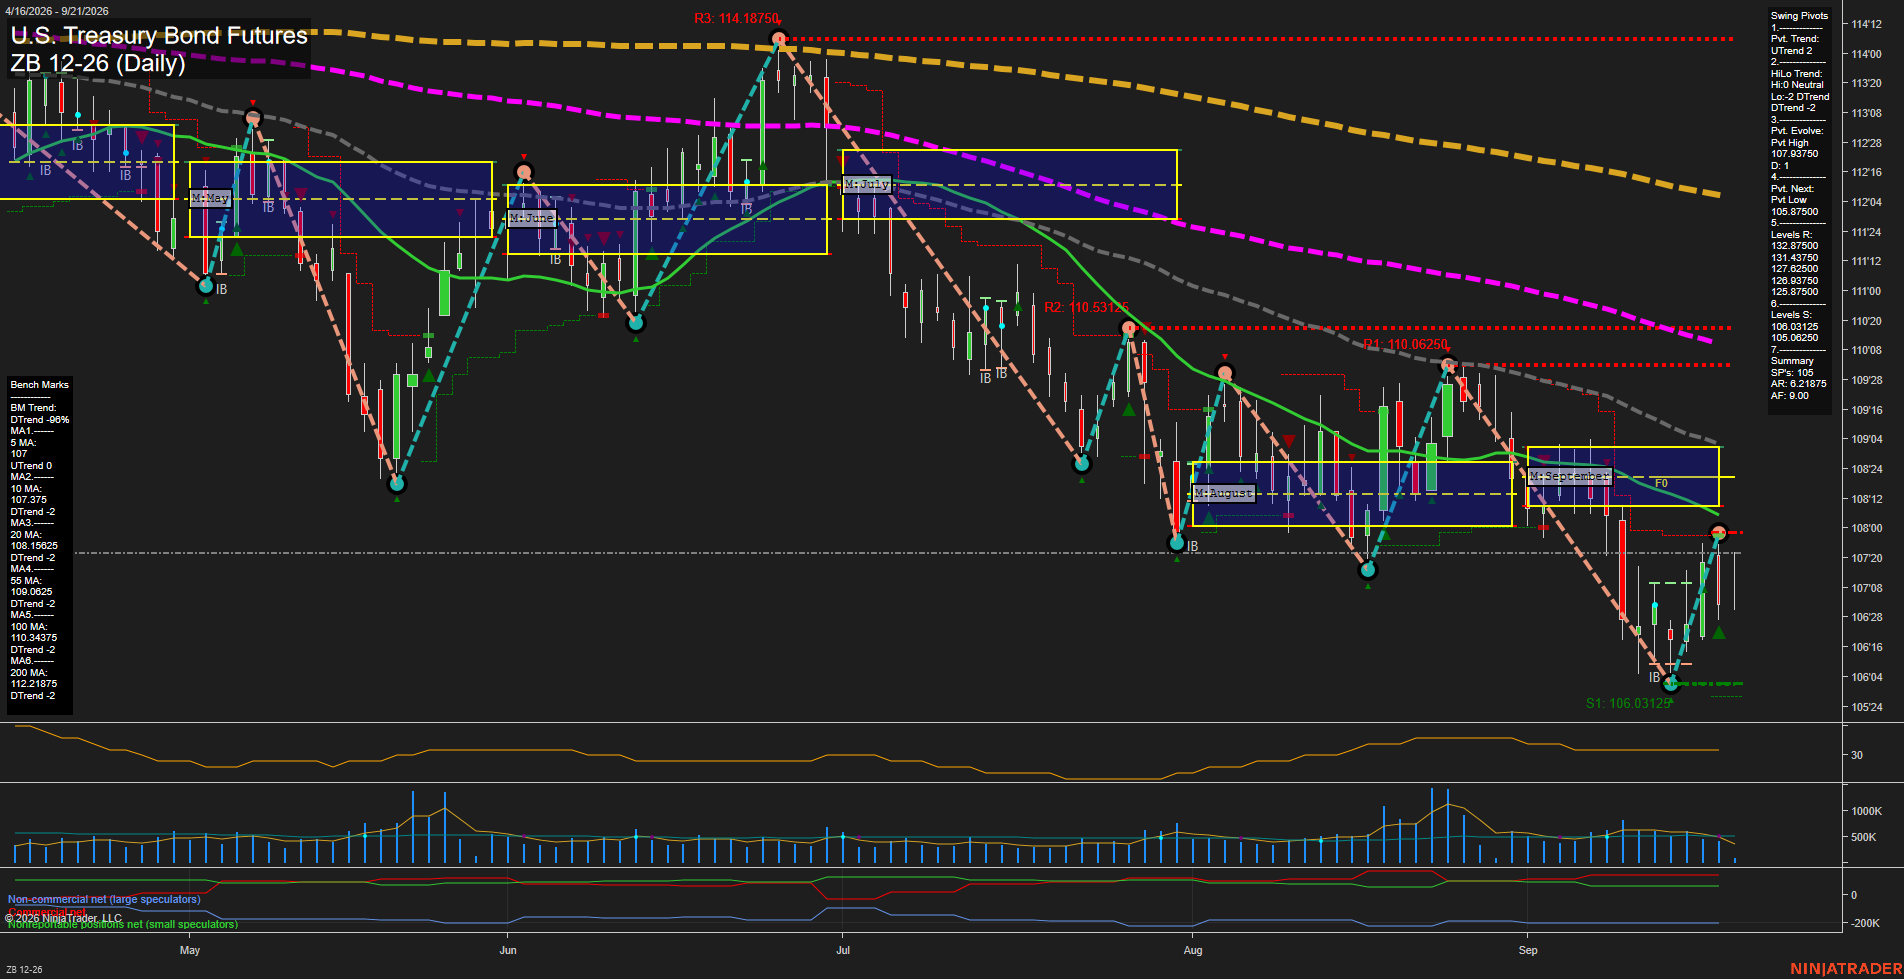
Overall Rating
- Short-Term: Neutral
- Intermediate-Term: Bearish
- Long-Term: Bearish.
Key Insights Summary
Price is staging a fast short-term rebound from the 106.03125 swing-low area and has established a current UTrend pivot sequence, but the rally is testing into nearby resistance around 107.87500-108.00000 while remaining below the September NTZ and the declining 10-, 20-, 55-, 100-, and 200-day benchmarks. The intermediate and long-term structure remains a lower-high/downtrend environment. The recent recovery resembles a counter-trend bounce inside the broader decline, with 106.03125 and 105.06250 defining the principal downside swing-support references.
View charts on: AlphaWebTrader HTF Charts