NYSE pre-market review tracks ETF movers and futures levels across ES, NQ, YM, RTY, EMD and FDAX as easing oil offsets global rate risks.
Fundamentals: U.S. index futures posted modest early gains as easing oil prices offered some inflation relief following the Fed’s rate increase. Elevated Treasury yields and broad global policy tightening remained pressures for equities, particularly technology shares. Middle East conflict and Hormuz restrictions continued to underpin energy-market risk despite reduced concern over Saudi supply flows.
Technicals: Pre-market conditions reflect gains in NVDA, TSLA and AMZN, while major futures show divergent technical structures. ES and NQ retain bullish short-term momentum near resistance, while YM, RTY, EMD and FDAX remain in corrective pullbacks. The review tracks pivot levels, moving-average trends and Fib-grid positioning across weekly and daily charts.
Pre-Market Trading 360° view Market Radar of: holidays, earnings, eco-news, market-news summary, news sentiment, prior session major ETFs, MAG7, Higher Time Frame Analysis Indices Futures Summary, and E-mini S&P500, Nasdaq 100, NYMEX Crude, Gold Futures Daily Chart analysis.
As of: September 18, 2026 07:16 CT
Market News Summary:
U.S. index futures posted slight early gains as traders absorbed higher global policy rates, easing oil prices, and persistent Middle East energy risks.
Primary Drivers & Risks:
- Primary Driver: Higher global interest rates
- Primary Risk: Middle East energy disruptions
Tone:
Mixed, with modest futures strength against inflation and rate pressures.
Stock Market / ETFs / Indices:
U.S. stock futures showed slight gains early Friday. Technology sentiment improved through bullish options activity in AI-related trades, while elevated Treasury yields remained a key pressure point for AI valuations. QQQ outperformed the S&P 500 over the prior year, reflecting heavy concentration in large technology holdings.
Geopolitical:
Saudi-Houthi strikes and the Iran war remained central cross-currents for markets. Saudi crude rerouting eased immediate supply concerns, while Hormuz restrictions and targeted geopolitical sanctions remained in focus.
Oil / Energy:
WTI fell below $100 and oil declined for a third session as prospects for restored Saudi pipeline flows reduced near-term supply fears. Prices remained elevated in broader markets: Russian ESPO crude exceeded $120, LNG markets stayed tight, and European officials discussed a windfall tax on energy-company profits.
Gold / Metals:
Gold and silver rebounded as oil, Treasury yields, and the dollar eased following the Fed rate increase. The move reflected reduced immediate inflation pressure from the oil pullback.
Fed / Financials:
The Fed raised rates to address persistent inflation in consumer prices, housing, and fuel, increasing borrowing costs. The Bank of Japan raised its benchmark rate to 1.25%, its highest level since 1995, while the RBA highlighted rising inflation pressure from oil, AI investment, and capacity constraints.
Macro / Other:
Margin debt rose 2.6% in August and remained sharply higher year over year, underscoring elevated market leverage. An insurance IPO priced below its targeted range, signaling uneven appetite for new listings.
Conclusion:
Global rate tightening and the post-Fed response are the primary macro drivers for index futures. Softer crude prices provided some relief for inflation concerns and supported metals.
Middle East conflict risk remains embedded in energy markets despite easing immediate Saudi supply fears. High yields, inflation persistence, and elevated margin debt remain important cross-currents for equities, particularly technology shares.
Market News Sentiment
Market News Articles: 37
- Neutral: 43.24%
- Negative: 29.73%
- Positive: 27.03%
Sentiment Summary: Of 37 market news articles, 43% were neutral, 30% negative, and 27% positive, indicating predominantly neutral coverage with a modest negative skew over positive items.
Conclusion: Indices futures day traders are facing a broadly neutral news backdrop, with negative articles slightly outnumbering positive articles.
GLD,Gold Articles: 14
- Positive: 85.71%
- Neutral: 14.29%
Sentiment Summary: Gold (GLD) coverage was strongly positive, with 86% positive and 14% neutral articles across 14 articles.
Conclusion: The snapshot indicates predominantly positive sentiment toward gold, with no negative articles reported.
USO,Oil Articles: 10
- Negative: 70.00%
- Positive: 20.00%
- Neutral: 10.00%
Sentiment Summary: Oil-related coverage is predominantly negative, with 70% negative, 20% positive, and 10% neutral articles.
Conclusion: The negative tone in oil news is a notable cross-market sentiment factor for indices futures day traders.
Market Data Snapshot
ETF Snapshot of major stock market ETFs, Mag7, and others as of: September 18, 2026 07:16
Top Movers & Losers
- NVDA 219.34 Bullish 2.54% ▲
- TSLA 366.20 Bullish 2.27% ▲
- AMZN 251.19 Bullish 2.13% ▲
- IJH 73.21 Bullish 0.56% ▲
- IWM 285.43 Bullish 0.53% ▲
- USO 155.31 Bearish -0.55% ▼
Major Index ETFs: SPY, QQQ, DIA, IWM, IJH
- QQQ 716.92 Bullish 1.73% ▲
- SPY 762.60 Bullish 1.13% ▲
- DIA 518.35 Bullish 0.61% ▲
- IJH 73.21 Bullish 0.56% ▲
- IWM 285.43 Bullish 0.53% ▲
Major index ETFs are uniformly Bullish: QQQ leads as the most bullish mover at +1.73%, followed by SPY at +1.13%. DIA gained +0.61%, while IJH rose +0.56% and IWM is the least positive mover at +0.53%.
Mag 7 Stocks: AAPL, MSFT, GOOG, AMZN, META, NVDA, TSLA
- NVDA 219.34 Bullish 2.54% ▲
- TSLA 366.20 Bullish 2.27% ▲
- AMZN 251.19 Bullish 2.13% ▲
- MSFT 497.75 Bullish 1.52% ▲
- AAPL 337.00 Bullish 1.38% ▲
- META 682.31 Bullish 1.34% ▲
- GOOG 343.68 Bullish 1.27% ▲
Mag7 breadth is Bullish, with all names higher. NVDA is the most bullish mover at +2.54%, followed by TSLA at +2.27% and AMZN at +2.13%. GOOG is the least positive mover at +1.27%; MSFT, AAPL, and META remain Bullish at +1.52%, +1.38%, and +1.34%, respectively.
Cross-Market ETFs: TLT, GLD, USO, IBIT
- GLD 398.36 Bullish 1.69% ▲
- TLT 81.78 Bullish 1.11% ▲
- IBIT 43.30 Bullish 0.60% ▲
- USO 155.31 Bearish -0.55% ▼
Other ETFs are Mixed: GLD is the most bullish mover at +1.69%, followed by TLT at +1.11% and IBIT at +0.60%. USO is the most bearish mover at -0.55%.
ETF, Mag7, and Cross-Market ETF Insights
Overall Tone
Bullish, risk-on tone, led by NVDA at +2.54% while USO is the sole Bearish mover at -0.55%.
Equity ETFs and Mag7:
Major Index ETFs are broadly Bullish: QQQ leads at +1.73%, followed by SPY at +1.13%, DIA at +0.61%, IJH at +0.56%, and IWM as the least positive at +0.53%. Mag7 participation is also broadly Bullish, led by NVDA at +2.54%, with TSLA at +2.27% and AMZN at +2.13%; GOOG is the least positive Mag7 name at +1.27%. Equity leadership is aligned across large-cap indices, smaller-cap ETFs, and all Mag7 names.
Cross-Market ETFs:
Cross-market ETFs are Mixed: GLD is the most bullish mover at +1.69%, while TLT gains +1.11% and IBIT adds +0.60%. USO is the most bearish mover at -0.55%, diverging from Bullish equities, gold, bonds, and bitcoin exposure.
Futures Indices – Higher Time Frame Analysis
Summary of the current state of US Indices Futures based on higher time-frame (HTF) technical analysis as of: 2026-09-18: 07:16 CT.
US Indices Futures
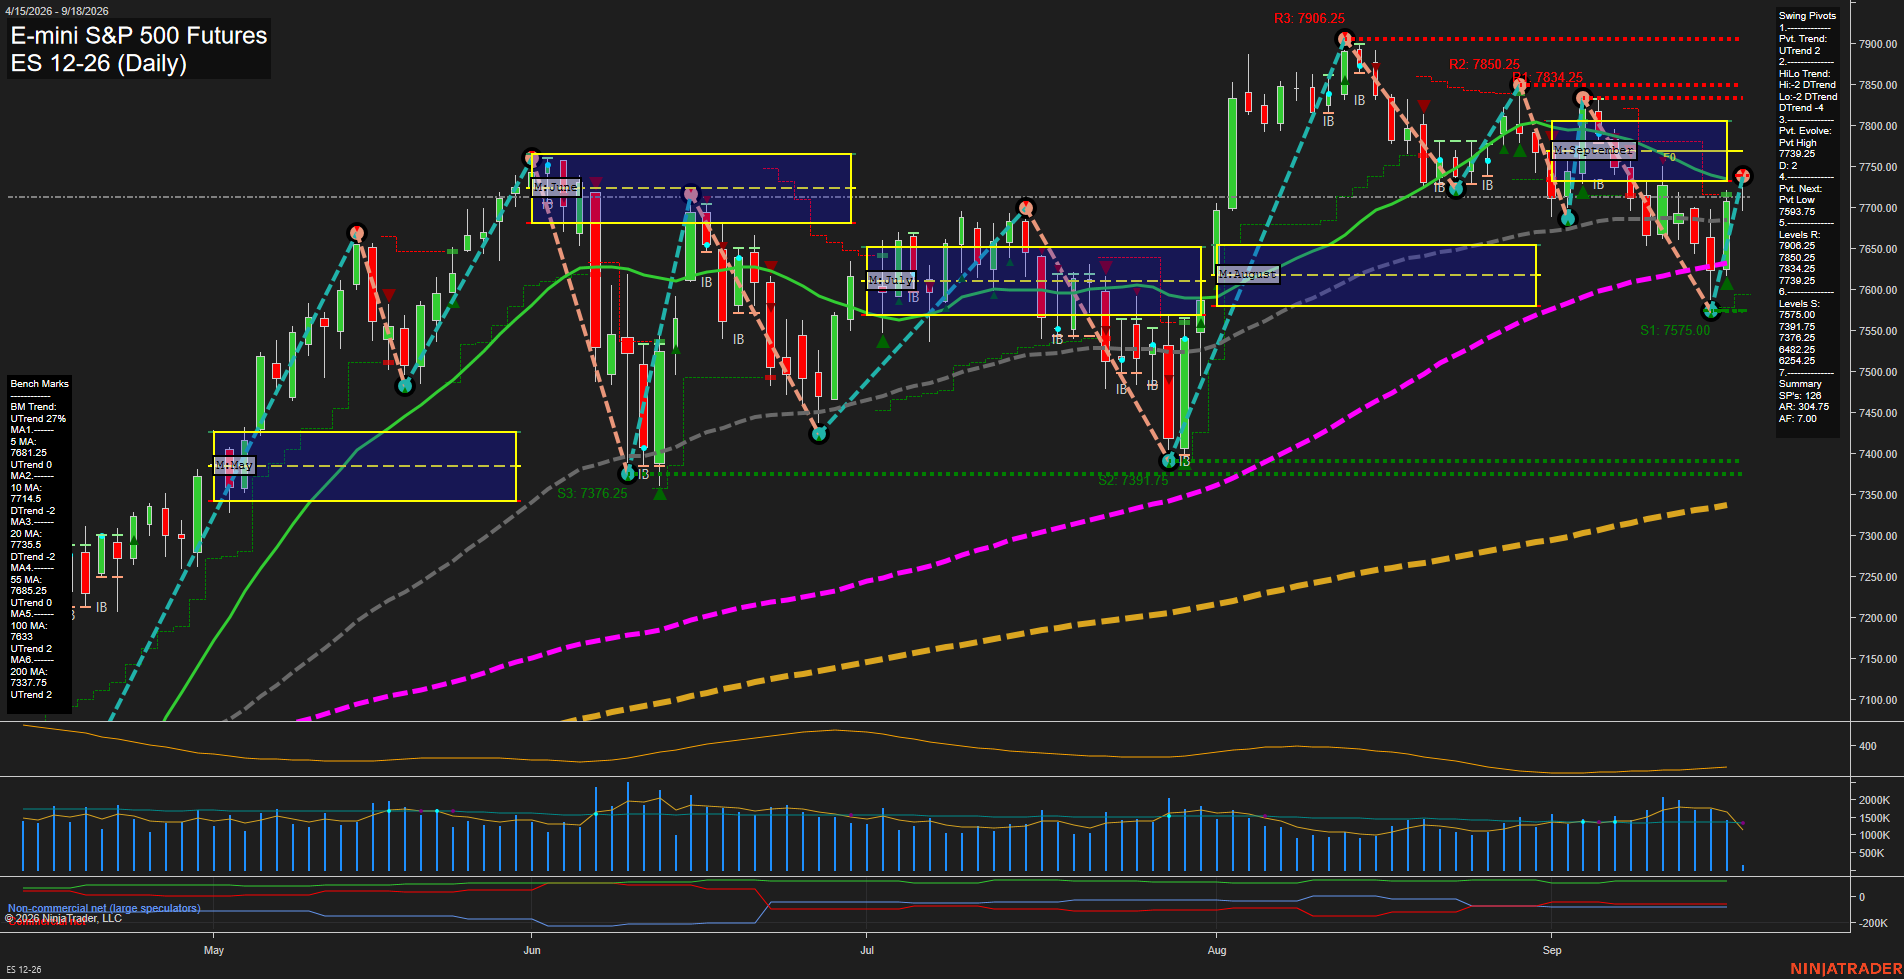
- ES: YSFG up, MSFG down, WSFG up; UTrend pivots, 7548.75 support, 7739.25/7906.25 resistance; above major benchmarks.
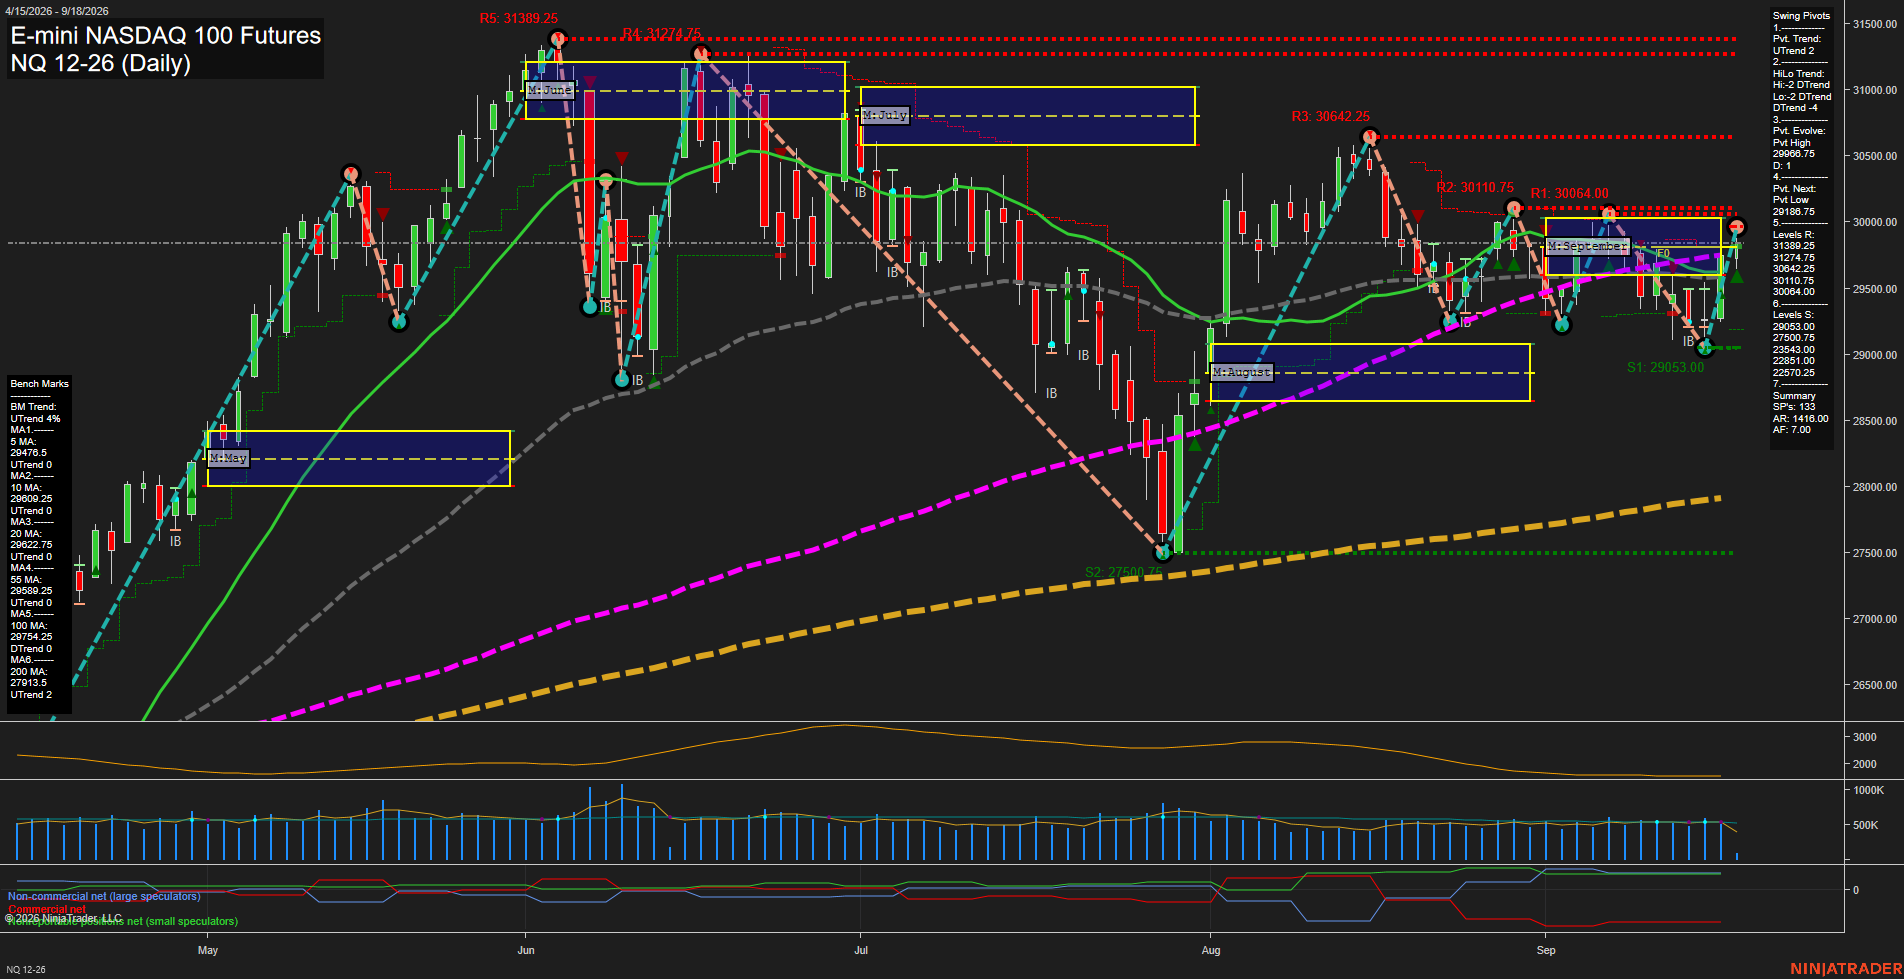
- NQ: YSFG/MSFG/WSFG up; short-term UTrend, 29188.75 reversal support, 30064.00-30110.75 resistance; above primary benchmarks.
- YM: YSFG up, MSFG/WSFG down; DTrend pivots, 51609/51689 support, 52747-53977 resistance; below short-term benchmarks.
- EMD: YSFG up, MSFG/WSFG down; DTrend pivots, 3636.2 support, 3725.2/3838.2 resistance; below short benchmarks, above 200-period levels.
- RTY: YSFG up, MSFG/WSFG down; DTrend pivots, 2850-2851.9 support, 2927.1/3023.7 resistance; short benchmarks declining.
- FDAX: YSFG up, MSFG/WSFG down; weekly DTrend, 25362 support, 25990 and 26778-26847 resistance; above rising long-term benchmarks.
Overall State
- Short-Term: Bearish
- Intermediate-Term: Bearish
- Long-Term: Bullish
Conclusion
NQ maintains aligned bullish YSFG, MSFG, and WSFG structure, while ES retains yearly and weekly strength despite a declining monthly grid. YM, EMD, RTY, and FDAX show correlated short-term and intermediate pullbacks: MSFG and WSFG remain below F0% areas, with DTrend conditions and price beneath shorter benchmarks. Long-term structure remains upward across the group through rising 55-, 100-, and 200-period benchmarks and generally upward yearly grids. Key swing supports are ES 7548.75, NQ 29188.75, YM 51609, EMD 3636.2, RTY 2850, and FDAX 25362.
Note: Intra-day counter-trend pullbacks or retracements may occur, HTF is context for informational usage and market structure. Glossary: Session Fib Grids periods of YSFG:’Yearly’, MSFG:’Monthly’, WSFG:’Weekly’
For full details visit: AlphaWebTrader Technicals
ES Daily View
Overall Rating
- Short-Term: Bullish
- Intermediate-Term: Bearish
- Long-Term: Bullish.
Key Insights Summary
The daily chart shows a sharp V-shaped recovery from the 7593.75 pivot low, with large upside price action returning above the weekly F0% area and restoring the short-term pivot trend to UTrend. Price is testing the 7739.25 pivot-high resistance and the declining 20-day benchmark near 7735.5, creating a key near-term decision area. The intermediate structure remains corrective: the September MSFG is below F0%, the HiLo trend is DTrend, and overhead resistance is layered at 7834.25, 7850.25, and 7906.25. Longer-term structure remains constructive because price holds above the rising 55-, 100-, and 200-day benchmarks, while the yearly grid remains positive. The short-term long signals contrast with the intermediate MSFG short signal, characterizing the current advance as a strong countertrend rebound within a still-developing monthly pullback.
View charts on: AlphaWebTrader HTF Charts
NQ Daily View
Overall Rating
- Short-Term: Bullish
- Intermediate-Term: Bullish
- Long-Term: Bullish.
Key Insights Summary
NQ has resumed a short-term upswing from the September pullback, with price above the rising 5-, 10-, 20-, 55-, and 200-day benchmarks. The pivot structure is short-term UTrend, although the intermediate HiLo structure remains DTrend after the August-to-September corrective sequence. Price is pressing the 30064.00 to 30110.75 resistance band following a recovery from 29053.00 support; a sustained move through that band would complete the recent higher-low recovery pattern, while the 29188.75 pivot-reversal level defines the nearby structural downside boundary. The 100-day average remains in a down trend, indicating that the longer-duration advance still contains an intermediate consolidation component beneath the August highs.
View charts on: AlphaWebTrader HTF Charts
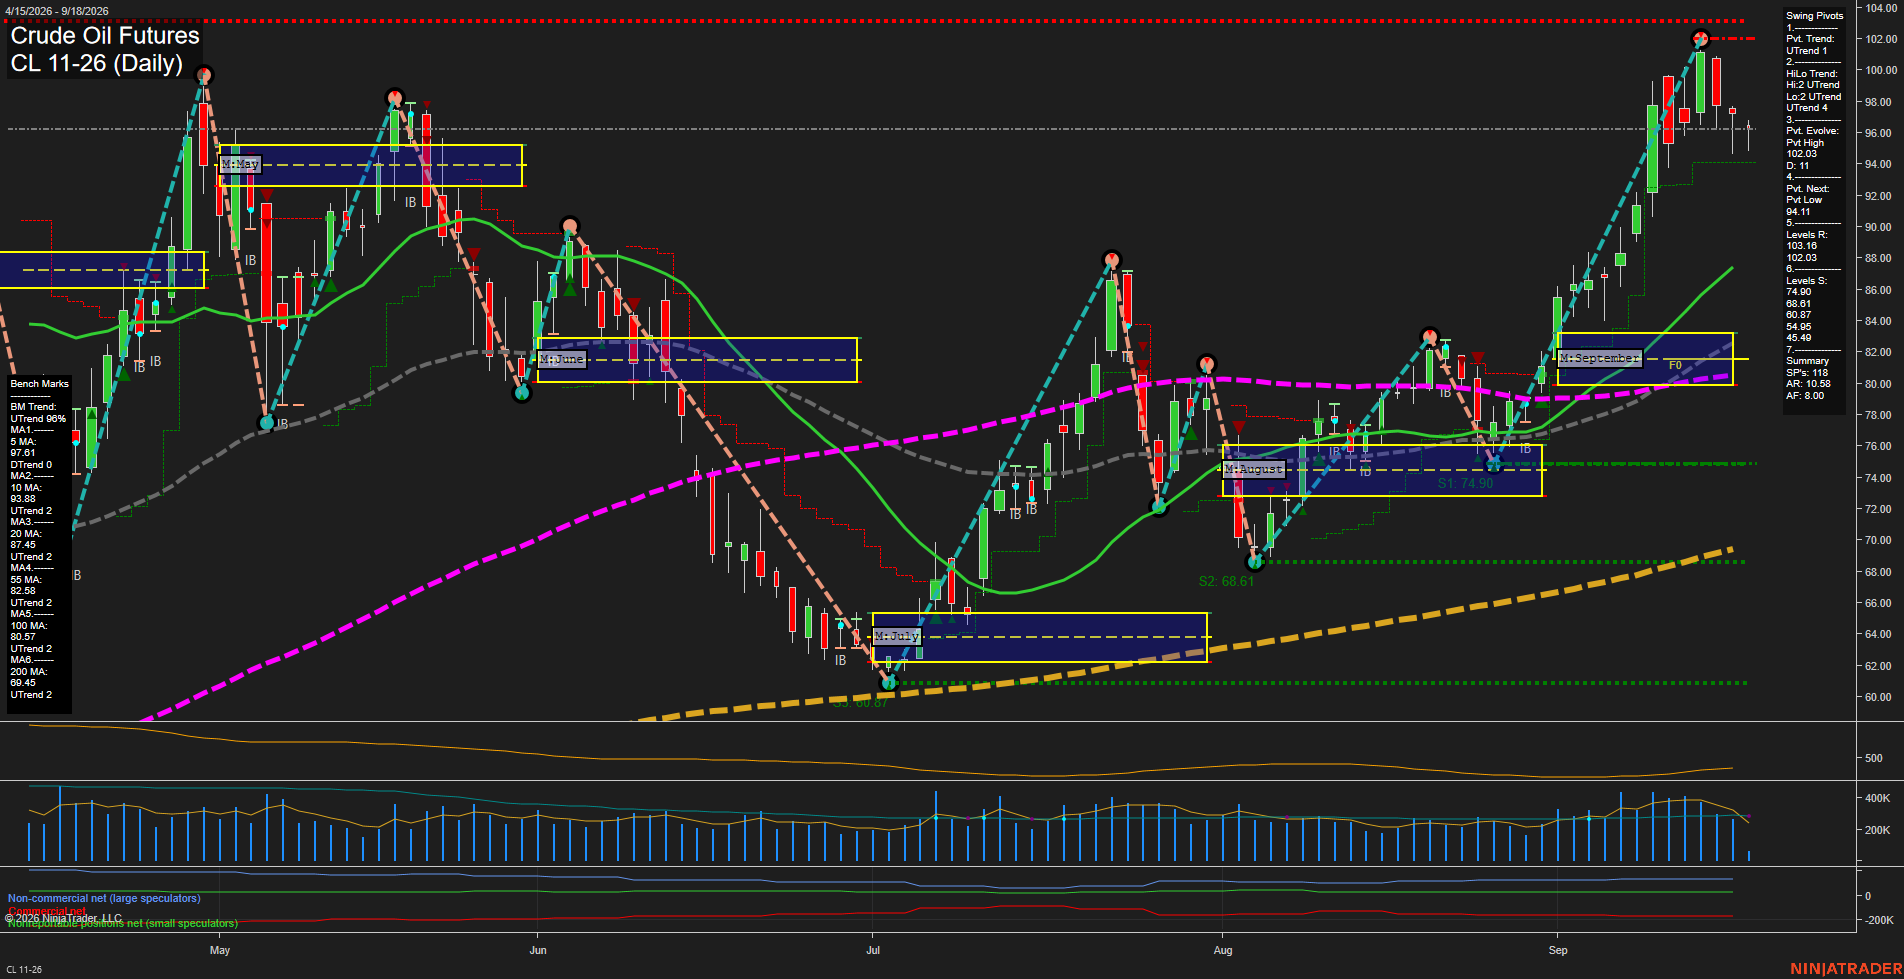
CL Daily View
Overall Rating
- Short-Term: Neutral
- Intermediate-Term: Bullish
- Long-Term: Bullish.
Key Insights Summary
Price remains in a broad bullish daily structure, supported by rising 10-, 20-, 55-, 100-, and 200-day benchmarks and confirmed by both UTrend pivot measures. The September advance accelerated sharply into the 102.03 pivot high, then retraced toward 96.53, leaving short-term conditions mixed as price is below the declining 5-day average and below the weekly F0%/NTZ bias. The 94.11 pivot-low reversal level defines the near-term pullback structure, while 102.03 and 103.18 remain the principal overhead swing-resistance zone. The monthly and yearly Fib grids remain positive, framing the current weakness as a retracement within the larger advancing cycle rather than a confirmed intermediate or long-term trend reversal.
View charts on: AlphaWebTrader HTF Charts
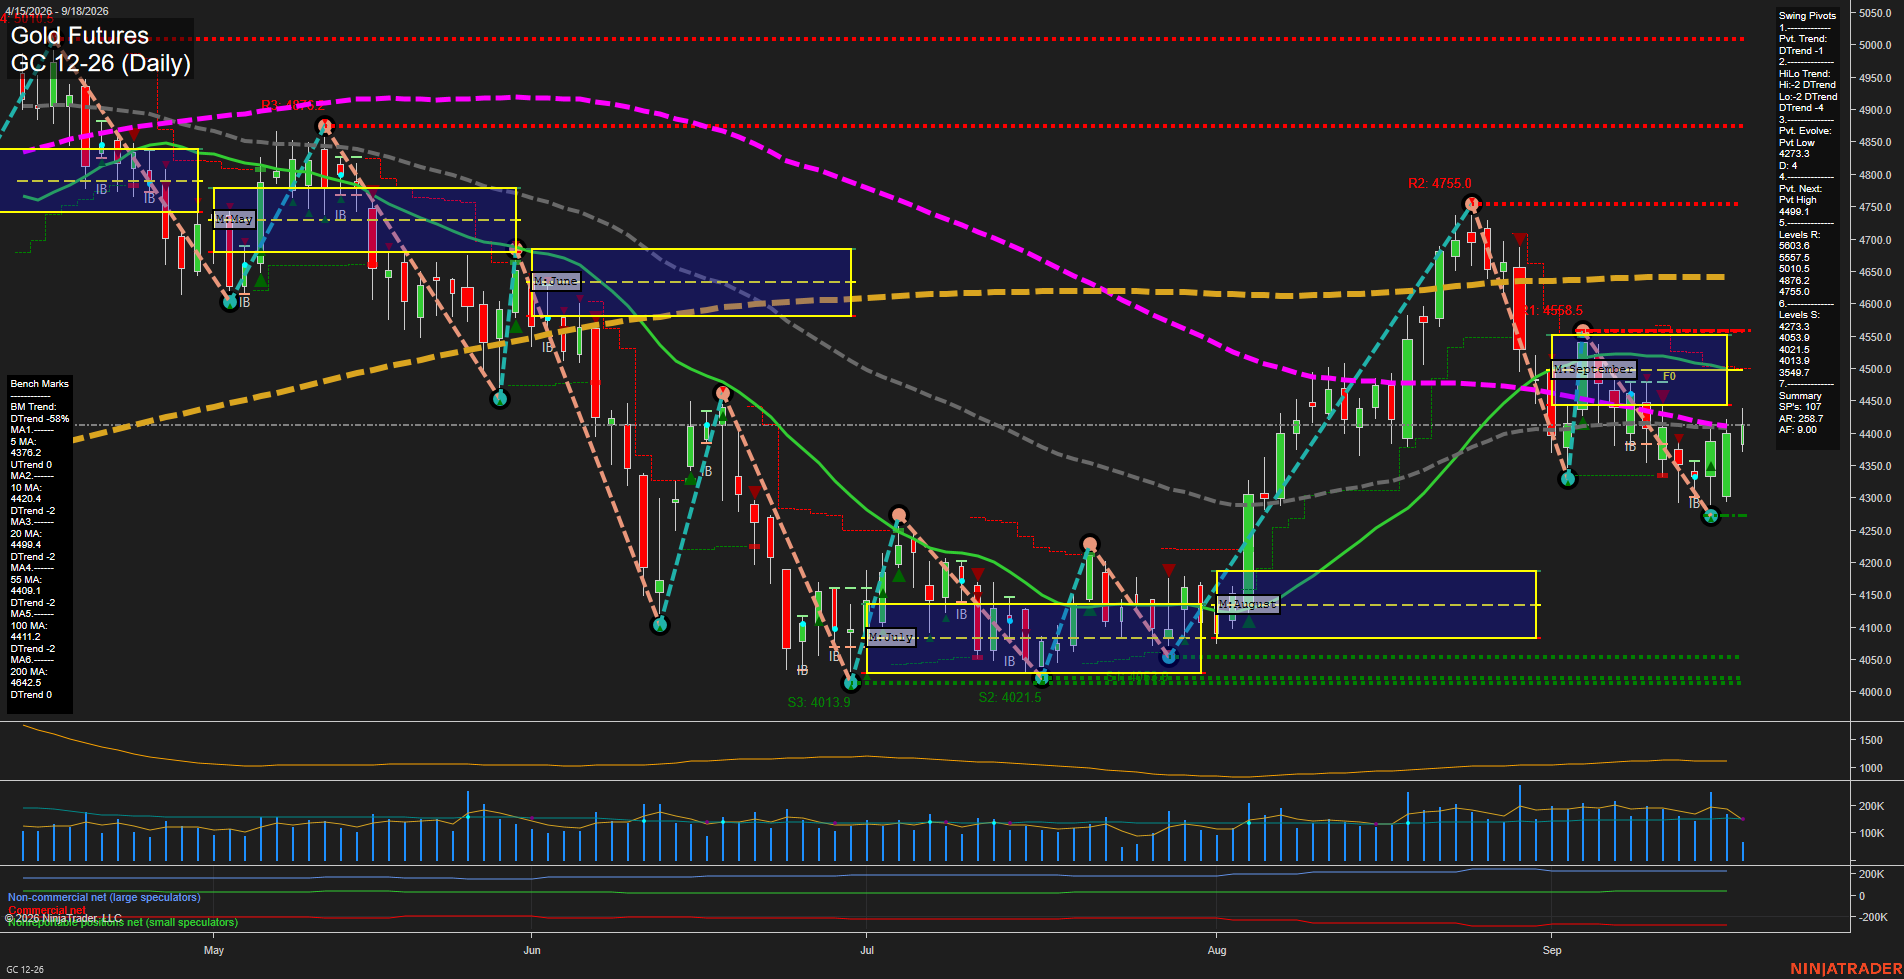
GC Daily View
Overall Rating
- Short-Term: Neutral
- Intermediate-Term: Bearish
- Long-Term: Bearish.
Key Insights Summary
Price has produced a sharp rebound from the 4273.3 pivot low, recovering above the rising 5-day benchmark and holding above the weekly F0% level. The short-term structure remains mixed because the active pivot trend is still down and price is clustered beneath the 10-day, 20-day, 55-day, and 100-day benchmarks. The September MSFG remains below F0% and the intermediate pivot sequence remains a downtrend, framing the recovery as a countertrend bounce within a broader corrective structure. The 4499.1 pivot-next level aligns closely with the 20-day benchmark and is the immediate upside structural reference, while 4273.3 is the nearest swing support. Longer-term conditions remain bearish with price materially below the declining 200-day benchmark near 4642.5.
View charts on: AlphaWebTrader HTF Charts
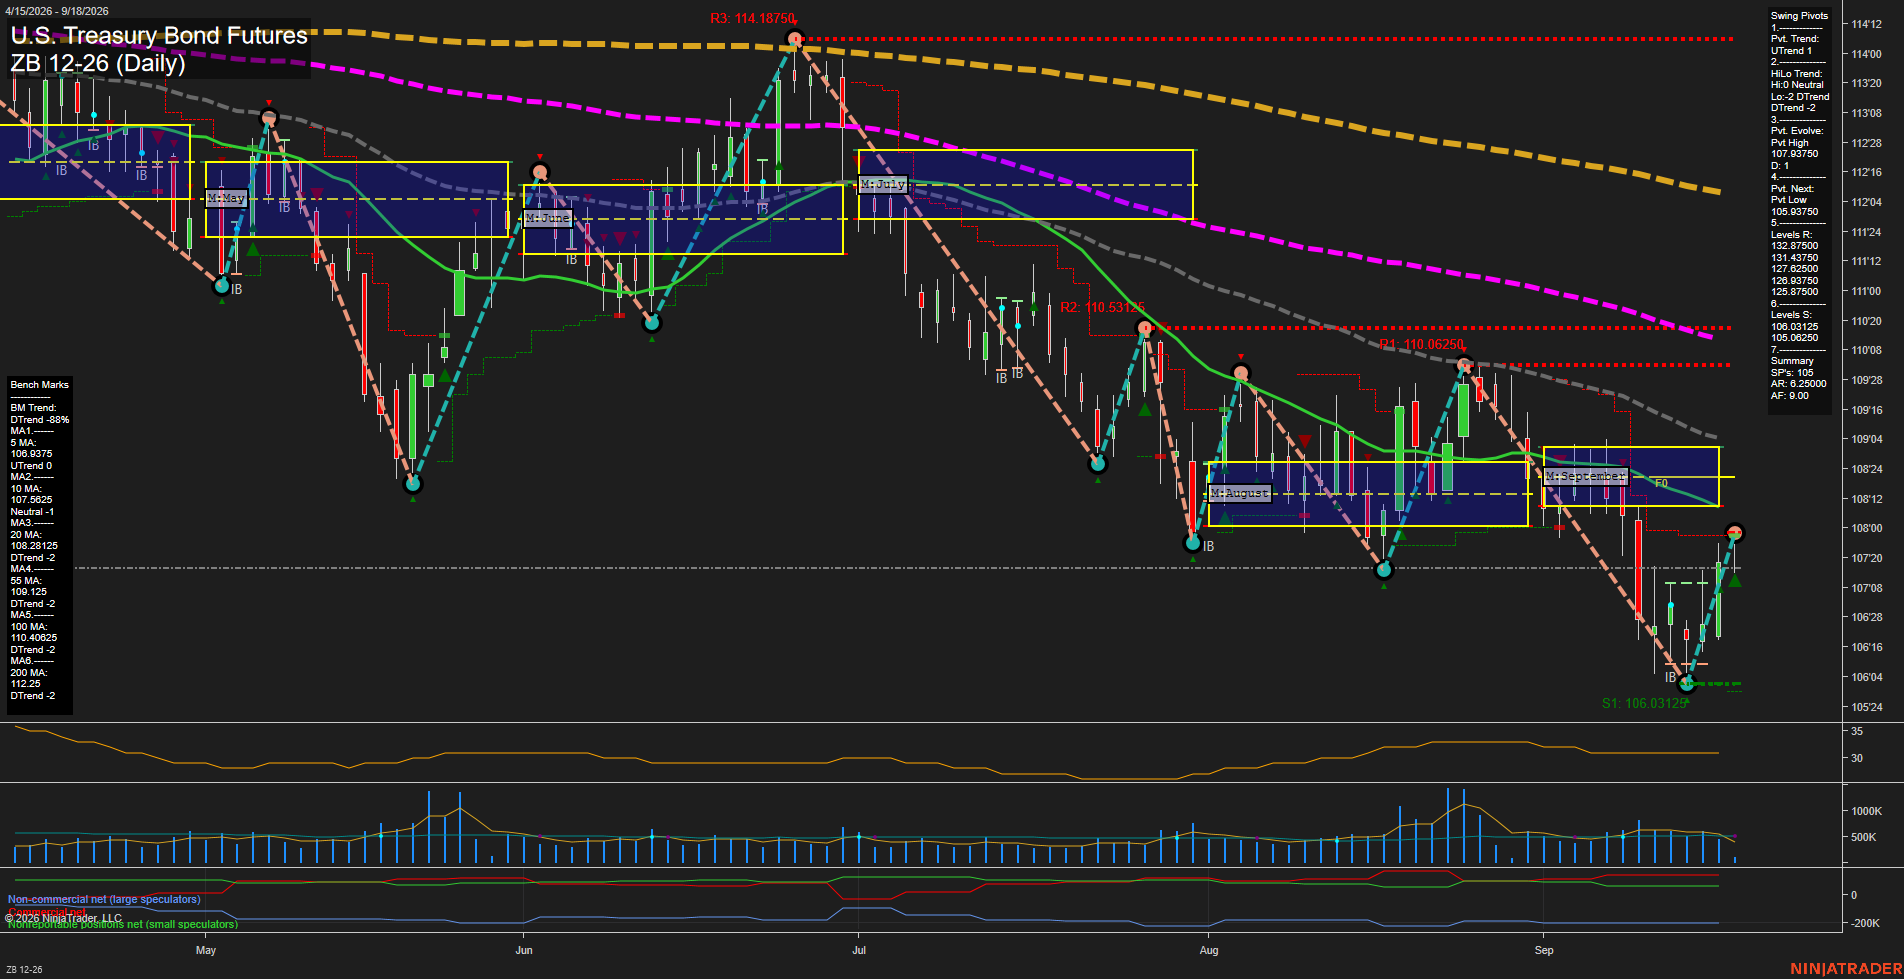
ZB Daily View
View charts on: AlphaWebTrader HTF Charts