U.S. stocks closed lower after the Fed raised rates to 3.75%-4.00%, while gold and oil fell and small caps lagged amid inflation and policy concerns.
Fundamentals: U.S. equities extended their recent slide after the Federal Reserve unanimously raised interest rates by 25 basis points and stressed that inflation remains too high. The Dow dropped 600 points, with small caps underperforming as the Russell 2000 ETF weakened. Gold and crude oil also declined, while bond yields and geopolitical risks remained key market factors.
Technicals: Market action reflected broad near-term weakness across equity index futures, with ES, NQ, YM, EMD, RTY and FDAX trading in corrective bearish structures below key short-term benchmarks. ETF leadership was mixed, led by gains in NVDA, META and TSLA, while DIA, MSFT and USO declined. Despite the pullback, most weekly and long-term trend measures retained a constructive bullish bias.
After Market Close daily snapshot: market news summary and sentiment, major ETFs, Magnificent 7 analysis, Indices Futures Higher Time Frame Analysis, and E-mini S&P500, Nasdaq 100, NYMEX Crude, Gold Futures Daily Chart analysis.
As of: September 16, 2026 05:00 CT
Market News Summary:
U.S. markets sold off after the Federal Reserve raised rates and emphasized that inflation remains too high.
Primary Drivers & Risks:
- Primary Driver: Hawkish Federal Reserve rate hike
- Primary Risk: Persistent inflation and further tightening
Tone:
Risk-off, with elevated policy and rate sensitivity.
Stock Market / ETFs / Indices:
All three major U.S. equity indexes closed lower for the seventh time in eight sessions following the Fed decision and Chair Kevin Warsh’s inflation comments. The Dow fell 600 points, while small-cap stocks and the iShares Russell 2000 ETF underperformed amid the hawkish policy response. Communications showed signs of recovering from earlier-year underperformance, while AI-related cybersecurity growth remained a company-specific positive.
Geopolitical:
Geopolitical tensions remain a market concern alongside rising bond yields. AI competition is a focus ahead of Trump-Xi talks, while U.S. arms-sale policy involving Israel remains under political debate.
Oil / Energy:
WTI and Brent crude retreated as Saudi Arabia planned to restart half of the East-West Pipeline. Separately, Continental Resources signed a deal to explore Venezuelan oil fields as U.S. efforts seek to revive the country’s oil sector.
Gold / Metals:
Gold initially rebounded before the Fed decision but fell to $4,310 per ounce after the quarter-point hike and signals of further tightening. Gold and silver weakened further after Warsh stressed inflation risks; technical commentary cited broken 50-day support in gold alongside a falling-wedge pattern.
Fed / Financials:
The FOMC voted 12-0 to raise the federal funds rate by 25 basis points to 3.75%-4.00%, the first increase since 2023. Most policymakers indicated another 2026 hike, though officials projected limited additional tightening. Warsh cited robust capital investment and productivity growth, including AI-driven investment, while maintaining that inflation remains too high. Bond yields fell after the decision, even as French yields rose amid fiscal-deficit concerns.
Macro / Other:
Persistent fiscal deficits, sovereign debt growth, and geopolitical fragmentation supported discussion of gold and Bitcoin as alternative assets. The rate decision occurred amid debate over whether inflation trends justify a pause and amid public pressure from President Trump for substantially lower rates.
Conclusion:
The Fed’s unanimous rate hike and inflation-focused guidance drove the session’s equity and metals weakness. Small caps absorbed notable pressure, while broad indexes extended their recent decline.
Further-tightening signals, bond-market moves, and geopolitical tensions remain key cross-currents. Oil prices weakened on Middle East pipeline developments, while sovereign-debt concerns continued to support alternative-asset discussion.
Market News Sentiment
Market News Articles: 56
- Neutral: 57.14%
- Negative: 26.79%
- Positive: 16.07%
Sentiment Summary: Among 56 market news articles, sentiment was 57% neutral, 27% negative, and 16% positive.
Conclusion: News tone for indices futures day traders was predominantly neutral, with negative coverage exceeding positive coverage.
GLD,Gold Articles: 14
- Positive: 42.86%
- Negative: 35.71%
- Neutral: 21.43%
Sentiment Summary: GLD and gold coverage is mixed, with 43% positive, 36% negative, and 21% neutral articles across 14 reports.
Conclusion: Gold-related news tone is slightly positive overall, with meaningful negative coverage remaining.
USO,Oil Articles: 11
- Neutral: 63.64%
- Negative: 36.36%
Sentiment Summary: USO and oil coverage is predominantly neutral at 64%, with 36% negative sentiment across 11 articles.
Conclusion: For indices futures day traders, oil-related news tone is mostly neutral, while negative coverage remains a notable minority.
Market Data Snapshot
ETF Snapshot of major stock market ETFs, Mag7, and others as of: September 16, 2026 05:00
Top Movers & Losers
- NVDA 213.90 Bullish 0.82% ▲
- META 673.31 Bullish 0.46% ▲
- TSLA 358.08 Bullish 0.42% ▲
- DIA 515.22 Bearish -1.15% ▼
- MSFT 490.30 Bearish -1.37% ▼
- USO 156.17 Bearish -3.52% ▼
Major Index ETFs: SPY, QQQ, DIA, IWM, IJH
- QQQ 704.72 Bullish 0.03% ▲
- IWM 283.92 Bearish -0.43% ▼
- SPY 754.05 Bearish -0.44% ▼
- IJH 72.80 Bearish -0.59% ▼
- DIA 515.22 Bearish -1.15% ▼
Major index ETFs were Bearish overall: QQQ was the most bullish mover and near-flat at +0.03%, while DIA was the most bearish mover at -1.15%. SPY declined -0.44%, IWM fell -0.43%, and IJH lost -0.59%, showing broader Bearish pressure outside QQQ.
Mag 7 Stocks: AAPL, MSFT, GOOG, AMZN, META, NVDA, TSLA
- NVDA 213.90 Bullish 0.82% ▲
- META 673.31 Bullish 0.46% ▲
- TSLA 358.08 Bullish 0.42% ▲
- AAPL 332.41 Bullish 0.32% ▲
- GOOG 339.36 Bearish -0.61% ▼
- AMZN 245.96 Bearish -0.99% ▼
- MSFT 490.30 Bearish -1.37% ▼
Mixed: NVDA is the most bullish mover at +0.82%, followed by META at +0.46%, TSLA at +0.42%, and AAPL at +0.32%. MSFT is the most bearish mover at -1.37%, with AMZN down -0.99% and GOOG down -0.61%.
Cross-Market ETFs: TLT, GLD, USO, IBIT
- TLT 80.88 Bullish 0.21% ▲
- IBIT 43.04 Bearish -0.16% ▼
- GLD 391.74 Bearish -0.61% ▼
- USO 156.17 Bearish -3.52% ▼
Mixed cross-market snapshot: TLT is the most bullish mover at +0.21%, while USO is the most bearish mover at -3.52%. GLD is Bearish at -0.61%, and IBIT is marginally Bearish at -0.16%.
ETF, Mag7, and Cross-Market ETF Insights
Overall Tone
Mixed tone: Mag7 leadership was Bullish while broad equity ETFs and cross-market commodities were Bearish.
Equity ETFs and Mag7:
Major Index ETFs were broadly Bearish, led lower by DIA at -1.15%, followed by IJH at -0.59%, SPY at -0.44%, and IWM at -0.43%; QQQ was marginally Bullish at +0.03%. Mag7 action was selective, with NVDA the most bullish mover at +0.82%, while MSFT was the most bearish mover at -1.37%; META, TSLA, and AAPL were Bullish, while GOOG and AMZN were Bearish. Equity performance was therefore Mixed rather than broadly aligned.
Cross-Market ETFs:
Cross-market ETFs were Mixed: TLT was modestly Bullish at +0.21%, while IBIT at -0.16% and GLD at -0.61% were Bearish. USO was the most bearish cross-market mover and the broad snapshot’s largest decline at -3.52%, contrasting with the modest Bullish move in TLT.
Futures Indices – Higher Time Frame Analysis
Summary of the current state of US Indices Futures based on higher time-frame (HTF) technical analysis as of: 2026-09-16: 17:00 CT.
US Indices Futures
- ES YSFG up, MSFG/WSFG below F0%, bearish short signals; below 5-55D, above 100/200D; support 7643.50, resistance 7834.25-7906.25.
- NQ YSFG up, MSFG below F0%, WSFG above F0%; daily DTrend below 5-100D, above 200D; support 29107.25, resistance 29859.75-31389.25.
- YM YSFG up, MSFG/WSFG below centers; below 5-55D, above 100/200D; support 51908, reversal pivot 52990, resistance 54250-54884.
- EMD YSFG up, MSFG below F0%/NTZ, WSFG down; below 5-100D, above 200D; support 3655.1-3656.1, resistance 3742.1-3941.7.
- RTY YSFG up, MSFG/WSFG below centers; below 5-100D, above 200D; support 2850.0-2883.6, reversal pivot 3054.2, resistance 3101.8.
- FDAX YSFG up, MSFG below F0%, WSFG down; below 10-55D, above 100/200D; support 25180, reversal pivot 25724, resistance 26588-26665.
Overall State
- Short-Term: Bearish
- Intermediate-Term: Bearish
- Long-Term: Bullish
Conclusion
US index futures show synchronized short-term retracements, with daily pivot DTrends and monthly grid pressure across the group. ES, EMD, RTY, and FDAX retain active downside rotations; NQ weekly structure remains above weekly F0%. YSFG positioning and rising longer-duration benchmarks maintain broader bullish structure, while nearby pivot lows define current support and recent swing highs remain resistance.
Note: Intra-day counter-trend pullbacks or retracements may occur, HTF is context for informational usage and market structure. Glossary: Session Fib Grids periods of YSFG:’Yearly’, MSFG:’Monthly’, WSFG:’Weekly’
For full details visit: AlphaWebTrader Technicals
ES Daily View
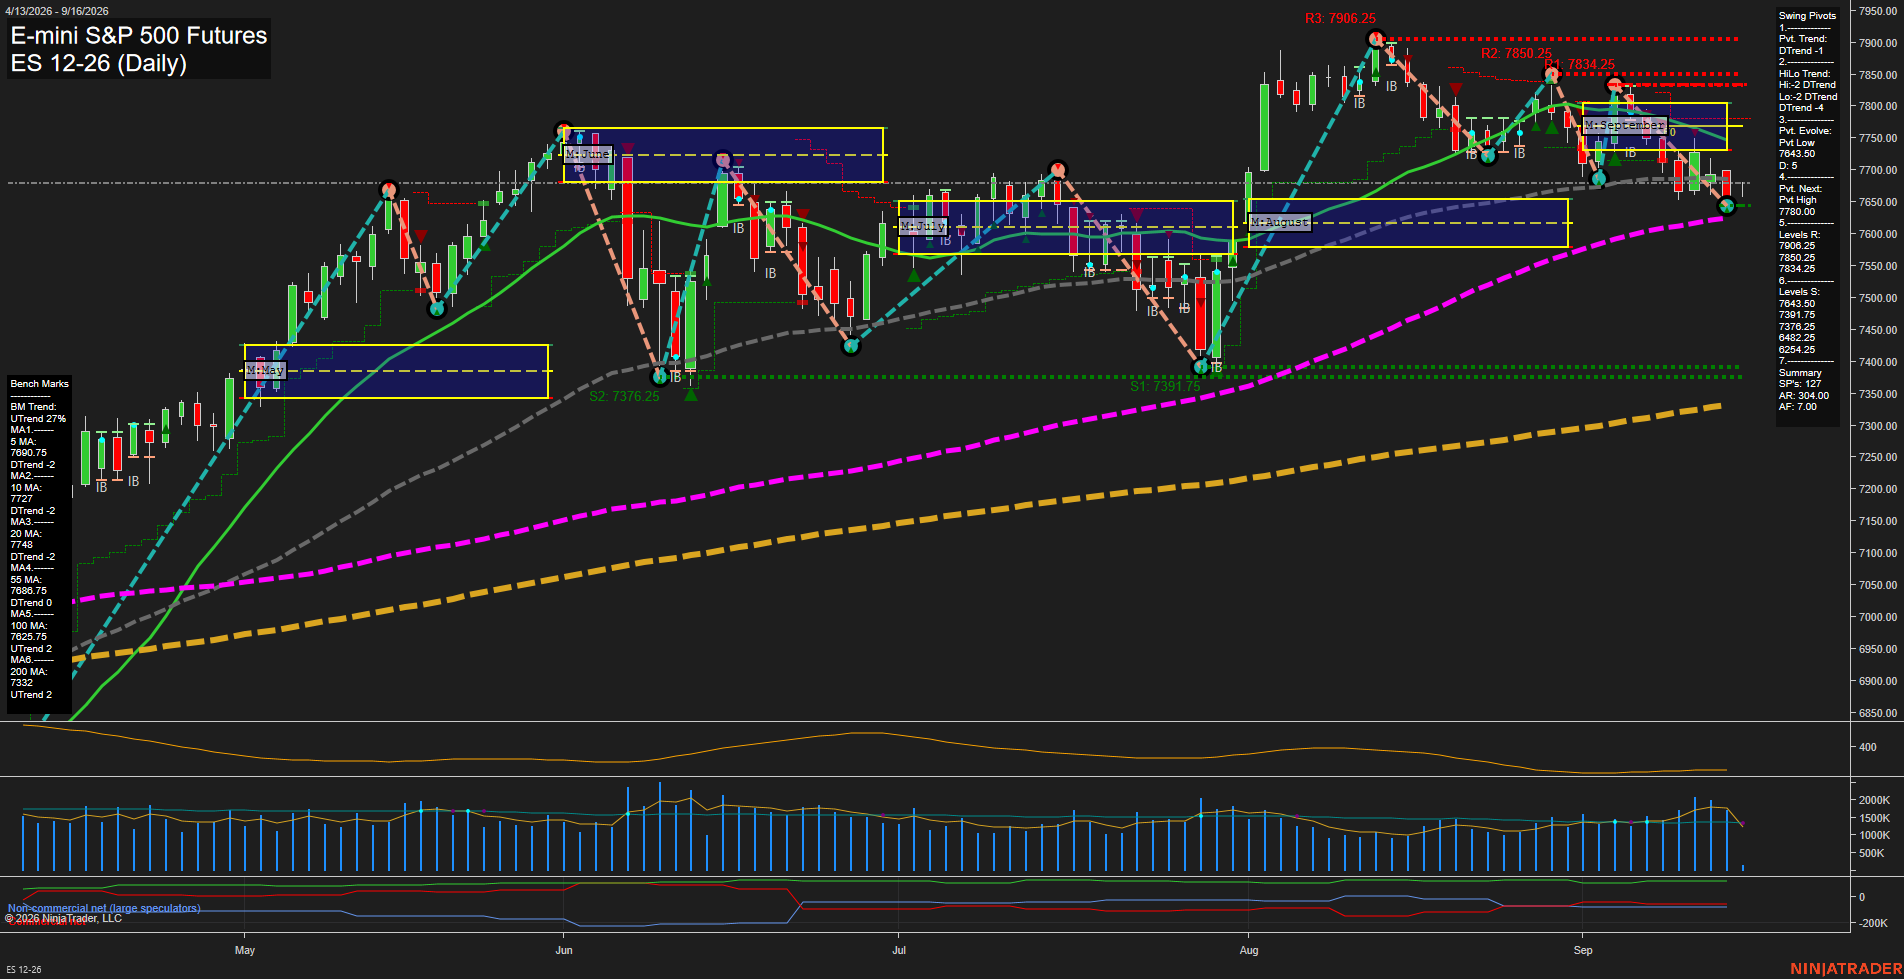
Overall Rating
- Short-Term: Bearish
- Intermediate-Term: Bearish
- Long-Term: Bullish.
Key Insights Summary
Price is in a fast short-term pullback from the August peak near 7906.25, with lower highs and lower lows confirming DTrend conditions in both pivot measures. The decline is trading beneath the 5, 10, 20, and 55-day benchmarks and below the September MSFG F0% area, reinforcing the intermediate corrective phase. The 7643.50 pivot-low area is the immediate structural support, while 7834.25, 7850.25, and 7906.25 define the overhead resistance ladder. Despite the current correction, the rising 100-day and 200-day benchmarks and positive yearly grid position preserve the broader long-term upward structure.
View charts on: AlphaWebTrader HTF Charts
NQ Daily View
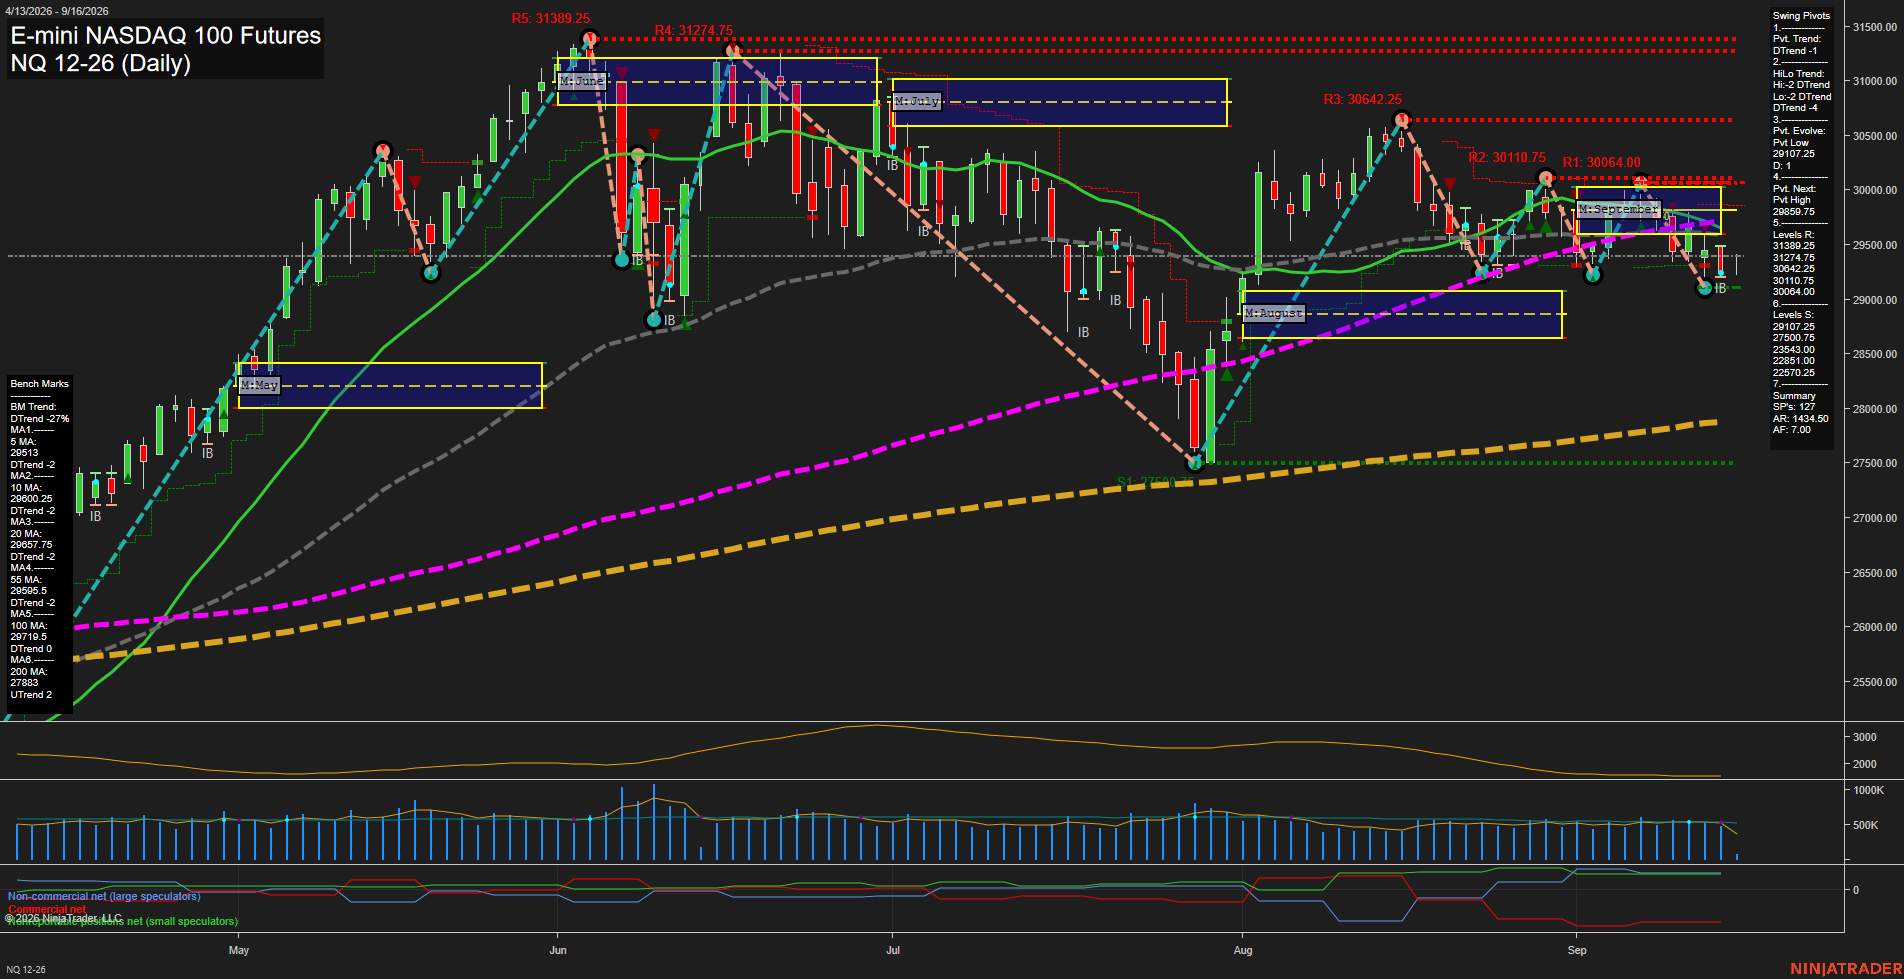
Overall Rating
- Short-Term: Bearish
- Intermediate-Term: Bearish
- Long-Term: Bullish.
Key Insights Summary
Price is consolidating below the declining 5, 10, 20, 55, and 100-day benchmarks, while the pivot structure remains in a short- and intermediate-term DTrend. The September MSFG remains below its F0% area, framing the current action as a countertrend retracement within the broader yearly uptrend. Recent bars are relatively small and momentum has slowed following the rejection from the 30064.00 to 30110.75 resistance zone. The 29107.25 pivot-low support is the immediate structural reference, while 29859.75 is the next pivot-reversal threshold; the rising 200-day average and positive yearly grid preserve the longer-term bullish backdrop.
View charts on: AlphaWebTrader HTF Charts
CL Daily View
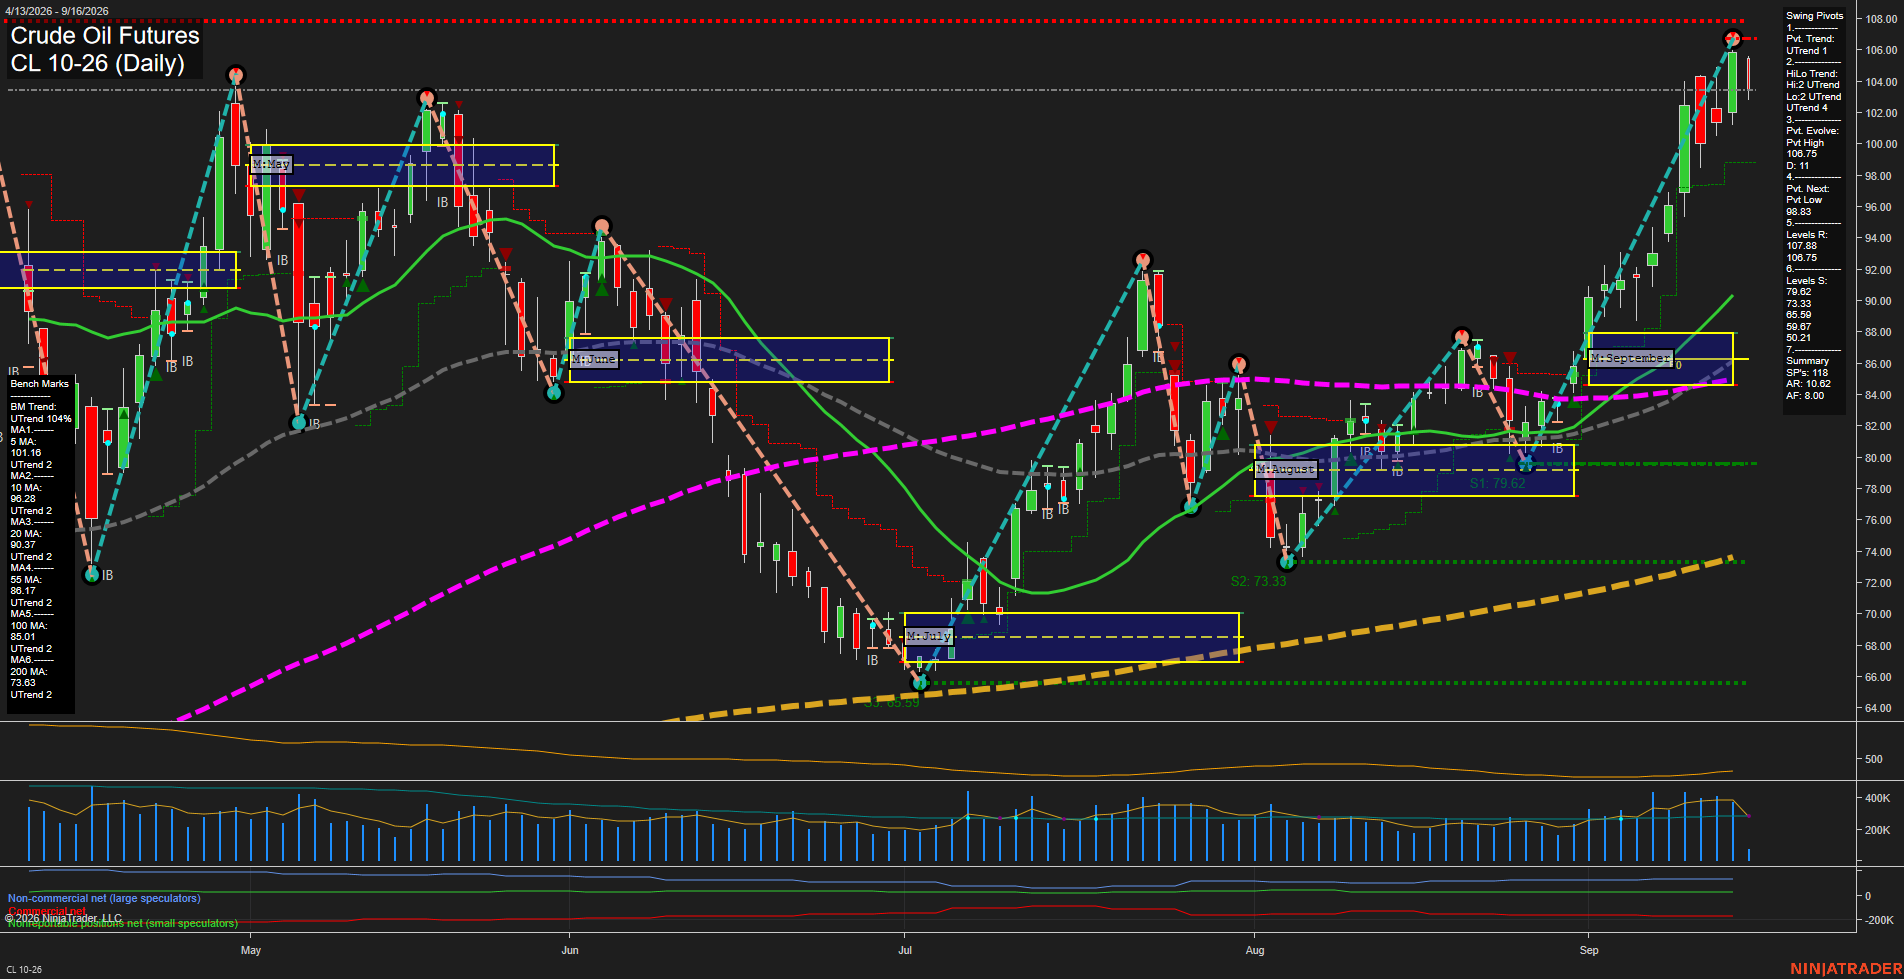
Overall Rating
- Short-Term: Bullish
- Intermediate-Term: Bullish
- Long-Term: Bullish.
Key Insights Summary
Price is in a fast, large-range upside expansion, closing near the evolving 106.75 pivot high after a sequence of higher highs and higher lows from the August low. Short-term and intermediate pivot structures are aligned upward, while price remains above every benchmark average and above the weekly, monthly, and yearly Fib-grid reference zones. The immediate structure is testing the 106.75 to 108.75 resistance area; 98.83 is the pivot-reversal reference, with the prior September grid and lower swing supports substantially beneath current price. Rising participation and elevated range behavior reflect a momentum-driven breakout phase rather than a quiet consolidation.
View charts on: AlphaWebTrader HTF Charts
GC Daily View
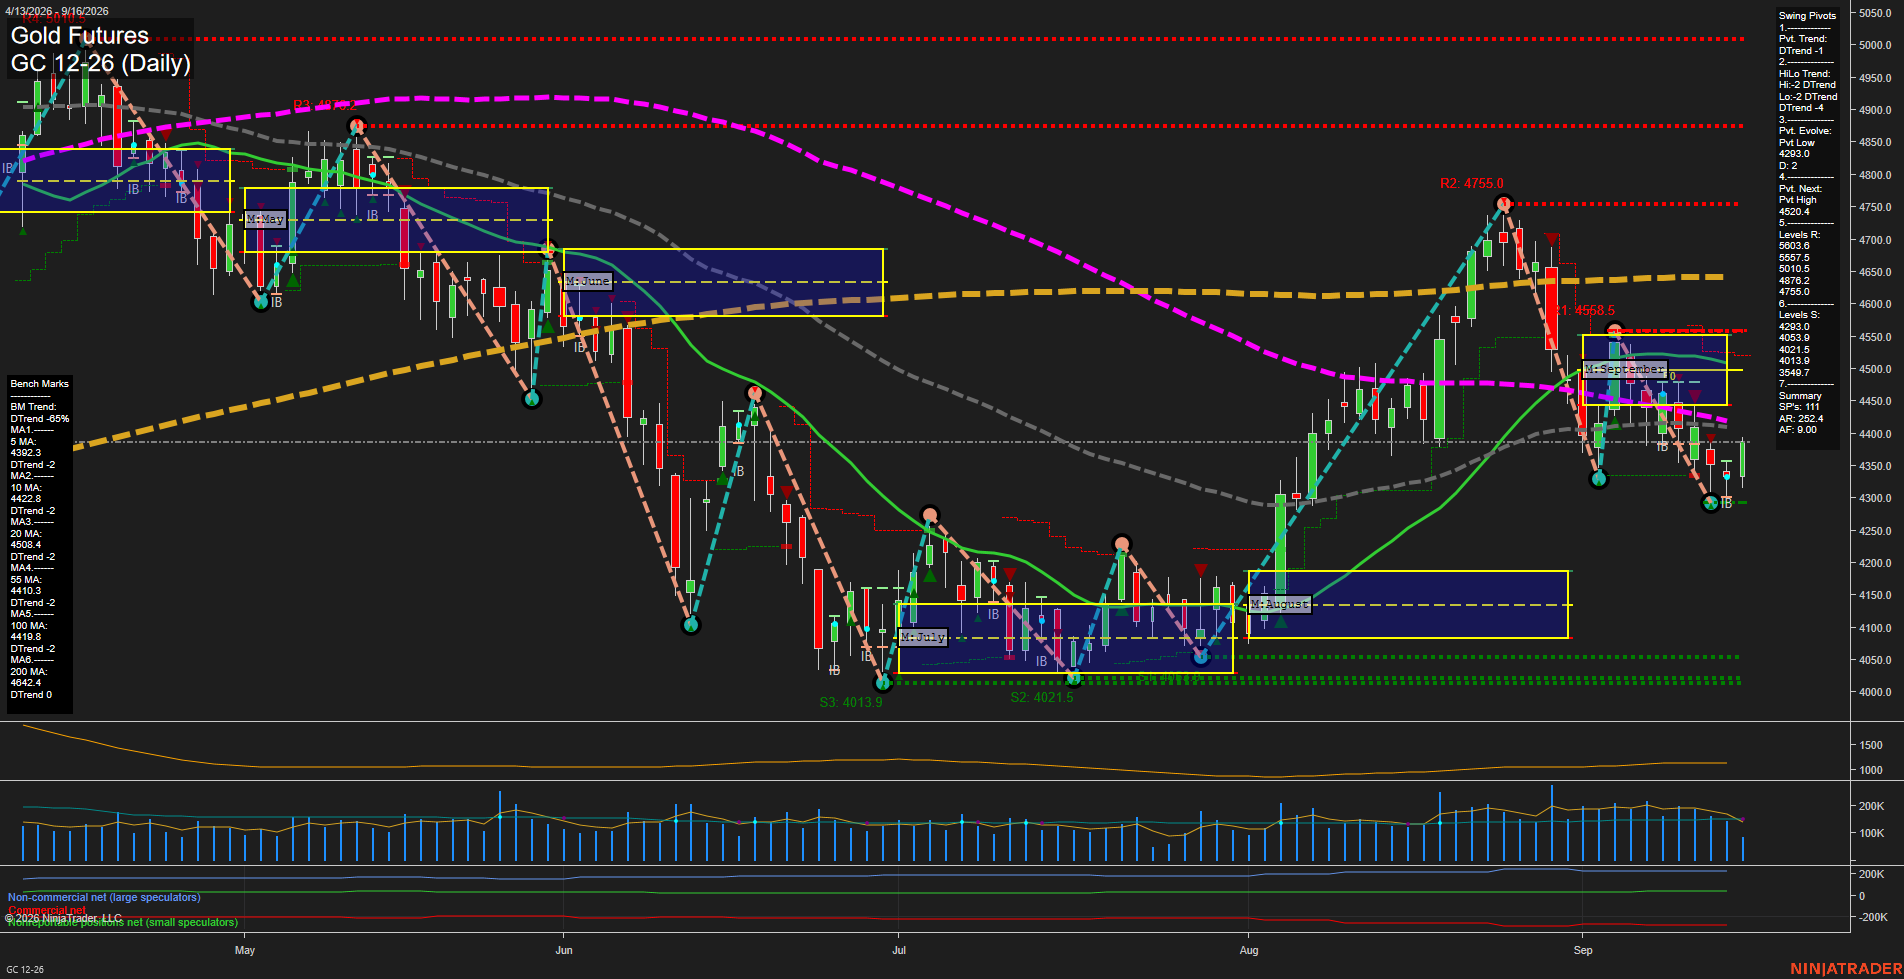
Overall Rating
- Short-Term: Bearish
- Intermediate-Term: Bearish
- Long-Term: Bearish.
Key Insights Summary
GC is consolidating after a sharp decline from the 4755 pivot high, with small daily bars and slowing momentum indicating a near-term balance phase. The weekly grid remains marginally constructive above its F0% level, but the monthly and yearly grids remain negative. Both pivot structures are in DTrend, price is below the 10-, 20-, 55-, and 200-day benchmarks, and the recent short-term and intermediate-term signals align with the prevailing bearish structure. The 4293.0 pivot low is the closest defined support, while 4410.3 to 4520.4 represents an overhead benchmark and pivot-resistance zone.
View charts on: AlphaWebTrader HTF Charts
ZB Daily View
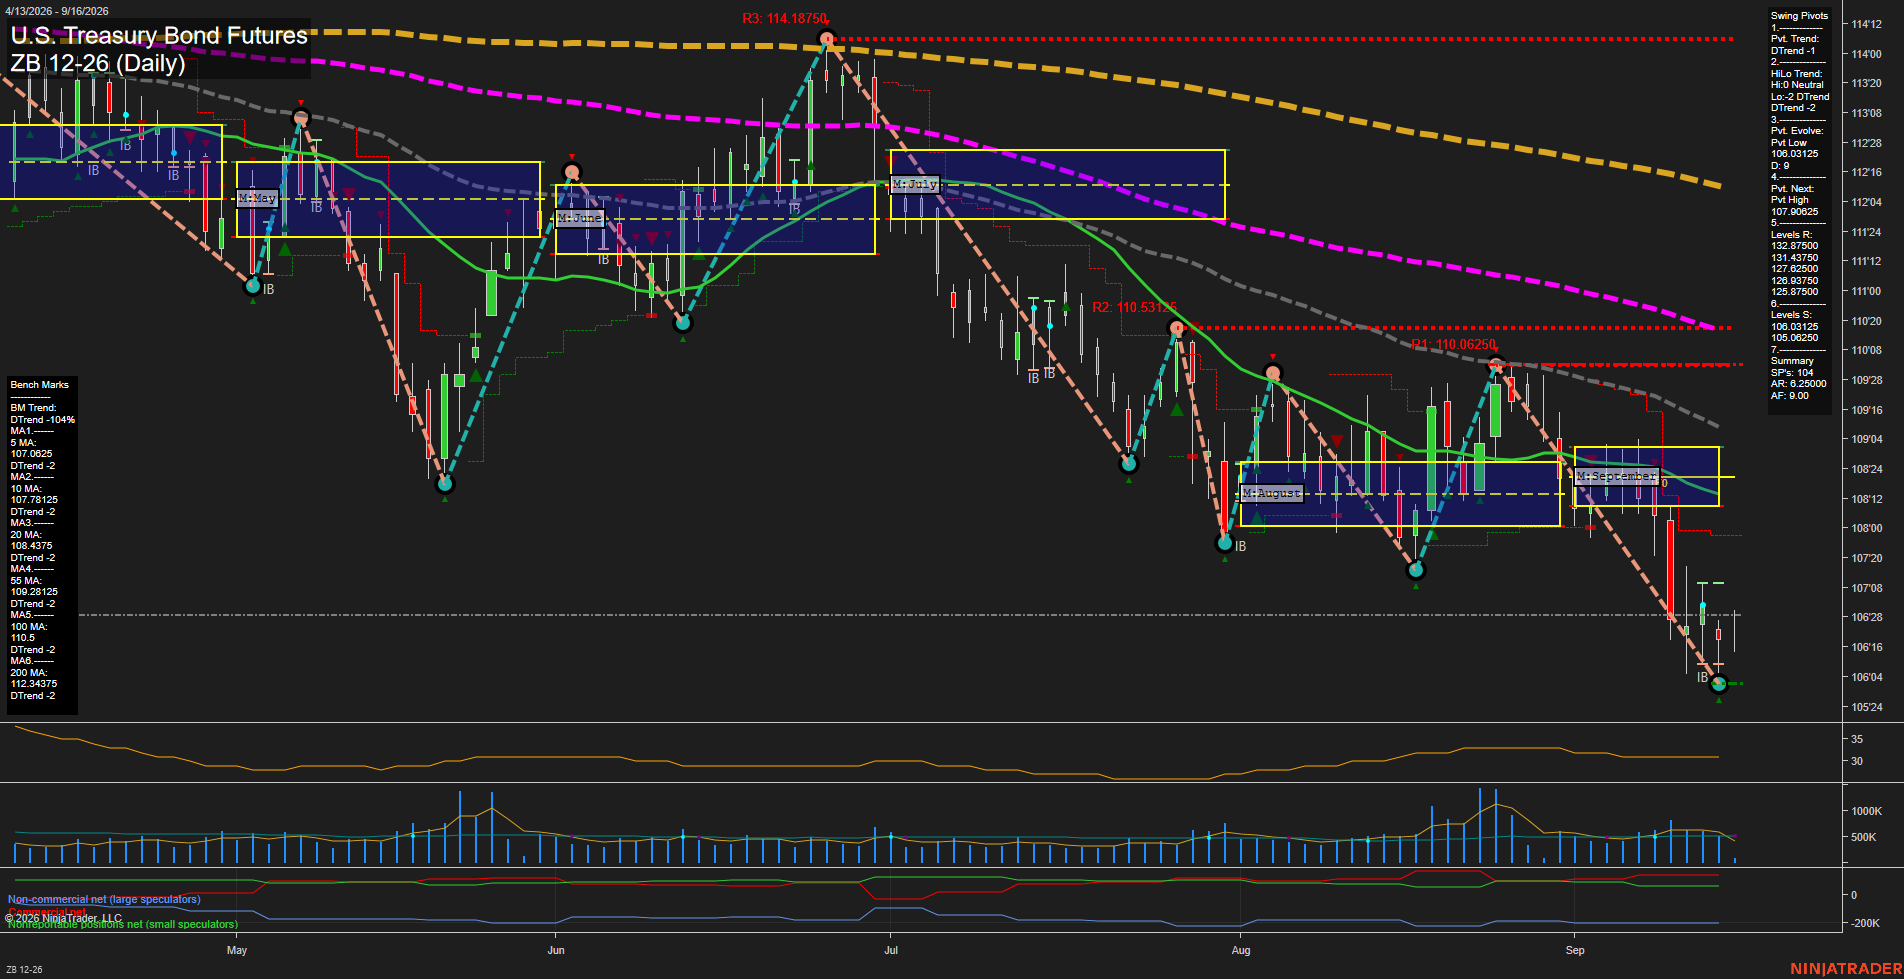
Overall Rating
- Short-Term: Bearish
- Intermediate-Term: Bearish
- Long-Term: Bearish.
Key Insights Summary
ZB remains in a broad bearish swing structure, with price trading beneath every daily benchmark and below the September MSFG/NTZ area. The recent sharp decline produced a new evolving pivot low near 106.03125, followed by a small rebound that remains below the 5-day and 10-day averages. Pivot structure shows lower highs and lower lows, while the next pivot-high reversal level near 107.90625 defines the nearest countertrend recovery threshold. The 106.03125 support area is the immediate downside reference, with 105.06250 the next major swing-support level. Recent short-term, weekly-grid, monthly-grid, and long-term trend signals remain aligned to the downside, although the compressed small bars following the selloff indicate a potential short-term stabilization phase after the fast momentum decline.
View charts on: AlphaWebTrader HTF Charts