U.S. stocks faced weak breadth as the 10-year yield topped 5%, oil neared resistance and markets priced a Fed rate increase, pressuring metals.
Fundamentals: Equity markets closed with a defensive tone as the 10-year Treasury yield reached about 5.04%, oil climbed toward WTI's $110 resistance area and interest-rate swaps reflected high odds of a Fed increase. The S&P 500 held near records, but 52-week lows outnumbered highs. Gold and silver eased as a firmer dollar and elevated yields weighed on non-yielding metals.
Technicals: USO, Meta and Nvidia advanced, while Microsoft, Amazon and IBIT declined. Futures analysis shows bearish short-term and mostly bearish intermediate conditions across ES, NQ, YM, EMD, RTY and FDAX following recent pullbacks from swing highs. Despite downside momentum, major contracts generally remain above long-term benchmarks, preserving broader bullish trend structures.
After Market Close daily snapshot: market news summary and sentiment, major ETFs, Magnificent 7 analysis, Indices Futures Higher Time Frame Analysis, and E-mini S&P500, Nasdaq 100, NYMEX Crude, Gold Futures Daily Chart analysis.
As of: September 15, 2026 05:00 CT
Market News Summary:
Equity-market weakness, a 10-year Treasury yield above 5%, rising oil, and a Federal Reserve decision dominated the session.
Primary Drivers & Risks:
- Primary Driver: Treasury yields above 5%
- Primary Risk: Oil-driven inflation and weak breadth
Tone:
Defensive, with elevated rate and inflation sensitivity.
Stock Market / ETFs / Indices:
The S&P 500 remained near record levels while 52-week lows exceeded highs, highlighting weak internal breadth. The Dow recorded its weakest first 10 trading days of September since 2008. Wells Fargo cut its S&P 500 year-end target amid technology and AI-sector concerns, while AI slowdown calls pressured chip and data-center-related shares.
Geopolitical:
Investors monitored Iran-war fallout alongside energy-market logistics. The U.S. also pressed Mexico on AI-hardware export rules intended to limit tariff circumvention by Chinese and other foreign firms.
Oil / Energy:
Oil prices climbed, with WTI testing the $110 resistance area. Rising energy costs contributed to inflation concerns, while Saudi Arabia’s East-West oil pipeline was set to reopen in days to support crude transport capacity.
Gold / Metals:
Gold and silver settled lower as higher crude prices, a firmer dollar, and the 10-year yield near 5% weighed on non-yielding metals. Gold held a cited support range near $4,254-$4,282, while market attention remained focused on the Fed decision.
Fed / Financials:
The 10-year Treasury yield reached a 19-year high around 5.04%, amid a global bond selloff tied to capital investment, energy prices, and inflation pressure. Interest-rate swaps priced more than a 90% probability of a 25-basis-point Fed rate increase from the 3.5%-3.75% range. Aon’s $13.5 billion bond offering drew roughly $65 billion in orders despite higher borrowing costs.
Macro / Other:
Higher yields reopened debate over whether the low-rate era has ended. Inflation gauges cited transportation, fertilizer, and refining-related prices as indicators pointing toward stronger price pressure, including a scenario of 6% inflation by November.
Conclusion:
Index futures faced pressure from the jump in long-term Treasury yields, elevated oil prices, and a Fed decision priced for a rate increase. Weak market breadth and technology-sector AI concerns added to equity sensitivity.
Energy inflation and geopolitical developments remained important cross-currents for rates and risk assets. Gold stayed constrained by the stronger dollar and high yields, despite its role as a reserve hedge.
Market News Sentiment
Market News Articles: 45
- Neutral: 48.89%
- Positive: 28.89%
- Negative: 22.22%
Sentiment Summary: Market news sentiment is neutral overall, with 49% neutral, 29% positive, and 22% negative coverage across 45 articles.
Conclusion: Indices futures day traders are facing a predominantly balanced news tone, with positive coverage modestly exceeding negative coverage.
GLD,Gold Articles: 14
- Negative: 42.86%
- Positive: 35.71%
- Neutral: 21.43%
Sentiment Summary: GLD/Gold coverage is slightly negative, with 43% negative, 36% positive, and 21% neutral articles.
Conclusion: The gold news tone is mixed but marginally negative, providing a cautious cross-market sentiment reference for index futures day traders.
USO,Oil Articles: 12
- Positive: 58.33%
- Negative: 25.00%
- Neutral: 16.67%
Sentiment Summary: USO/Oil coverage is moderately positive, with 58% positive, 25% negative, and 17% neutral articles.
Conclusion: Oil-related news sentiment is positive overall, with negative coverage representing one-quarter of articles.
Market Data Snapshot
ETF Snapshot of major stock market ETFs, Mag7, and others as of: September 15, 2026 05:00
Top Movers & Losers
- USO 161.86 Bullish 3.32% ▲
- META 670.24 Bullish 0.70% ▲
- NVDA 212.17 Bullish 0.57% ▲
- MSFT 497.12 Bearish -1.64% ▼
- AMZN 248.42 Bearish -2.02% ▼
- IBIT 43.11 Bearish -3.64% ▼
Major Index ETFs: SPY, QQQ, DIA, IWM, IJH
- SPY 757.39 Bearish -0.46% ▼
- DIA 521.23 Bearish -0.62% ▼
- QQQ 704.54 Bearish -0.65% ▼
- IJH 73.23 Bearish -0.76% ▼
- IWM 285.14 Bearish -0.96% ▼
Major Index ETFs were Bearish across the board: IWM led losses at -0.96%, followed by IJH at -0.76%, QQQ at -0.65%, DIA at -0.62%, and SPY as the least negative mover at -0.46%.
Mag 7 Stocks: AAPL, MSFT, GOOG, AMZN, META, NVDA, TSLA
- META 670.24 Bullish 0.70% ▲
- NVDA 212.17 Bullish 0.57% ▲
- AAPL 331.34 Bearish -0.52% ▼
- TSLA 356.58 Bearish -0.67% ▼
- GOOG 341.43 Bearish -1.24% ▼
- MSFT 497.12 Bearish -1.64% ▼
- AMZN 248.42 Bearish -2.02% ▼
Mixed: META is the most bullish mover at +0.70%, followed by NVDA at +0.57%. AMZN is the most bearish mover at -2.02%, with MSFT down -1.64% and GOOG down -1.24%. AAPL declined -0.52% and TSLA declined -0.67%.
Cross-Market ETFs: TLT, GLD, USO, IBIT
- USO 161.86 Bullish 3.32% ▲
- GLD 394.15 Bullish 0.33% ▲
- TLT 80.71 Bearish -0.27% ▼
- IBIT 43.11 Bearish -3.64% ▼
Mixed cross-market snapshot: USO is the most bullish mover at +3.32%, while GLD is modestly Bullish at +0.33%. IBIT is the most bearish mover at -3.64%, and TLT is modestly Bearish at -0.27%.
ETF, Mag7, and Cross-Market ETF Insights
Overall Tone
Mixed tone: broad equity ETFs were Bearish while oil, gold, and select Mag7 leadership remained Bullish.
Equity ETFs and Mag7:
Major Index ETFs were broadly Bearish, led lower by IWM at -0.96%, followed by IJH at -0.76%, QQQ at -0.65%, DIA at -0.62%, and SPY at -0.46%; SPY was the least negative major index ETF. Mag7 performance was selective: META at +0.70% was the most bullish Mag7 mover, followed by NVDA at +0.57%, while AMZN at -2.02% was the most bearish Mag7 mover, with MSFT at -1.64% and GOOG at -1.24% also Bearish. AAPL at -0.52% and TSLA at -0.67% aligned with the broader equity weakness.
Cross-Market ETFs:
Cross-market ETFs were Mixed, with USO at +3.32% as the most bullish mover and showing notable commodity strength versus Bearish equity ETFs. GLD gained +0.33%, while TLT was modestly Bearish at -0.27%; IBIT at -3.64% was the most bearish cross-market mover and diverged sharply from gold and oil.
Futures Indices – Higher Time Frame Analysis
Summary of the current state of US Indices Futures based on higher time-frame (HTF) technical analysis as of: 2026-09-15: 17:00 CT.
US Indices Futures
- ES YSFG/WSFG up, MSFG down; 20-week 7639 support, 7645 pivot support, 7780.75 reversal, 7834.25–7850.25 resistance, 7906.25 high.
- NQ YSFG/WSFG up, MSFG down; 29107.25 support, 29864.25 reversal, 30064.00–30110.75 resistance, 30842.25–31389.25 overhead pivots.
- YM YSFG up, WSFG/MSFG down; 52199 support and 20-week benchmark, 52990 reversal, 54330 pivot threshold, 54884 resistance.
- EMD YSFG up, WSFG/MSFG down; 3652.1–3656.1 support, 3743.7 reversal, 3856.3 pivot threshold, 3941.7 resistance.
- RTY YSFG up, WSFG/MSFG down; 2891.4 support, 2965.2 reversal, 3005.4 resistance, 3061.8–3102.0 overhead pivot zone.
- FDAX YSFG up, WSFG/MSFG down; 25180 support with 25388 100-day benchmark, 25726 reversal, 26660–26665 resistance.
Overall State
- Short-Term: Bearish
- Intermediate-Term: Bearish
- Long-Term: Bullish
Conclusion
US index futures show broad daily bearish alignment, with price generally below short- and intermediate-term benchmarks and MSFG centers. ES retains WSFG support, while NQ shows relative weekly strength. YM, EMD, RTY, and FDAX remain in corrective weekly swings. YSFG positioning and rising longer-term benchmarks maintain bullish long-term structure across the group.
Note: Intra-day counter-trend pullbacks or retracements may occur, HTF is context for informational usage and market structure. Glossary: Session Fib Grids periods of YSFG:’Yearly’, MSFG:’Monthly’, WSFG:’Weekly’
For full details visit: AlphaWebTrader Technicals
ES Daily View
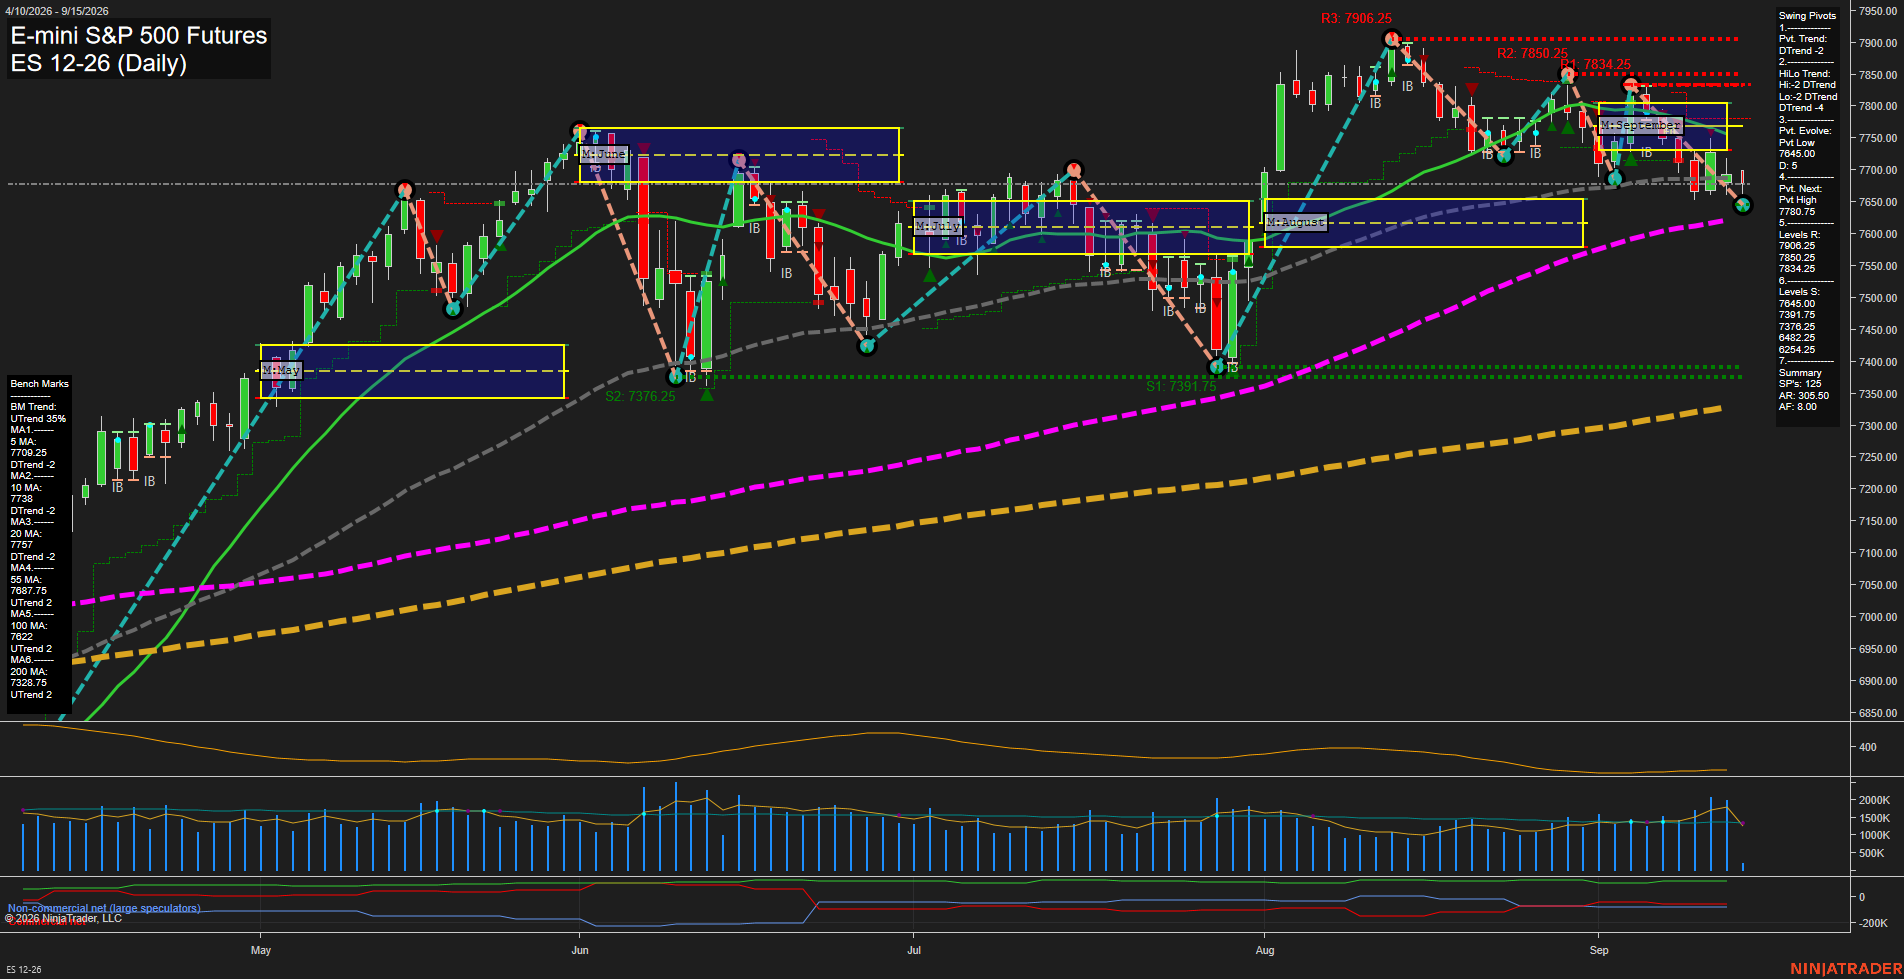
Overall Rating
- Short-Term: Bearish
- Intermediate-Term: Bearish
- Long-Term: Bullish.
Key Insights Summary
Price is consolidating near 7654.50 after a decline from the August high near 7906.25. Short-term pivot and HiLo structures are both in DTrend, while price remains below the 5-, 10-, 20-, and 55-day benchmarks. The weekly grid remains positive, but the September monthly grid is negative and price is below its monthly F0%/NTZ area, confirming a countertrend pullback within the broader yearly uptrend. The 7645.00 pivot-low area is the immediate structural support, while 7780.75 is the next pivot-reversal level and 7834.25 to 7850.25 forms the main overhead resistance band. Long-term structure remains constructive above rising 100- and 200-day averages, although current price action reflects a bearish, volatile retracement phase.
View charts on: AlphaWebTrader HTF Charts
NQ Daily View
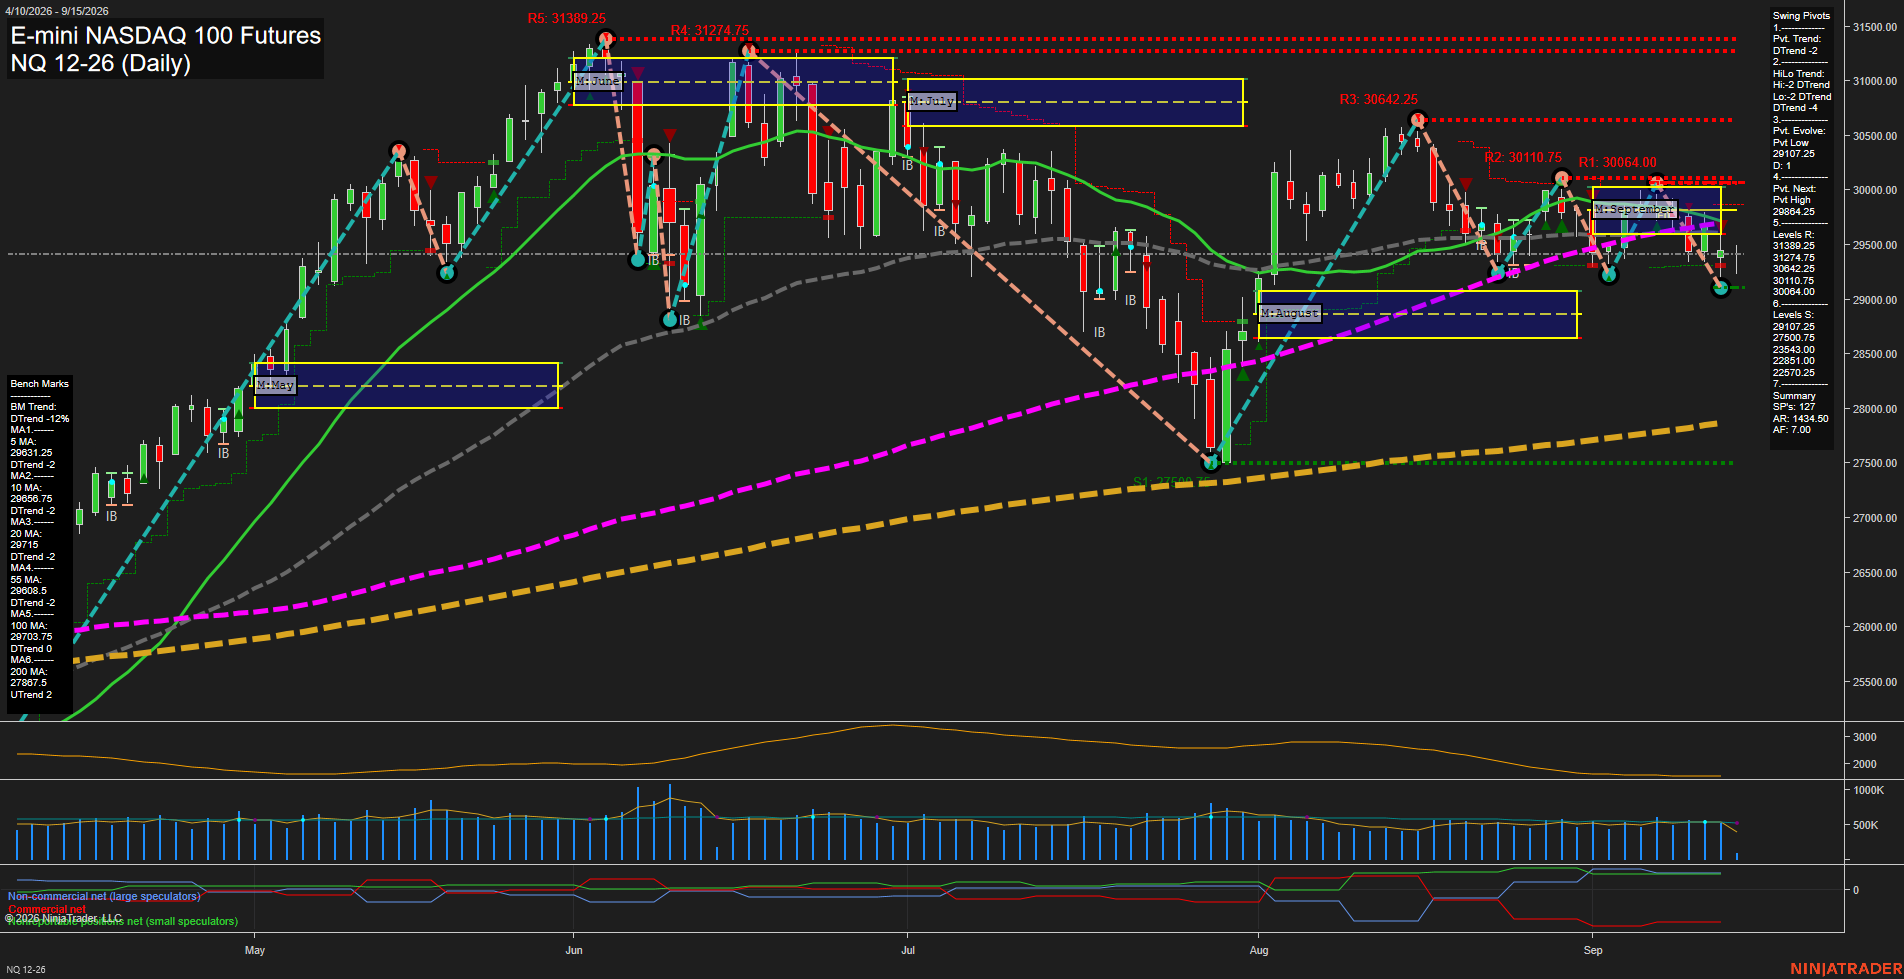
Overall Rating
- Short-Term: Bearish
- Intermediate-Term: Bearish
- Long-Term: Bullish.
Key Insights Summary
Daily structure is in a short-term and intermediate-term downswing, with price below the 5, 10, 20, 55, and 100-day benchmarks and beneath September MSFG F0%. The decline from the 30642.25 swing high has produced lower highs and a renewed test of the 29107.25 pivot-support area. Weekly positioning remains positive and the yearly structure remains upward, supported by price well above the rising 200-day benchmark. This creates a longer-term bullish backdrop beneath a corrective, choppy near-term phase; 29864.25 is the active pivot-reversal level, while 30064.00 through 30110.75 forms the first notable overhead resistance zone.
View charts on: AlphaWebTrader HTF Charts
CL Daily View
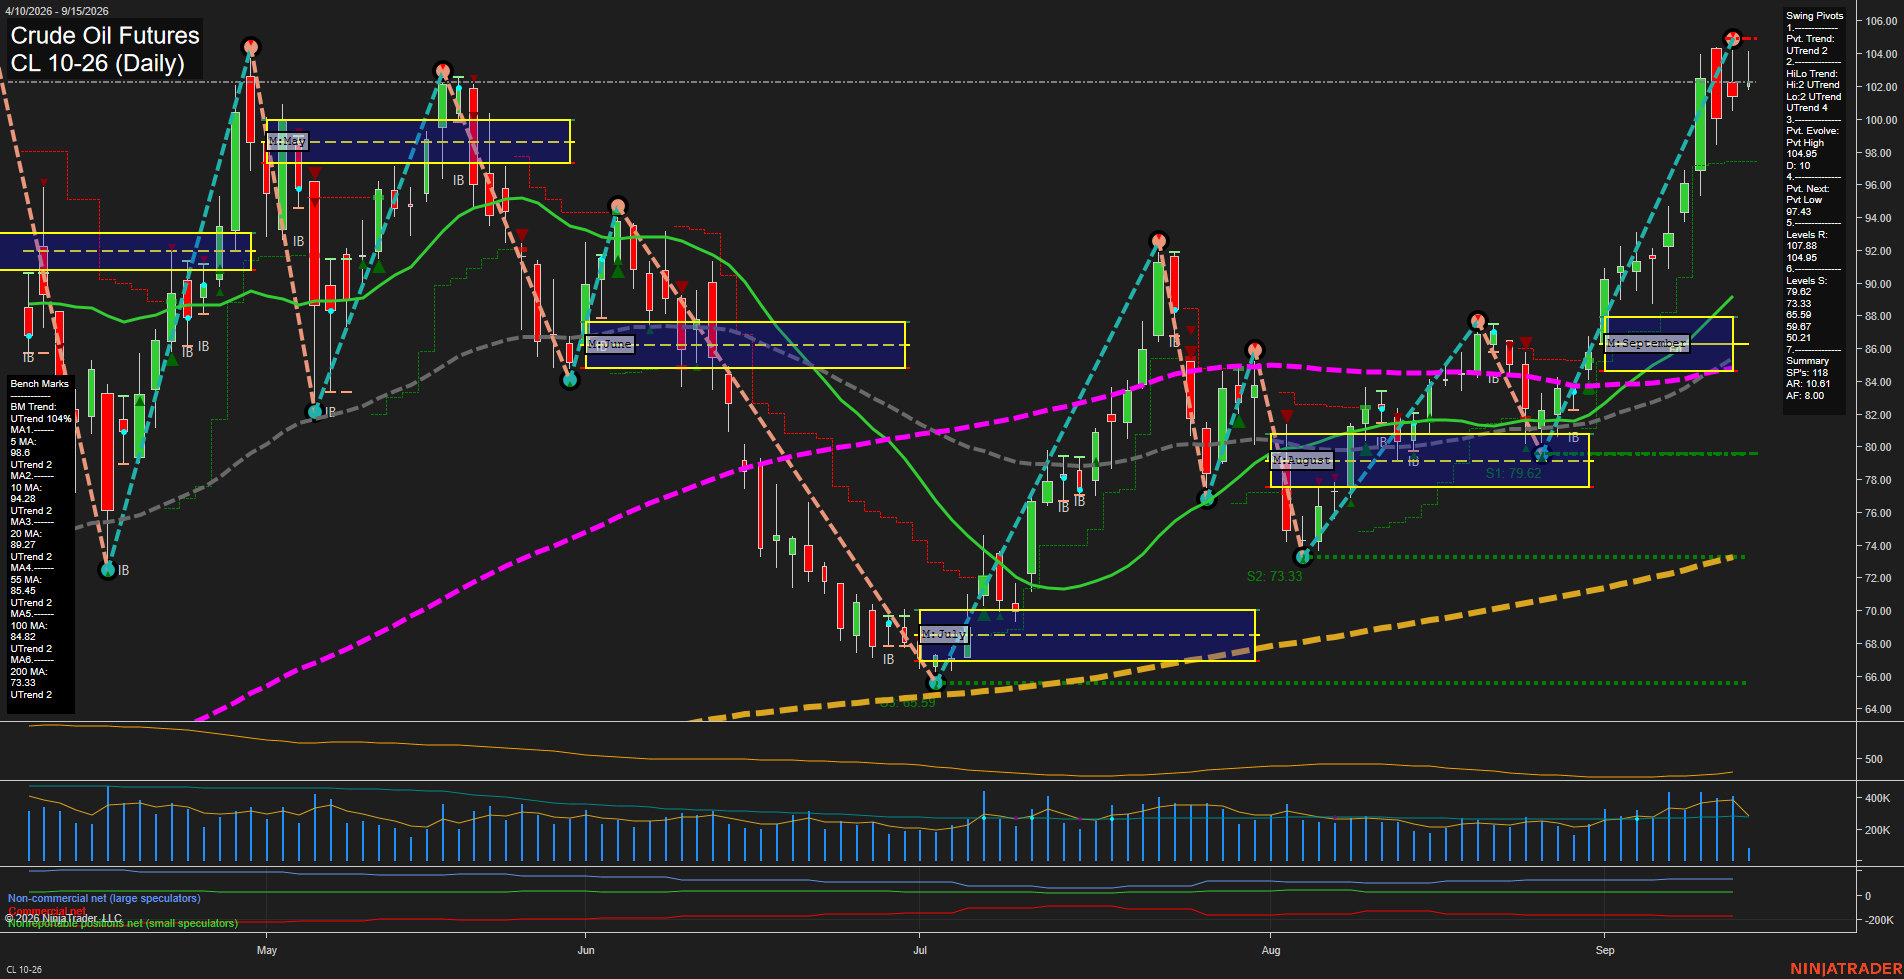
Overall Rating
- Short-Term: Bullish
- Intermediate-Term: Bullish
- Long-Term: Bullish.
Key Insights Summary
Price remains in a broad upside swing structure, with price above every daily benchmark and both pivot-trend measures in UTrend. The September advance accelerated sharply from the August higher low near 79.62 and reached a new pivot high at 104.95. Large recent bars and fast momentum reflect expanded volatility and a potentially frothy late-stage rally condition. The rejection from the 104.95 pivot high has created a short-term pullback, while 97.43 is the stated reversal level for a new pivot low. The weekly, monthly, and yearly Fib-grid biases remain above their respective F0% areas, preserving the prevailing bullish trend alignment despite the near-term two-way price action.
View charts on: AlphaWebTrader HTF Charts
GC Daily View
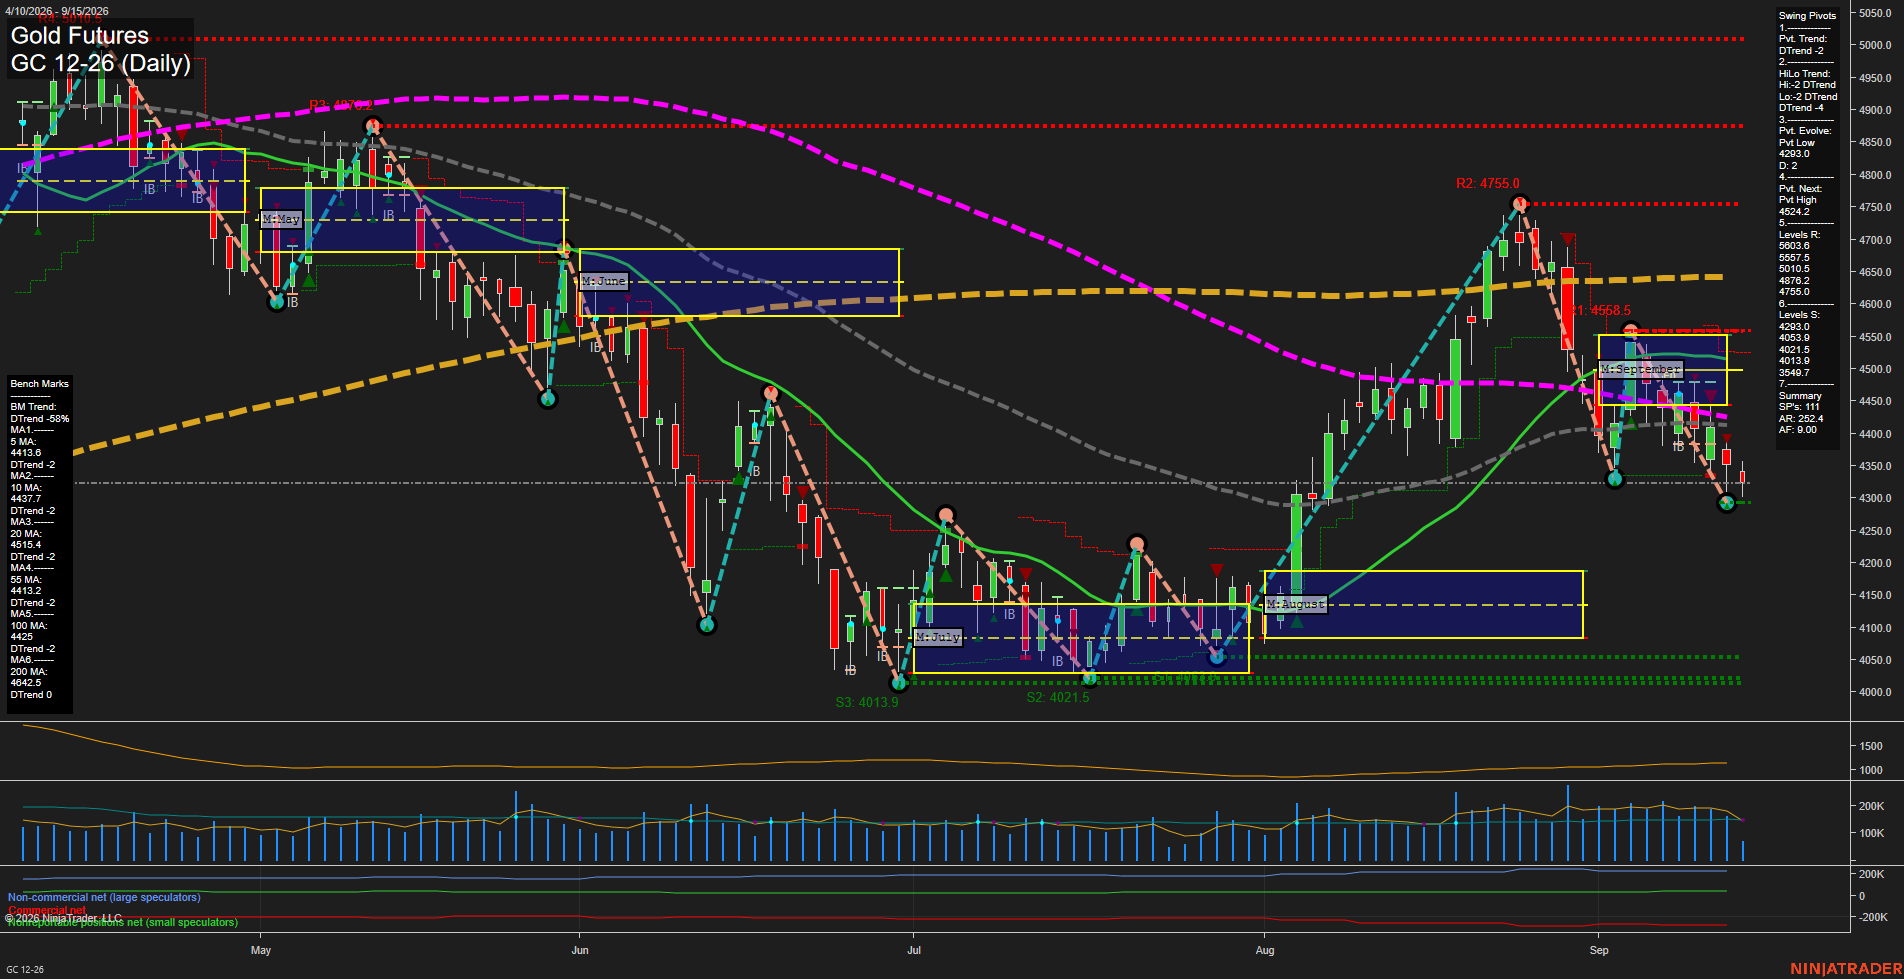
Overall Rating
- Short-Term: Bearish
- Intermediate-Term: Bearish
- Long-Term: Bearish.
Key Insights Summary
Gold futures remain in a broad bearish swing structure, with price below every benchmark average and both pivot trend measures in DTrend. The August rally peaked near 4755.0 and was followed by a sharp rejection, lower highs, and a renewed decline toward the 4293.0 pivot-low support. Price is below the weekly, monthly, and yearly Fib-grid centers, while small recent bars reflect slowing momentum after the selloff rather than a confirmed reversal. The 4542.2 pivot-next level defines the nearest upside swing threshold, with 4293.0 the immediate downside reference.
View charts on: AlphaWebTrader HTF Charts
ZB Daily View
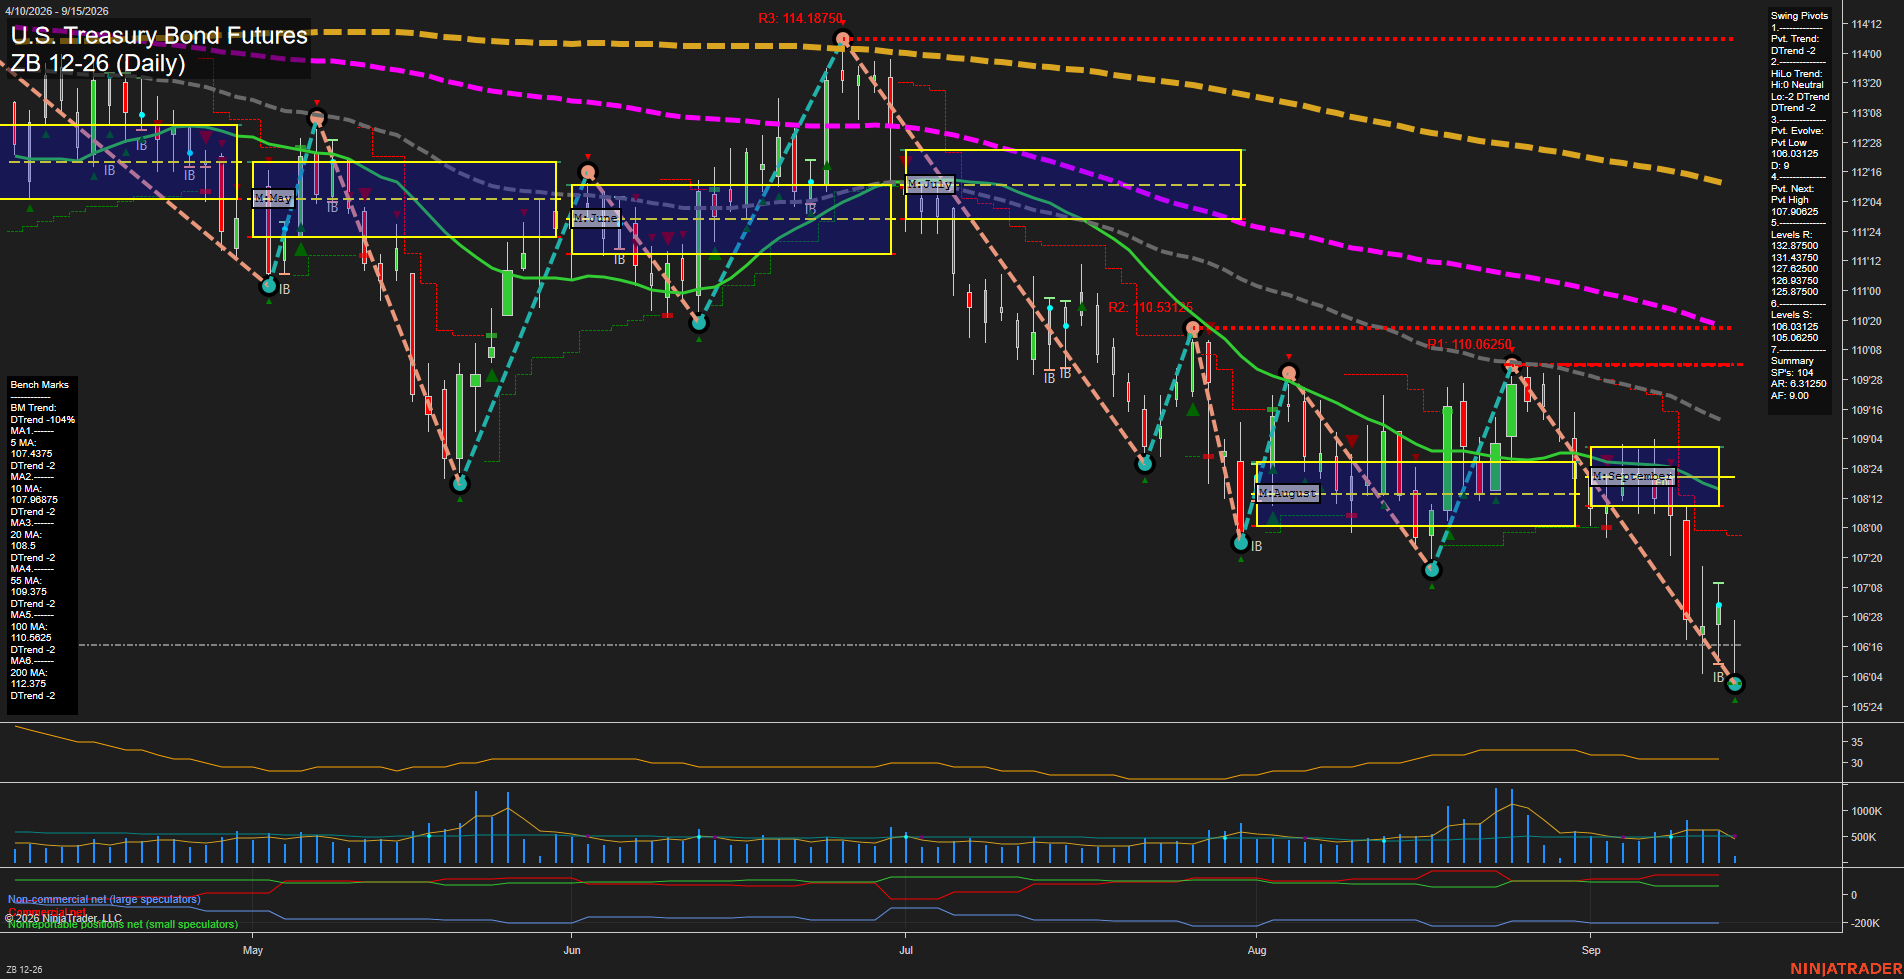
Overall Rating
- Short-Term: Bearish
- Intermediate-Term: Bearish
- Long-Term: Bearish.
Key Insights Summary
The daily structure remains decisively bearish: price is beneath every benchmark average, the short-term pivot trend is down, and the September monthly grid is trading below its lower NTZ area. The market has extended a sharp selloff into the 106:16 area and is attempting a modest bounce from the 106.03125 support zone, but the rebound has not yet altered the sequence of lower highs and lower lows. A pivot reversal condition is identified above 107.90625; until that level is exceeded, rallies remain counter-trend within the broader decline. The nearby 106.03125 and 105.06250 supports frame the current downswing, while declining 5-, 10-, 20-, 55-, 100-, and 200-day averages reflect bearish alignment across all major swing horizons.
View charts on: AlphaWebTrader HTF Charts