NYSE pre-market tracks ETF movers, oil-driven inflation risks, Treasury yields and futures technicals as major indices hold long-term strength amid pullbacks.
Fundamentals: U.S. index futures face a risk-off backdrop as Middle East tensions and damage to Saudi energy infrastructure lift crude prices and add to inflation concerns. Fed funds futures reflect elevated odds of a September rate increase while the 10-year Treasury yield nears 5%. Asian technology, chip and AI-linked shares declined, alongside concerns over narrow U.S. market breadth and high valuations.
Technicals: Pre-market focus includes gains in Amazon, Apple and Alphabet, while USO declined in the prior session. Futures technical readings show broadly constructive long-term trends across major equity indices, but short- and intermediate-term conditions remain mixed to bearish as September pullbacks test pivot supports and moving-average levels in ES, NQ, YM, EMD, RTY and FDAX.
Pre-Market Trading 360° view Market Radar of: holidays, earnings, eco-news, market-news summary, news sentiment, prior session major ETFs, MAG7, Higher Time Frame Analysis Indices Futures Summary, and E-mini S&P500, Nasdaq 100, NYMEX Crude, Gold Futures Daily Chart analysis.
As of: September 14, 2026 07:16 CT
EcoNews Radar U.S. Events
| Day | Time | Impact | Event |
|---|---|---|---|
| Wed | 08:30 | Medium | Core Retail Sales m/m |
| Wed | 08:30 | Medium | Retail Sales m/m |
| Wed | 10:30 | Low | Crude Oil Inventories |
| Wed | 14:00 | High | Federal Funds Rate |
| Wed | 14:00 | High | FOMC Economic Projections |
| Wed | 14:00 | High | FOMC Statement |
| Wed | 14:30 | High | FOMC Press Conference |
| Thu | 08:30 | Medium | Philly Fed Manufacturing Index |
| Thu | 08:30 | Medium | Unemployment Claims |
EcoNews Summary
Wednesday centers on the Federal Reserve’s policy decision and related FOMC communications, the week’s primary high-impact U.S. market events. The 10:30 crude oil inventories release also provides an energy-market focus through changes in petroleum stockpiles.
Event Notes:
- Wednesday 10:30 – Crude Oil Inventories: Reports the weekly change in U.S. commercial crude oil stockpiles. Traders monitor inventory shifts for signals on petroleum supply, energy-price pressure, and inflation-sensitive market conditions.
- Wednesday 14:00 – Federal Funds Rate: The Federal Reserve’s announced target range for overnight interest rates. This is monitored for its direct influence on financing conditions, Treasury yields, the U.S. dollar, and equity-index valuation conditions.
- Wednesday 14:00 – FOMC Economic Projections: Federal Reserve participants’ projections for economic growth, inflation, unemployment, and policy rates. Traders monitor the projections for the policy-rate path and the Fed’s assessment of economic conditions.
- Wednesday 14:00 – FOMC Statement: The Federal Reserve’s policy decision statement, including its assessment of inflation, employment, economic activity, and balance-sheet policy. Wording changes are closely monitored for shifts in policy stance.
- Wednesday 14:30 – FOMC Press Conference: Remarks and question-and-answer session with the Federal Reserve Chair following the policy announcement. Traders monitor clarifications regarding the decision, projections, and policy outlook.
Conclusion:
Wednesday is the most important day of the week, led by the 14:00 Federal Funds Rate decision. Market momentum and volume often slow ahead of FOMC events, with increased volatility at release time. The 10:30 crude inventories report adds an energy-price and petroleum-supply catalyst earlier in the session.
For full details visit: Forex Factory EcoNews
Market News Summary:
Index-futures backdrop is shaped by an oil-supply shock, elevated Fed hike pricing, and weakness in Asian technology shares.
Primary Drivers & Risks:
- Primary Driver: Oil supply disruption and Fed pricing
- Primary Risk: Widening Middle East conflict
Tone:
Risk-off, with inflation and energy pressures prominent.
Stock Market / ETFs / Indices:
Japan’s Nikkei fell 1.6% in early trading, pressured by chip and metals shares. AI-linked Asian stocks also declined after leading AI-company executives called for a slower development pace; reports described global equity weakness. Recent U.S. market resilience has been tied to AI-led productivity and job growth, although market breadth has deteriorated and S&P 500 valuation measures remain elevated.
Geopolitical:
Iran-war tensions intensified after attacks affecting Saudi energy infrastructure. Gulf-Iran talks in Oman on the Strait of Hormuz were postponed, while disruptions involving the Hormuz and Bab el-Mandeb transit routes added pressure to global oil and gas supply chains.
Oil / Energy:
WTI and Brent rose about 3% after weekend attacks reversed Friday’s crude selloff. Saudi Arabia closed its East-West pipeline following drone damage, and a Saudi pipeline outage kept supply risks elevated. U.S. diesel prices exceeded $6 per gallon amid constrained global supplies, stronger exports, and refinery disruptions.
Gold / Metals:
Gold and silver weakened as hot core inflation, rising yields, and elevated Fed hike odds weighed on metals. Gold’s decline occurred despite Middle East supply disruptions, underscoring the dominant influence of rates and the dollar backdrop.
Fed / Financials:
Fed funds futures priced roughly an 87% to 89% probability of a rate increase at the September 16 meeting following hotter CPI and PPI data. The 10-year Treasury yield approached 5%, with discussion focused on whether higher yields reflect economic growth, inflation, fiscal concerns, or market stress.
Macro / Other:
Higher oil and diesel prices add to inflation pressure while the Federal Reserve confronts elevated core inflation. The Singapore dollar weakened against the U.S. dollar as Middle East conflict squeezed global oil supplies.
Conclusion:
Energy supply disruptions and heightened Middle East conflict lifted crude prices and reinforced inflation concerns. Elevated Fed hike pricing and Treasury yields remain central cross-asset inputs.
Technology and AI-linked shares weakened in Asian trading, contributing to a risk-off equity tone. High equity valuations, weaker market breadth, and geopolitical supply disruptions remain significant cross-currents.
Market News Sentiment
Market News Articles: 20
- Neutral: 65.00%
- Negative: 25.00%
- Positive: 10.00%
Sentiment Summary: Market news sentiment is predominantly neutral at 65%, with 25% negative and 10% positive coverage.
Conclusion: The news tone for indices futures day traders is neutral overall, with negative coverage exceeding positive coverage.
GLD,Gold Articles: 5
- Negative: 60.00%
- Neutral: 40.00%
Sentiment Summary: GLD and gold coverage was 60% negative and 40% neutral across 5 articles.
Conclusion: Gold-related news tone was predominantly negative, with no positive articles reported.
USO,Oil Articles: 11
- Positive: 63.64%
- Negative: 36.36%
Sentiment Summary: USO/Oil coverage is moderately positive, with 64% positive and 36% negative articles across 11 articles.
Conclusion: Oil-related news tone is net positive, though more than one-third of coverage remains negative.
Market Data Snapshot
ETF Snapshot of major stock market ETFs, Mag7, and others as of: September 14, 2026 07:16
Top Movers & Losers
- AMZN 256.78 Bullish 1.94% ▲
- AAPL 332.27 Bullish 1.75% ▲
- GOOG 335.45 Bullish 1.53% ▲
- TLT 80.87 Bullish 0.11% ▲
- NVDA 218.29 Bearish -0.03% ▼
- USO 154.90 Bearish -2.20% ▼
Major Index ETFs: SPY, QQQ, DIA, IWM, IJH
- DIA 525.79 Bullish 0.97% ▲
- QQQ 714.88 Bullish 0.87% ▲
- SPY 764.29 Bullish 0.85% ▲
- IJH 74.44 Bullish 0.79% ▲
- IWM 288.89 Bullish 0.41% ▲
Major index ETFs are Bullish across the group: DIA is the most bullish mover at +0.97%, followed by QQQ at +0.87%, SPY at +0.85%, and IJH at +0.79%. IWM is the least positive mover at +0.41%, while still Bullish.
Mag 7 Stocks: AAPL, MSFT, GOOG, AMZN, META, NVDA, TSLA
- AMZN 256.78 Bullish 1.94% ▲
- AAPL 332.27 Bullish 1.75% ▲
- GOOG 335.45 Bullish 1.53% ▲
- MSFT 495.63 Bullish 0.65% ▲
- META 648.03 Bullish 0.57% ▲
- TSLA 365.44 Bullish 0.52% ▲
- NVDA 218.29 Bearish -0.03% ▼
Mixed: AMZN is the most bullish mover at +1.94%, followed by AAPL at +1.75% and GOOG at +1.53%. MSFT, META, and TSLA remain Bullish at +0.65%, +0.57%, and +0.52%. NVDA is the most bearish mover, though marginally Bearish at -0.03%.
Cross-Market ETFs: TLT, GLD, USO, IBIT
- GLD 398.77 Bullish 0.61% ▲
- IBIT 43.77 Bullish 0.21% ▲
- TLT 80.87 Bullish 0.11% ▲
- USO 154.90 Bearish -2.20% ▼
Other ETFs are Mixed: GLD is the most bullish mover at +0.61%, while USO is the most bearish mover at -2.20%. IBIT adds a modest Bullish +0.21%, and TLT is marginally Bullish at +0.11%.
ETF, Mag7, and Cross-Market ETF Insights
Overall Tone
Bullish equity breadth and broadly Bullish Mag7 participation support a Risk on tone, while Bearish USO provides a notable cross-market divergence.
Equity ETFs and Mag7:
Major Index ETFs are broadly Bullish: DIA leads at +0.97%, followed by QQQ at +0.87%, SPY at +0.85%, IJH at +0.79%, and IWM at +0.41%, showing participation across large, mid, and small caps. Mag7 performance is mostly Bullish, led by AMZN at +1.94%, the most bullish mover across equities, with AAPL at +1.75% and GOOG at +1.53%; NVDA is the most bearish mover at a marginal -0.03%. Leadership is selective toward AMZN, AAPL, and GOOG, but positive index ETF moves indicate broadly aligned equities.
Cross-Market ETFs:
GLD is Bullish at +0.61%, the most bullish cross-market mover, while IBIT at +0.21% and TLT at a marginal +0.11% are also Bullish. USO is the most bearish cross-market mover at -2.20%, creating a sharp commodity divergence against Bullish equities, gold, bitcoin, and bonds.
Futures Indices – Higher Time Frame Analysis
Summary of the current state of US Indices Futures based on higher time-frame (HTF) technical analysis as of: 2026-09-14: 07:16 CT.
US Indices Futures
- ES YSFG above F0%, MSFG below F0%, WSFG mixed; rising 20-200 benchmarks; pivots 7435/7838.50; support 7553.50, resistance 7760.50-7838.50.
- NQ YSFG bullish, MSFG/WSFG below F0%; below 5-20 benchmarks, above rising 55-200; pivots 27186-27201.5/30390; resistance 30343-31090.
- YM YSFG and WSFG above F0%, MSFG below; below daily 5-55 benchmarks, above rising 100-200; pivots 51992/54322; resistance 54884.
- EMD YSFG above F0%, MSFG/WSFG below; below 5-100 benchmarks, near rising 200; pivots 3678.2/3941.7; support 3589.2, resistance 3797.4.
- RTY YSFG bullish, MSFG/WSFG below F0%; below 5-100 benchmarks, above rising 200; pivots 2887.2/3079.9; resistance 2958.4-2983.3.
- FDAX YSFG above F0%, MSFG/WSFG below; below 5-55 benchmarks, above rising 100-200; pivots 25317/26865; support 25265, resistance 26662-26865.
Overall State
- Short-Term: Bearish
- Intermediate-Term: Bearish
- Long-Term: Bullish
Conclusion
US index futures show broad short-term corrective alignment, with monthly and weekly Fib-grid weakness across NQ, EMD, RTY, and FDAX. ES and YM retain comparatively firmer weekly structure. Daily pivot sequences are predominantly down, while yearly Fib-grid positioning and rising longer-period benchmarks preserve bullish long-term market structure. Key pivot supports define current retracement boundaries; August and early-September swing highs remain overhead resistance.
Note: Intra-day counter-trend pullbacks or retracements may occur, HTF is context for informational usage and market structure. Glossary: Session Fib Grids periods of YSFG:’Yearly’, MSFG:’Monthly’, WSFG:’Weekly’
For full details visit: AlphaWebTrader Technicals
ES Daily View
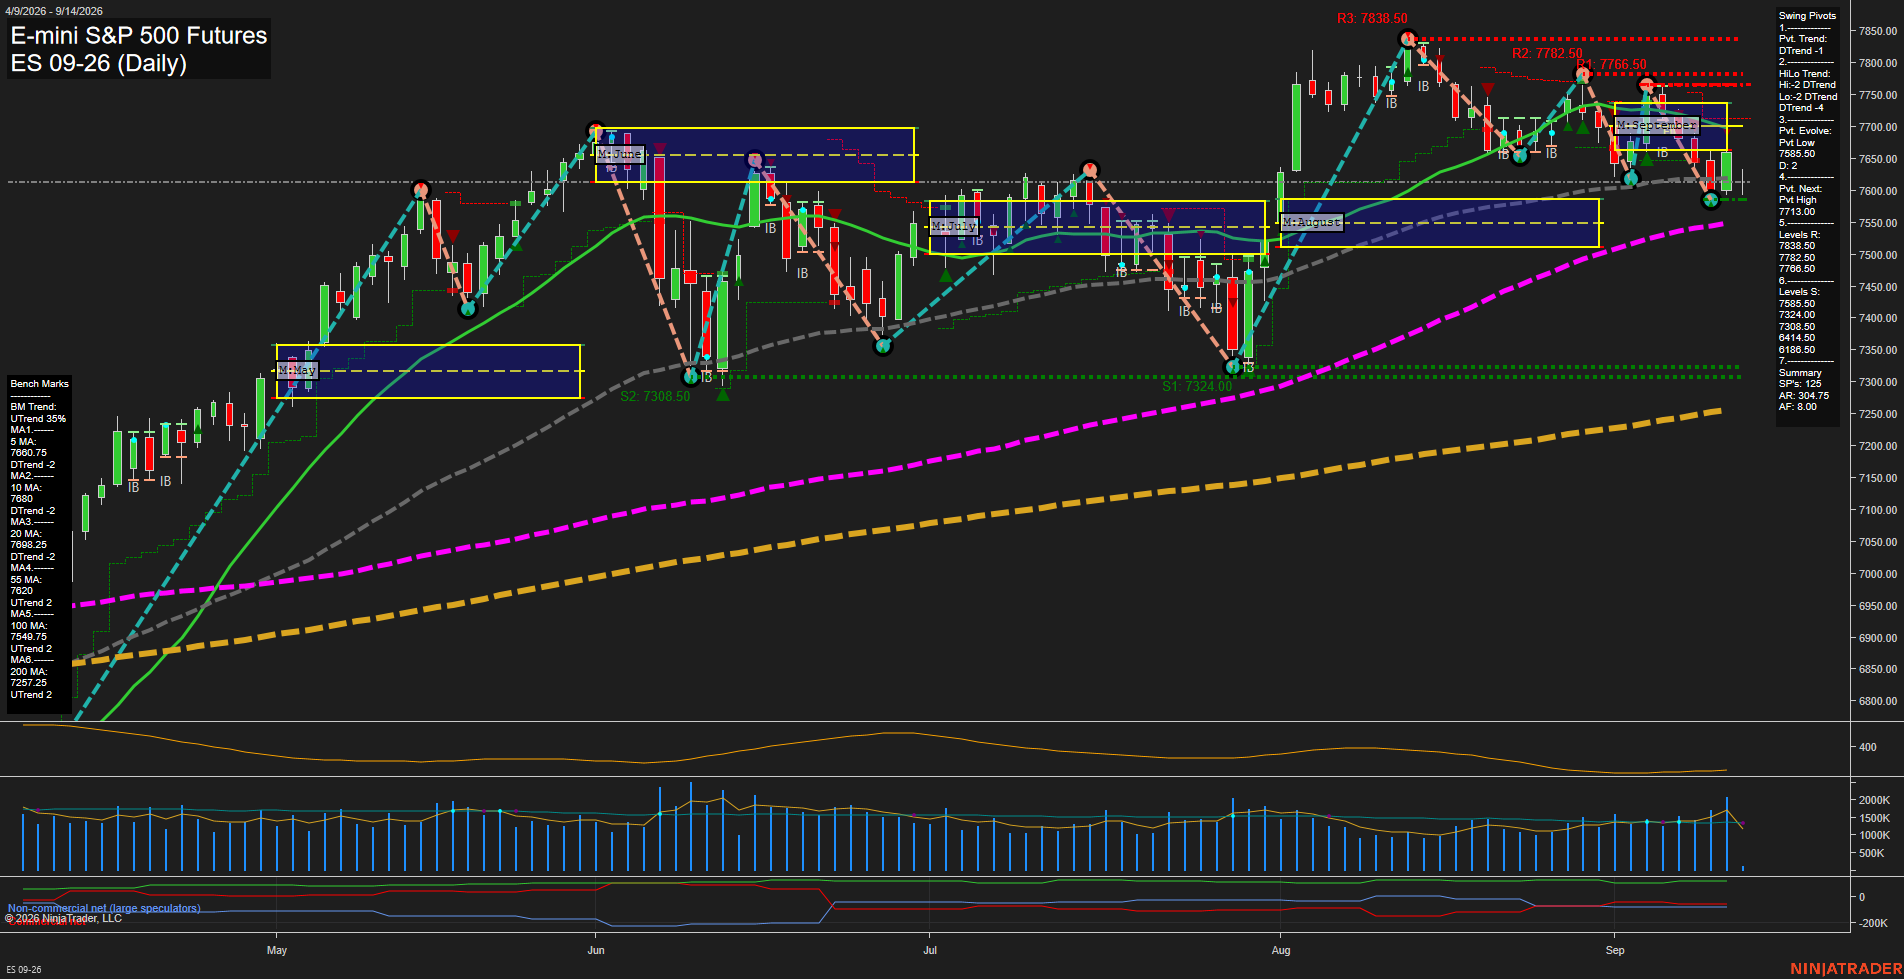
Overall Rating
- Short-Term: Bearish
- Intermediate-Term: Bearish
- Long-Term: Bullish.
Key Insights Summary
Price is rebounding from the 7553.50 pivot-low area and is holding marginally above the rising 55-day benchmark, but the swing-pivot structure remains in a short- and intermediate-term DTrend. The recovery is currently a countertrend bounce beneath declining 5-, 10-, and 20-day averages clustered from 7680.00 to 7698.25. The September MSFG remains below its F0% reference, while the weekly grid remains positive, producing a choppy cross-timeframe condition. Resistance is layered at 7760.50-7782.50 and then 7838.50; support begins at 7553.50, followed by the 7355.50-7308.50 zone. The longer-term structure remains constructive because price is above rising 100- and 200-day benchmarks and the annual grid remains positive.
View charts on: AlphaWebTrader HTF Charts
NQ Daily View
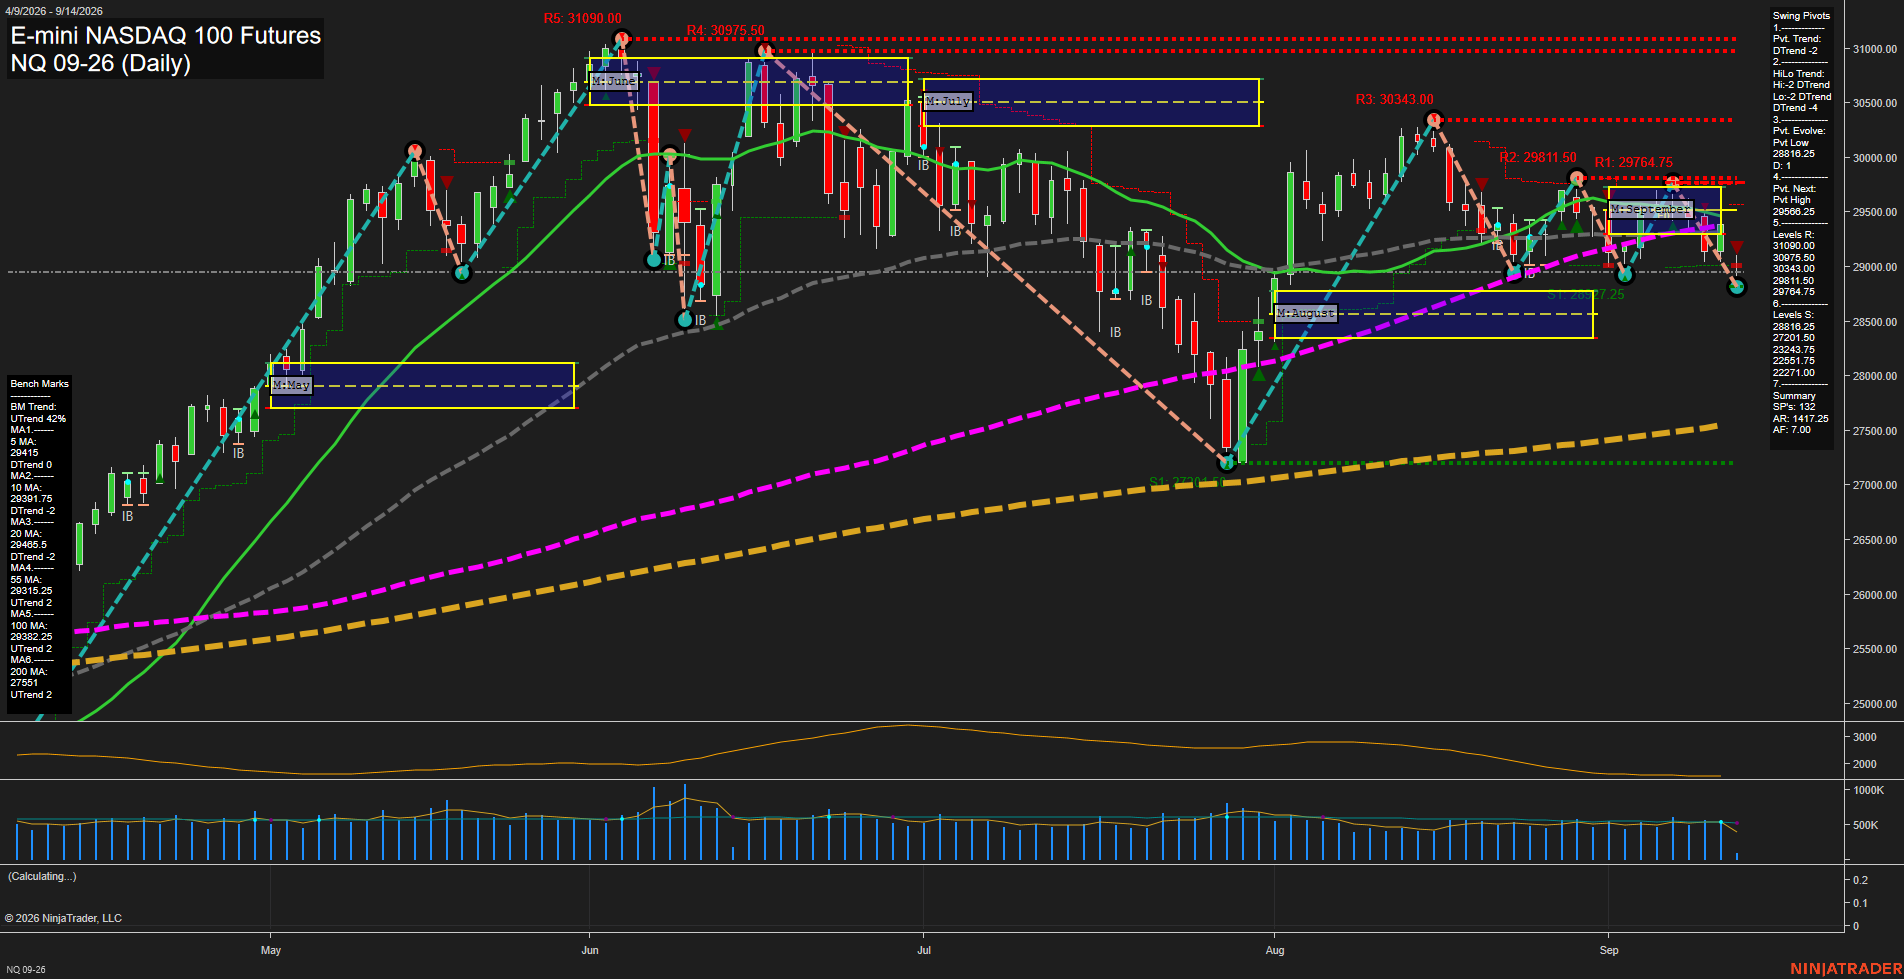
Overall Rating
- Short-Term: Bearish
- Intermediate-Term: Bearish
- Long-Term: Bullish.
Key Insights Summary
The daily structure is in a fast short-term selloff following rejection from the late-August and early-September recovery highs. Both weekly and monthly Fib grids remain below F0%, while the pivot trend and HiLo trend are DTrend, confirming lower-high and lower-low behavior. Price is testing the 29811.50 to 29764.75 resistance cluster from below after slipping beneath the September grid, with 28816.25 the active evolving pivot-low support. Despite bearish short- and intermediate-term structure, price remains above the rising 55-, 100-, and 200-day benchmarks, preserving the broader 2026 bullish trend and framing the current decline as a substantial countertrend retracement within that longer-term advance.
View charts on: AlphaWebTrader HTF Charts
CL Daily View
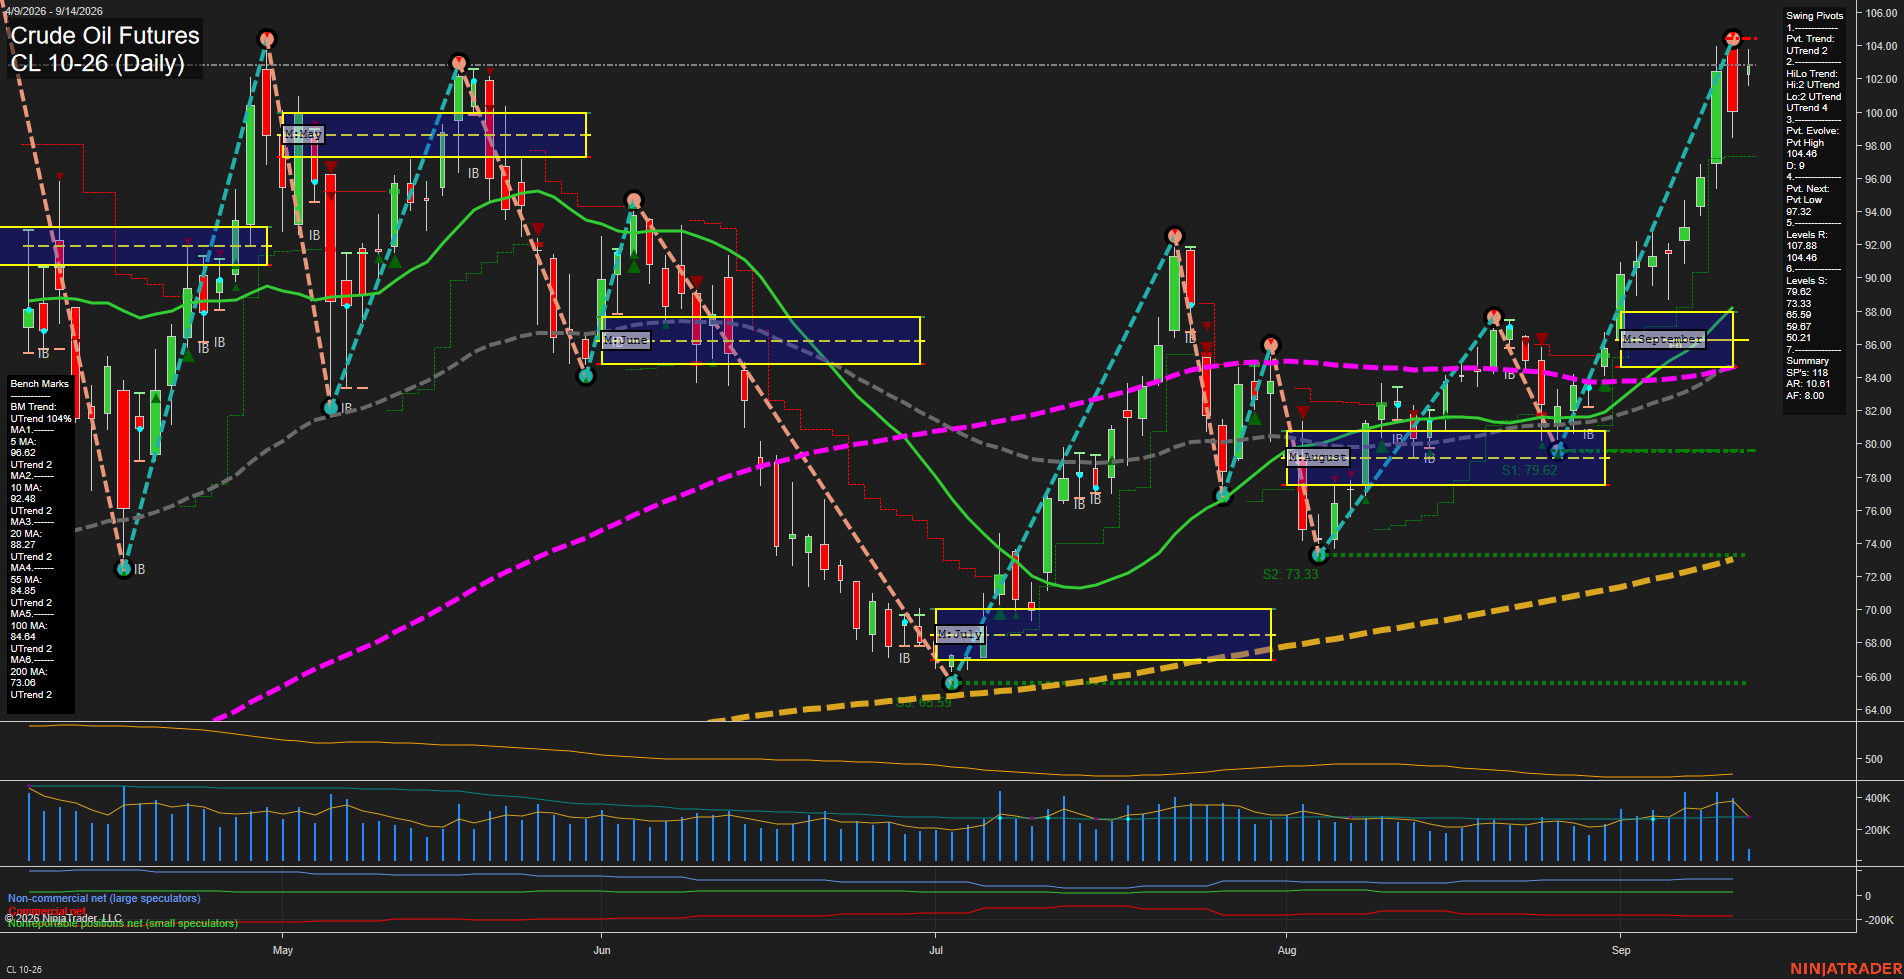
Overall Rating
- Short-Term: Neutral
- Intermediate-Term: Bullish
- Long-Term: Bullish.
Key Insights Summary
Price remains structurally strong above every daily benchmark and above the weekly, monthly, and yearly Fib-grid centers, reflecting a broad higher-high and higher-low recovery from the July low. The September advance accelerated into the 104.48 swing-high area and produced a large bearish reversal bar, shifting the short-term pivot condition to DTrend despite the still-rising moving-average alignment. The 97.32 pivot-next level defines the immediate downside reversal reference, while 104.48 remains the primary overhead swing resistance. Intermediate and long-term conditions remain bullish, supported by rising 20-, 55-, 100-, and 200-day benchmarks, though the rapid expansion above the September grid indicates a volatile, extended momentum phase rather than a steady consolidation.
View charts on: AlphaWebTrader HTF Charts
GC Daily View
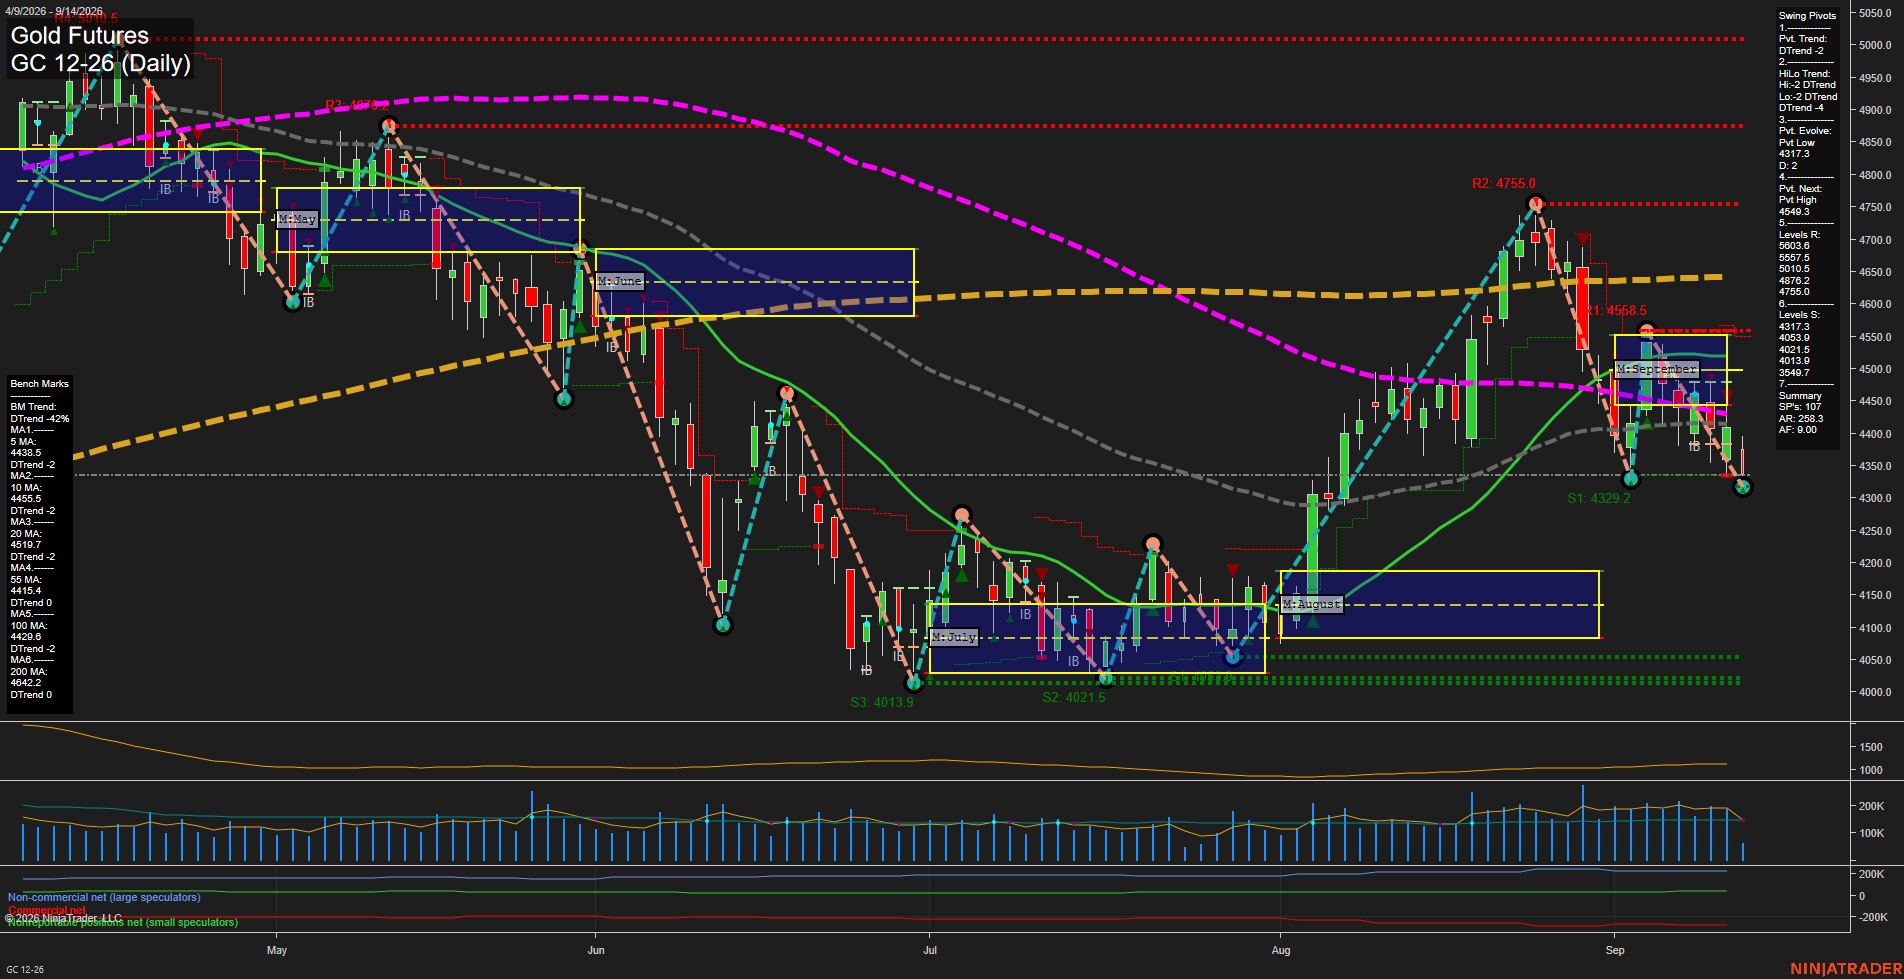
Overall Rating
- Short-Term: Bearish
- Intermediate-Term: Bearish
- Long-Term: Bearish.
Key Insights Summary
Gold futures are in a synchronized bearish swing structure: price is below every benchmark average, the weekly and monthly Fib-grid biases are below F0%, and both pivot-trend measures are DTrend. The late-August rally failed beneath the 4755.0 pivot resistance area, producing a lower-high reversal and a fast decline back to the 4317.3 pivot-low area. Current action is testing this nearby support while downside momentum remains elevated; 4549.3 is the next pivot-reversal threshold, with 4415.4 to 4455.5 forming the nearest moving-average overhead zone. A break beneath 4317.3 would expose the clustered 4053.9 to 4013.9 supports, while recovery above the pivot-reversal level would alter the short-term pivot sequence.
View charts on: AlphaWebTrader HTF Charts
ZB Daily View
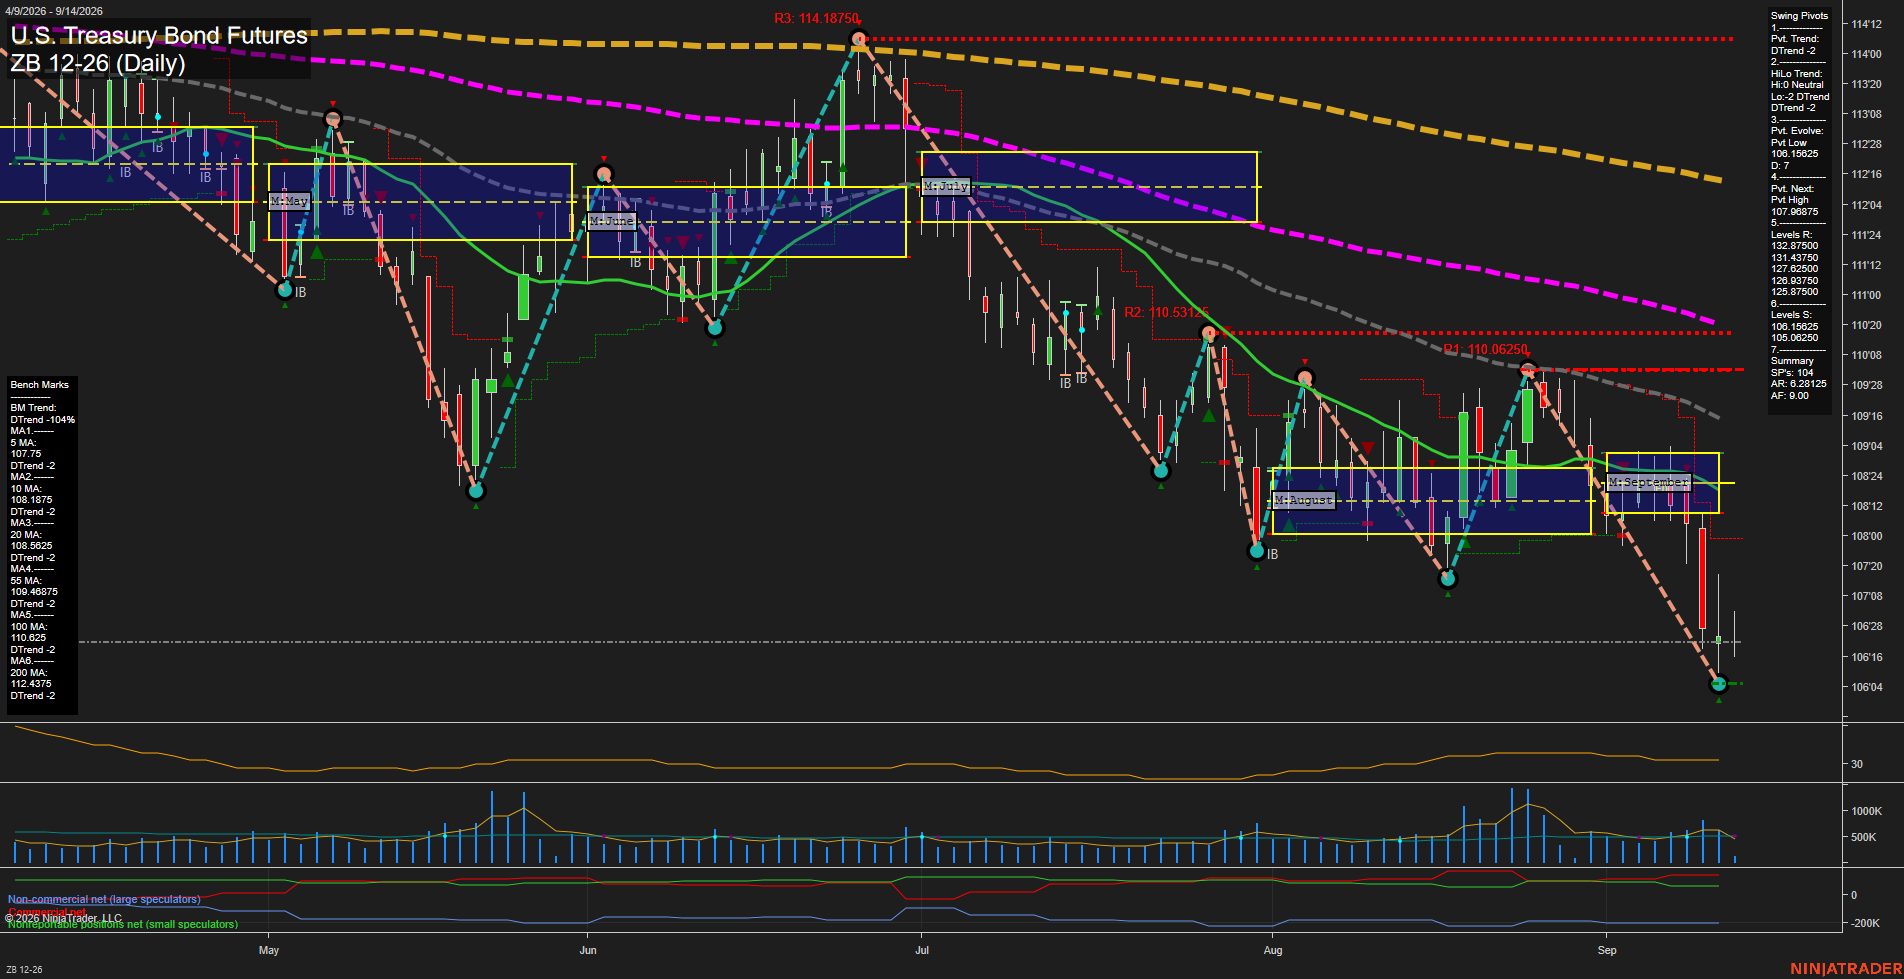
Overall Rating
- Short-Term: Bearish
- Intermediate-Term: Bearish
- Long-Term: Bearish.
Key Insights Summary
Price has accelerated lower from the September NTZ and remains beneath the weekly and monthly Fib-grid areas. The daily pivot structure is in a DTrend, with lower highs and a newly evolving pivot low near 106.109625. The decline has pushed through the 106.15625 support area, leaving 105.06250 as the next listed lower support. All six benchmark averages are declining and positioned above price, confirming broad short-, intermediate-, and long-term downside alignment. Momentum is fast and daily bars have expanded, reflecting a directional selloff with elevated swing-range conditions; 107.098875 is the nearest pivot reversal reference.
View charts on: AlphaWebTrader HTF Charts