U.S. markets closed with bearish technical pressure as Fed hike odds, Saudi supply disruption, high yields and AI-led tech weakness shaped sentiment.
Fundamentals: U.S. equities faced a risk-sensitive close as futures reflected largely priced-in Fed hike expectations, elevated Treasury yields and inflation concerns tied to Saudi pipeline disruption. Technology and AI-linked shares weakened amid safety debates, while oil and refined-fuel shortages remained in focus. Gold recovered as the 10-year yield eased after briefly topping 5%.
Technicals: GOOG, META and IBIT led the listed movers, while GLD, TSLA and NVDA declined. Futures technicals showed broadly bearish short- and intermediate-term conditions across major U.S. and European contracts, with pullbacks below key near-term averages and pivot levels. Longer-term structures remained mostly constructive, supported by rising 100- and 200-period benchmarks.
After Market Close daily snapshot: market news summary and sentiment, major ETFs, Magnificent 7 analysis, Indices Futures Higher Time Frame Analysis, and E-mini S&P500, Nasdaq 100, NYMEX Crude, Gold Futures Daily Chart analysis.
As of: September 14, 2026 05:00 CT
Market News Summary:
Index-futures conditions center on a priced-in Fed hike, an energy-driven inflation shock, and pressure on Treasury yields and technology shares.
Primary Drivers & Risks:
- Primary Driver: Fed hike and energy inflation
- Primary Risk: Saudi supply disruption lifts costs
Tone:
Risk-sensitive, with inflation and supply concerns dominant.
Stock Market / ETFs / Indices:
The S&P 500 stands about 3% below its record high amid discussion of further downside before a recovery. U.S. AI and chip shares lost momentum as safety debates raised concern about the AI investment trade, while China technology ADRs outperformed. Digital-asset fund flows also tracked shifts in Fed expectations.
Geopolitical:
The Iran conflict and attacks affecting Saudi energy infrastructure remain central market concerns. Russia and Ukraine reportedly agreed to pause energy strikes, though confirmation from both countries was absent.
Oil / Energy:
Saudi Arabia shut the East-West crude pipeline after attacks, disrupting a route used to bypass the Strait of Hormuz and intensifying supply concerns. Oil moved above $100 in some reports, while high diesel prices and refinery disruptions drove acute refined-product shortages. Comments on renewed U.S.-Iran talks briefly pulled oil back from session highs.
Gold / Metals:
Gold rebounded from session lows as the 10-year Treasury yield retreated after briefly moving above 5%. Elmet shares rose after a $450 million Pentagon investment to expand domestic tungsten production.
Fed / Financials:
Fed funds futures priced an approximately 88% probability of a 25-basis-point rate increase, leaving the immediate move largely reflected in pricing. Persistent inflation, tariffs, and energy disruption increased discussion of additional hikes this year. The 10-year Treasury yield briefly exceeded 5%, with diesel costs cited as a catalyst, before easing back.
Macro / Other:
The Senate faces a cloture vote on the Clarity Act, a major crypto-market structure bill requiring 60 votes to advance. AI industry leaders discussed slowing frontier development for safety, while President Trump pushed back on added AI regulation.
Conclusion:
Fed policy, elevated Treasury yields, and Saudi pipeline disruption are the main index-futures drivers. Energy costs remain a direct inflation focus.
Technology-sector weakness adds an equity cross-current as AI safety debates intensify. Iran-related supply risk, refined-fuel shortages, and the Fed-Trump policy conflict remain key sources of volatility.
Market News Sentiment
Market News Articles: 44
- Neutral: 61.36%
- Negative: 20.45%
- Positive: 18.18%
Sentiment Summary: Among 44 market news articles, 61% were neutral, 20% negative, and 18% positive, indicating predominantly balanced coverage with a modest negative skew over positive items.
Conclusion: Indices futures day traders are facing largely neutral news flow, with negative coverage slightly exceeding positive coverage.
GLD,Gold Articles: 8
- Negative: 50.00%
- Neutral: 37.50%
- Positive: 12.50%
Sentiment Summary: GLD/Gold coverage is predominantly negative (50%), with 38% neutral and 13% positive across 8 articles.
Conclusion: Gold-related news tone is net negative, indicating cautious sentiment in a closely watched risk and inflation-sensitive market.
USO,Oil Articles: 19
- Negative: 52.63%
- Positive: 42.11%
- Neutral: 5.26%
Sentiment Summary: USO/Oil coverage is mixed but slightly negative, with 53% negative, 42% positive, and 5% neutral articles across 19 items.
Conclusion: Oil-related news tone presents a modest negative bias for indices futures day traders to monitor.
Market Data Snapshot
ETF Snapshot of major stock market ETFs, Mag7, and others as of: September 14, 2026 05:00
Top Movers & Losers
- GOOG 345.71 Bullish 3.06% ▲
- META 665.60 Bullish 2.71% ▲
- IBIT 44.74 Bullish 2.22% ▲
- GLD 392.84 Bearish -1.49% ▼
- TSLA 358.97 Bearish -1.77% ▼
- NVDA 210.96 Bearish -3.36% ▼
Major Index ETFs: SPY, QQQ, DIA, IWM, IJH
- DIA 524.49 Bearish -0.25% ▼
- IWM 287.91 Bearish -0.34% ▼
- SPY 760.88 Bearish -0.45% ▼
- QQQ 709.18 Bearish -0.80% ▼
- IJH 73.79 Bearish -0.87% ▼
Major index ETFs were uniformly Bearish. IJH led losses at -0.87%, followed by QQQ at -0.80% and SPY at -0.45%. IWM declined -0.34%, while DIA was the least negative mover at -0.25%.
Mag 7 Stocks: AAPL, MSFT, GOOG, AMZN, META, NVDA, TSLA
- GOOG 345.71 Bullish 3.06% ▲
- META 665.60 Bullish 2.71% ▲
- MSFT 505.41 Bullish 1.97% ▲
- AAPL 333.08 Bullish 0.24% ▲
- AMZN 253.54 Bearish -1.26% ▼
- TSLA 358.97 Bearish -1.77% ▼
- NVDA 210.96 Bearish -3.36% ▼
Mixed Mag7 performance: GOOG is the most bullish mover at +3.06%, followed by META at +2.71% and MSFT at +1.97%. AAPL is modestly Bullish at +0.24%. NVDA is the most bearish mover at -3.36%, with TSLA at -1.77% and AMZN at -1.26%.
Cross-Market ETFs: TLT, GLD, USO, IBIT
- IBIT 44.74 Bullish 2.22% ▲
- USO 156.66 Bullish 1.14% ▲
- TLT 80.93 Bullish 0.07% ▲
- GLD 392.84 Bearish -1.49% ▼
Mixed cross-market snapshot: IBIT is the most bullish mover at +2.22%, followed by USO at +1.14%. TLT is marginally Bullish at +0.07%. GLD is the most bearish mover at -1.49%.
ETF, Mag7, and Cross-Market ETF Insights
Overall Tone
Mixed: broad equity ETFs were Bearish while select Mag7 leadership and strength in IBIT and USO offset part of the risk-off tone.
Equity ETFs and Mag7:
Major Index ETFs were broadly Bearish: SPY -0.45%, QQQ -0.80%, DIA -0.25%, IWM -0.34%, and IJH -0.87%, with DIA the least negative mover and IJH the most bearish index ETF. Mag7 action was selective, led by GOOG +3.06%, the most bullish equity mover, followed by META +2.71%, MSFT +1.97%, and AAPL +0.24%; AMZN -1.26%, TSLA -1.77%, and NVDA -3.36% were Bearish, with NVDA the most bearish mover overall. Equities were selective rather than broadly aligned.
Cross-Market ETFs:
Cross-market ETFs were Mixed: IBIT gained +2.22% as the most bullish mover, USO rose +1.14%, and TLT was marginally Bullish at +0.07%. GLD declined -1.49% as the most bearish cross-market mover, diverging from strength in IBIT and USO while equity ETFs remained Bearish.
Futures Indices – Higher Time Frame Analysis
Summary of the current state of US Indices Futures based on higher time-frame (HTF) technical analysis as of: 2026-09-14: 17:00 CT.
US Indices Futures
- ES YSFG above F0%, MSFG below F0%, WSFG constructive; rising 20-200 benchmarks; pullback support 7553.50/7435.00, resistance 7760.50-7838.50.
- NQ YSFG bullish, MSFG and WSFG below F0%; below 5-20 benchmarks, above rising 55-200; support 27186-27201.5, resistance 30343-31090.
- YM YSFG and WSFG constructive, MSFG below F0%; above rising 20-200 weekly benchmarks; support 51992, resistance 54322-54884.
- EMD YSFG above F0%, MSFG and WSFG below centers; below 5-20 benchmarks, above rising 55-200 weekly averages; support 3678.2, resistance 3877.0-3941.7.
- RTY YSFG bullish, MSFG and WSFG below F0%; below 5-20 benchmarks, above rising 55-200; support 2887.2-2887.6, resistance 2958.4-3079.9.
- FDAX YSFG above center, MSFG and WSFG below centers; below 5-10 weekly benchmarks, above rising 20-200; support 25265, resistance 26685-26865.
Overall State
- Short-Term: Bearish
- Intermediate-Term: Bearish
- Long-Term: Bullish
Conclusion
Daily structures are bearish across the index complex, with lower pivot sequences and monthly/weekly Fib-grid weakness in NQ, EMD, RTY, and FDAX. ES and YM retain comparatively firmer weekly alignment. Yearly Fib-grid positioning and rising longer-term benchmarks maintain bullish long-term structure in most contracts, while EMD remains neutral on its daily long-term rating. Key pivot supports are active beneath current retracements, with recent swing highs defining overhead resistance.
Note: Intra-day counter-trend pullbacks or retracements may occur, HTF is context for informational usage and market structure. Glossary: Session Fib Grids periods of YSFG:’Yearly’, MSFG:’Monthly’, WSFG:’Weekly’
For full details visit: AlphaWebTrader Technicals
ES Daily View
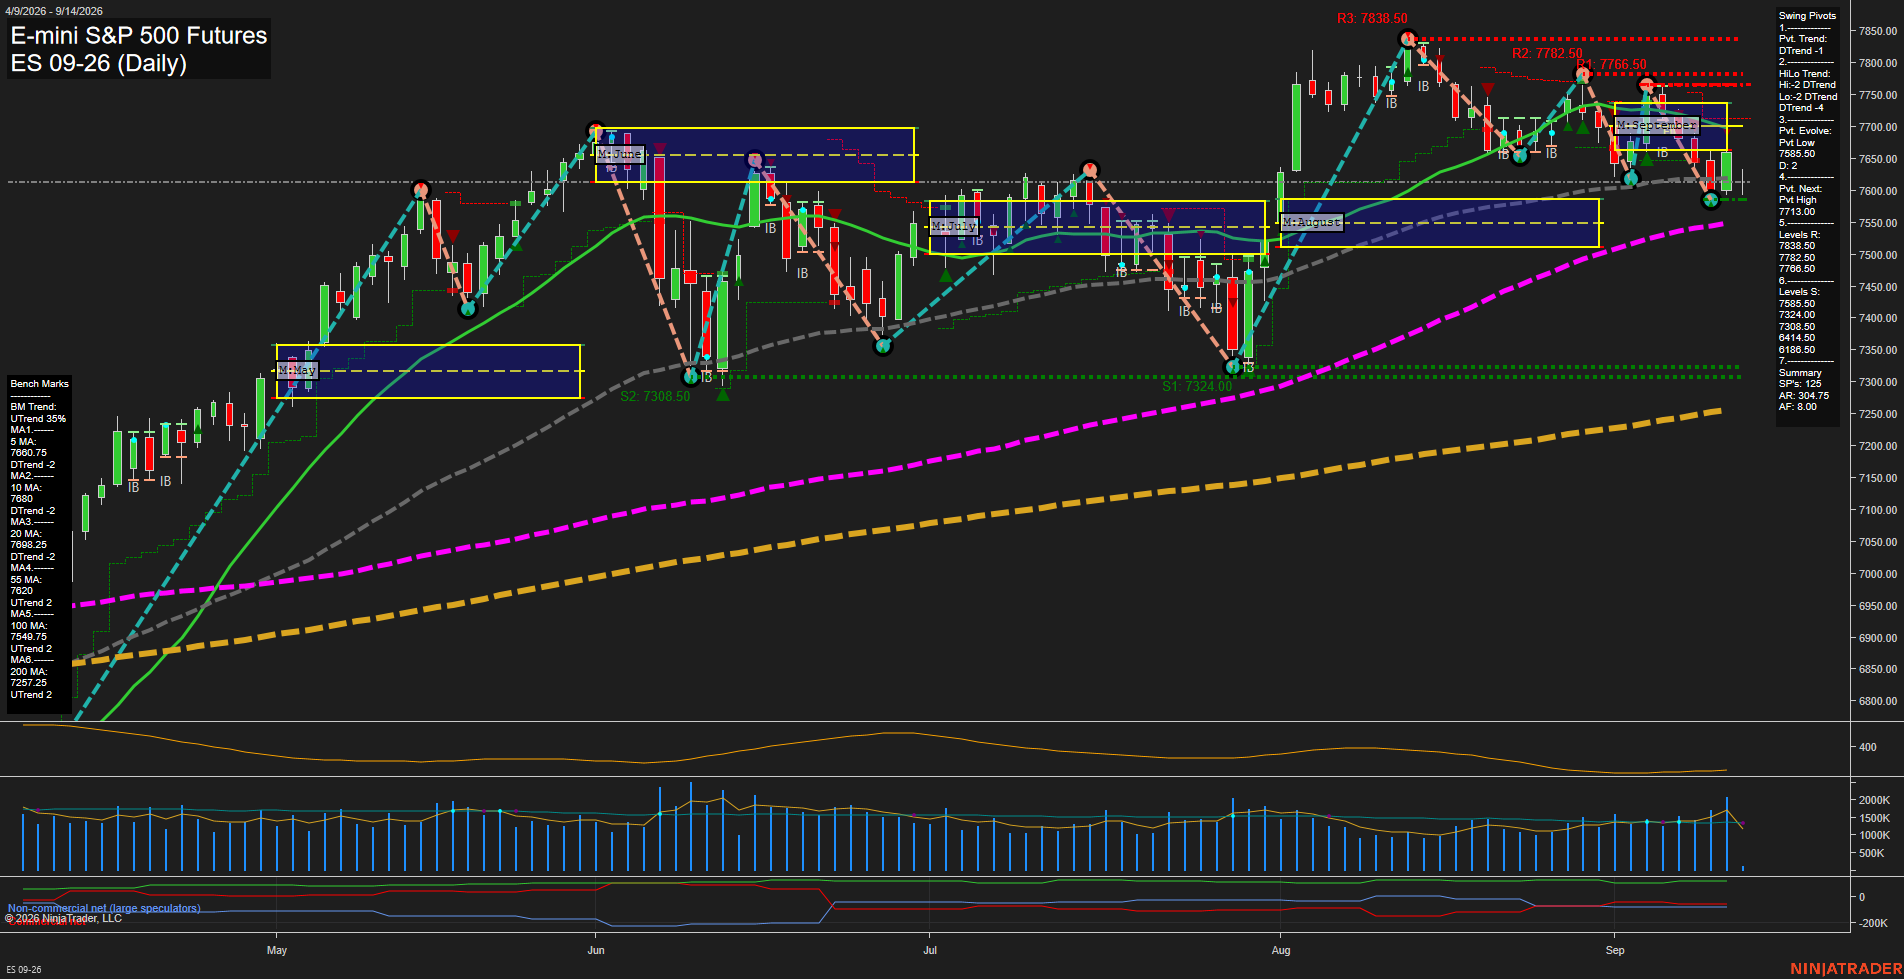
Overall Rating
- Short-Term: Bearish
- Intermediate-Term: Bearish
- Long-Term: Bullish.
Key Insights Summary
Price is rebounding from the 7553.50 pivot-low area and is holding marginally above the rising 55-day benchmark, but the swing-pivot structure remains in a short- and intermediate-term DTrend. The recovery is currently a countertrend bounce beneath declining 5-, 10-, and 20-day averages clustered from 7680.00 to 7698.25. The September MSFG remains below its F0% reference, while the weekly grid remains positive, producing a choppy cross-timeframe condition. Resistance is layered at 7760.50-7782.50 and then 7838.50; support begins at 7553.50, followed by the 7355.50-7308.50 zone. The longer-term structure remains constructive because price is above rising 100- and 200-day benchmarks and the annual grid remains positive.
View charts on: AlphaWebTrader HTF Charts
NQ Daily View
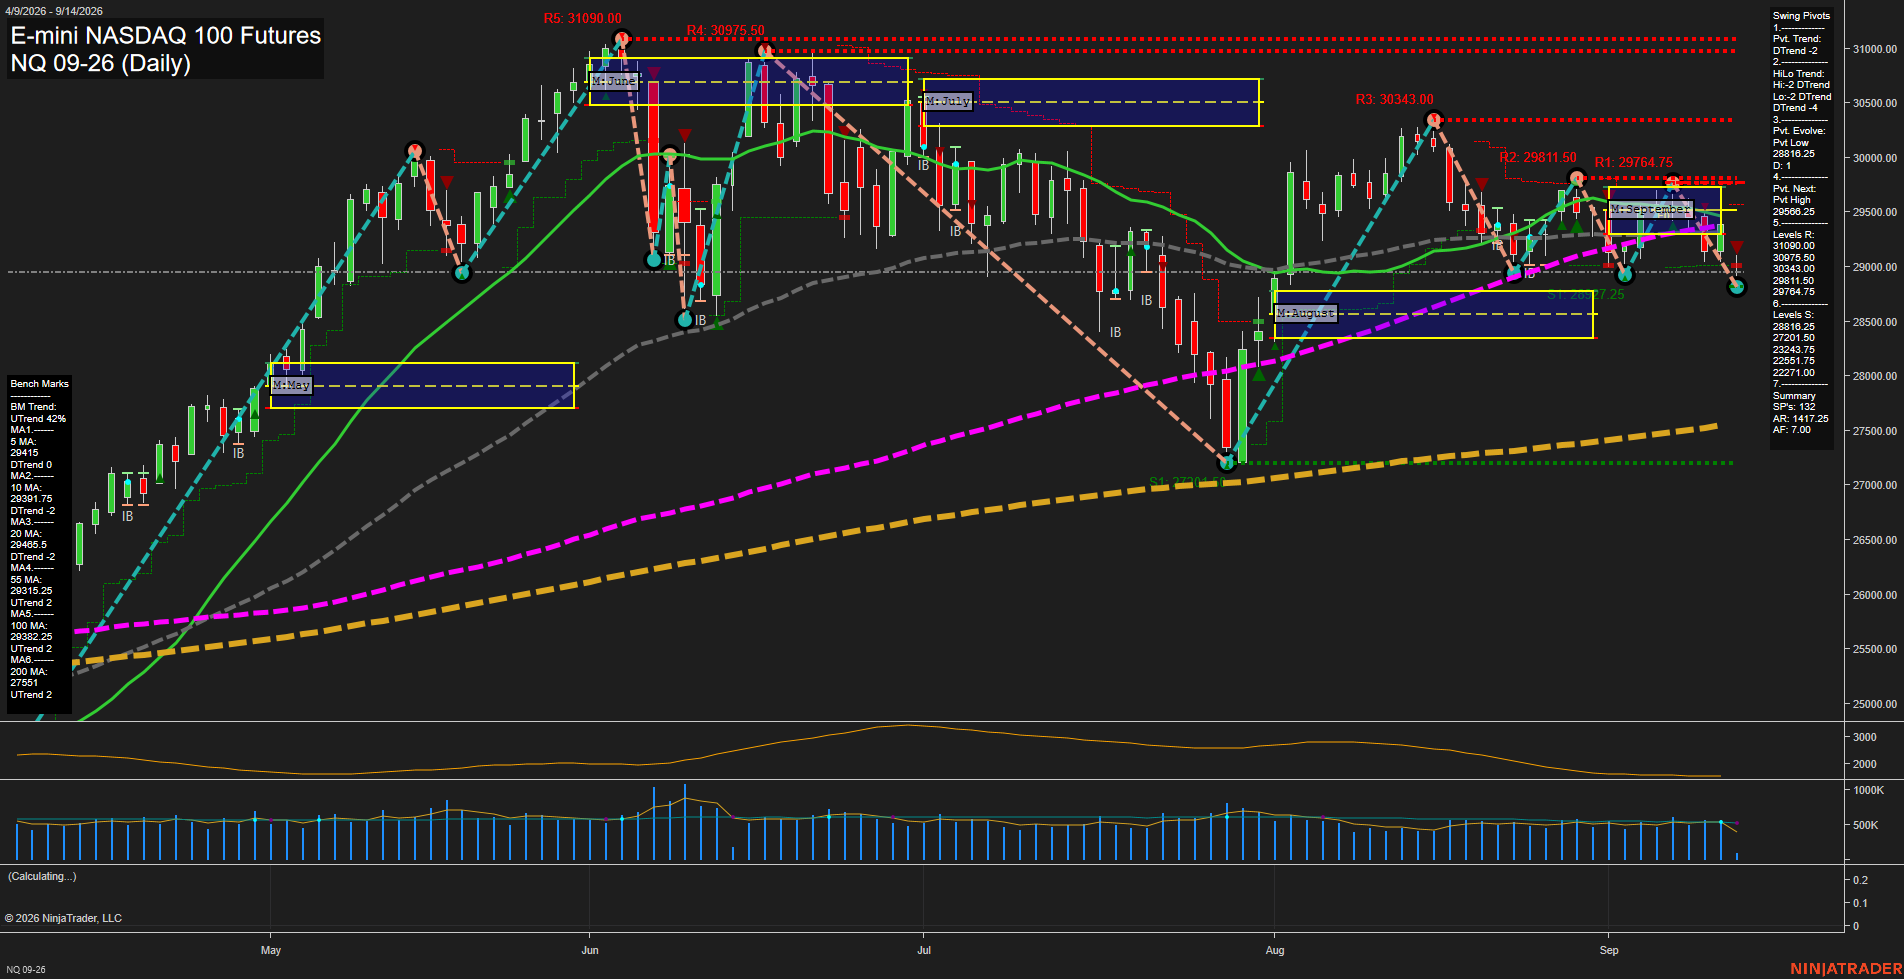
Overall Rating
- Short-Term: Bearish
- Intermediate-Term: Bearish
- Long-Term: Bullish.
Key Insights Summary
The daily structure is in a fast short-term selloff following rejection from the late-August and early-September recovery highs. Both weekly and monthly Fib grids remain below F0%, while the pivot trend and HiLo trend are DTrend, confirming lower-high and lower-low behavior. Price is testing the 29811.50 to 29764.75 resistance cluster from below after slipping beneath the September grid, with 28816.25 the active evolving pivot-low support. Despite bearish short- and intermediate-term structure, price remains above the rising 55-, 100-, and 200-day benchmarks, preserving the broader 2026 bullish trend and framing the current decline as a substantial countertrend retracement within that longer-term advance.
View charts on: AlphaWebTrader HTF Charts
CL Daily View
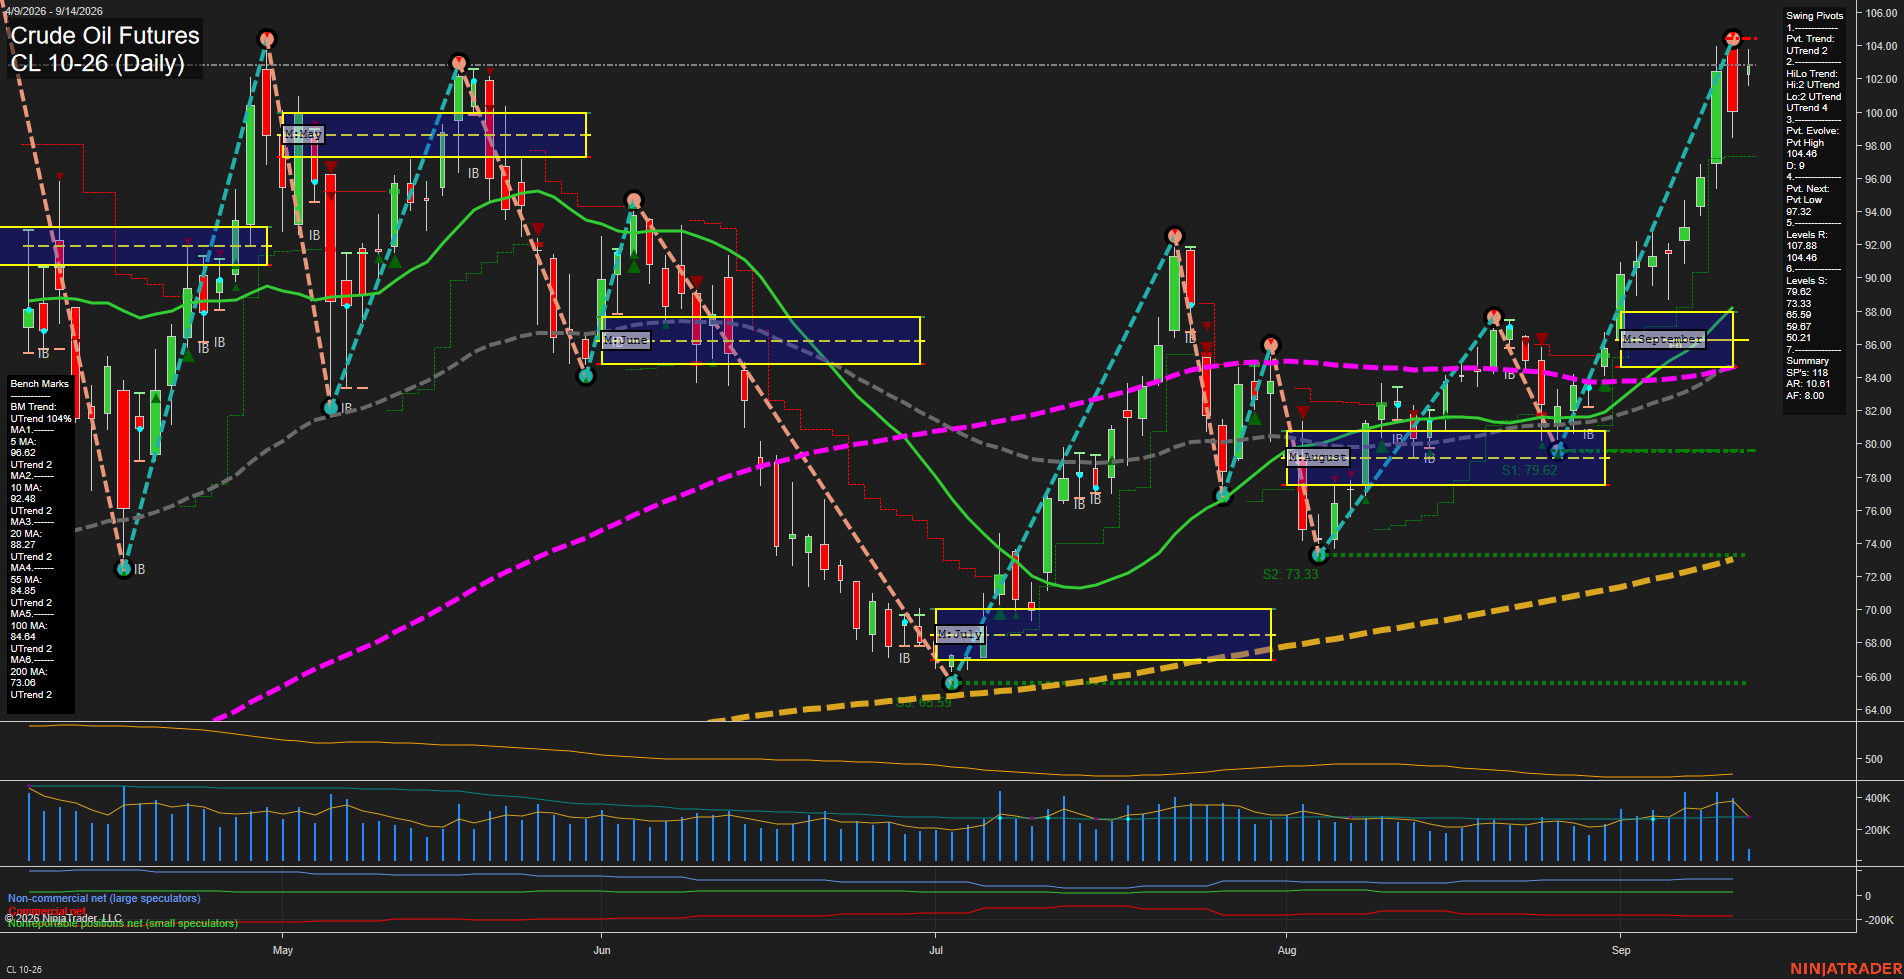
Overall Rating
- Short-Term: Neutral
- Intermediate-Term: Bullish
- Long-Term: Bullish.
Key Insights Summary
Price remains structurally strong above every daily benchmark and above the weekly, monthly, and yearly Fib-grid centers, reflecting a broad higher-high and higher-low recovery from the July low. The September advance accelerated into the 104.48 swing-high area and produced a large bearish reversal bar, shifting the short-term pivot condition to DTrend despite the still-rising moving-average alignment. The 97.32 pivot-next level defines the immediate downside reversal reference, while 104.48 remains the primary overhead swing resistance. Intermediate and long-term conditions remain bullish, supported by rising 20-, 55-, 100-, and 200-day benchmarks, though the rapid expansion above the September grid indicates a volatile, extended momentum phase rather than a steady consolidation.
View charts on: AlphaWebTrader HTF Charts
GC Daily View
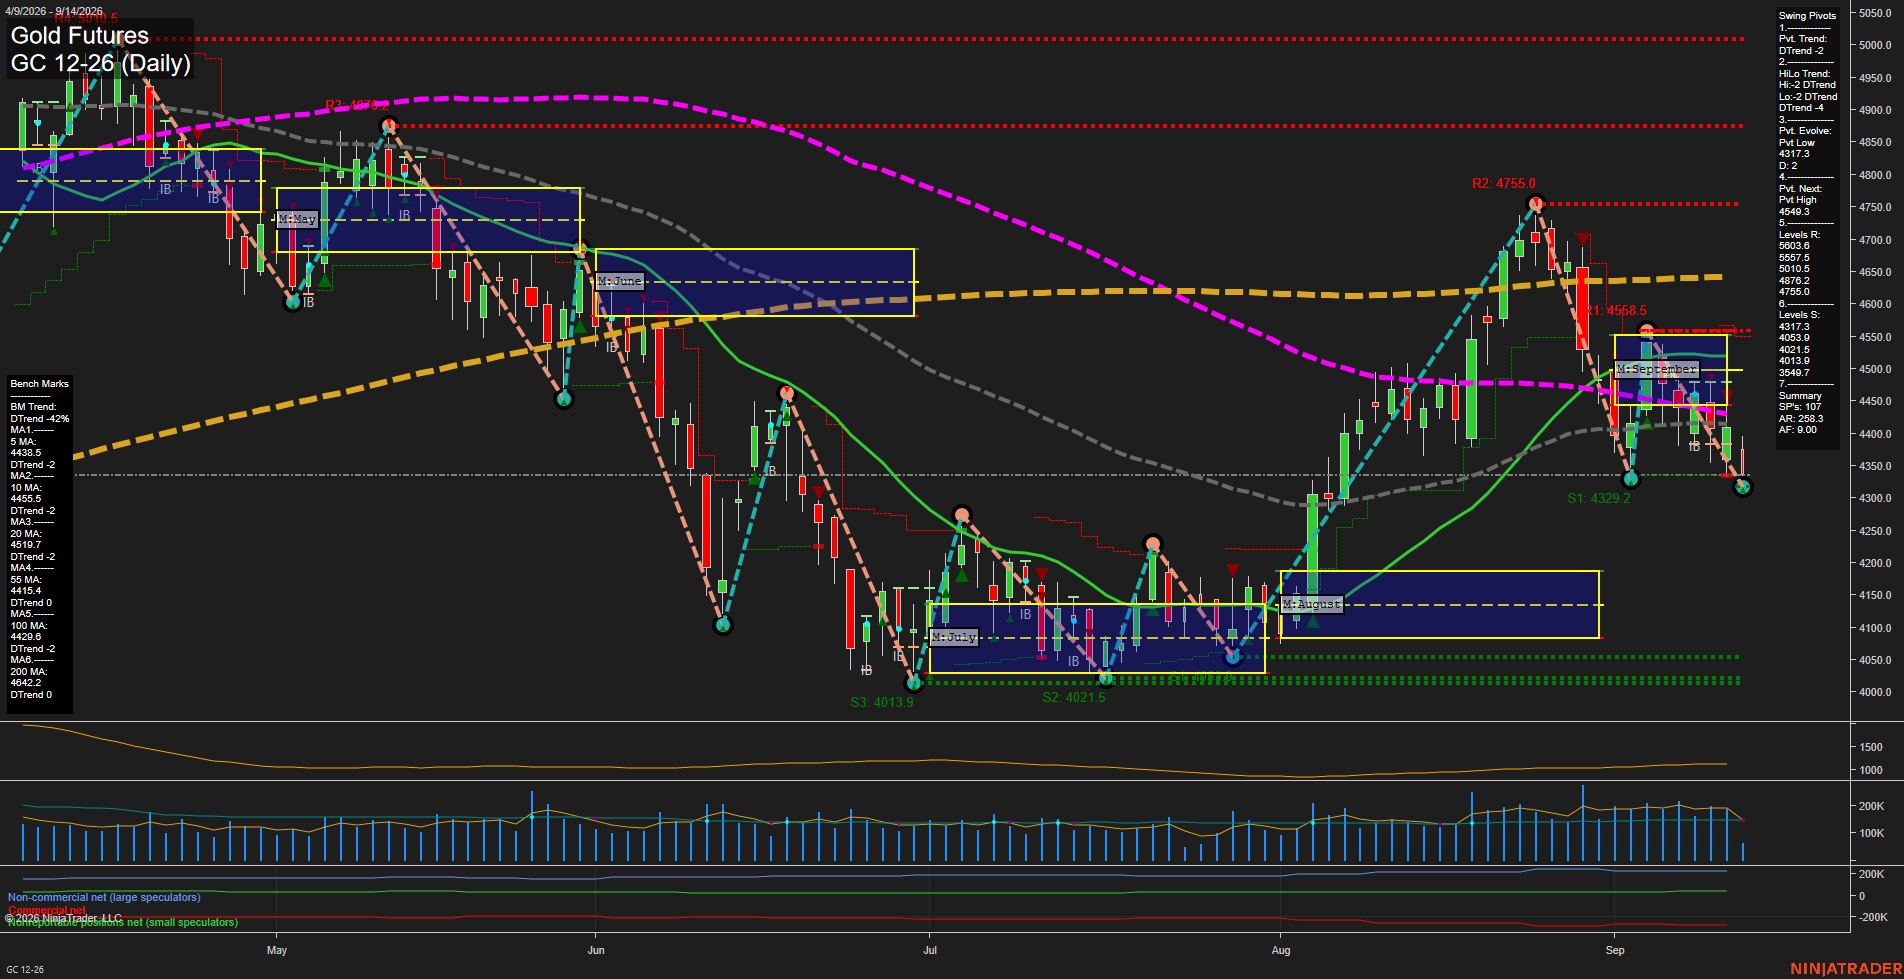
Overall Rating
- Short-Term: Bearish
- Intermediate-Term: Bearish
- Long-Term: Bearish.
Key Insights Summary
Gold futures are in a synchronized bearish swing structure: price is below every benchmark average, the weekly and monthly Fib-grid biases are below F0%, and both pivot-trend measures are DTrend. The late-August rally failed beneath the 4755.0 pivot resistance area, producing a lower-high reversal and a fast decline back to the 4317.3 pivot-low area. Current action is testing this nearby support while downside momentum remains elevated; 4549.3 is the next pivot-reversal threshold, with 4415.4 to 4455.5 forming the nearest moving-average overhead zone. A break beneath 4317.3 would expose the clustered 4053.9 to 4013.9 supports, while recovery above the pivot-reversal level would alter the short-term pivot sequence.
View charts on: AlphaWebTrader HTF Charts
ZB Daily View
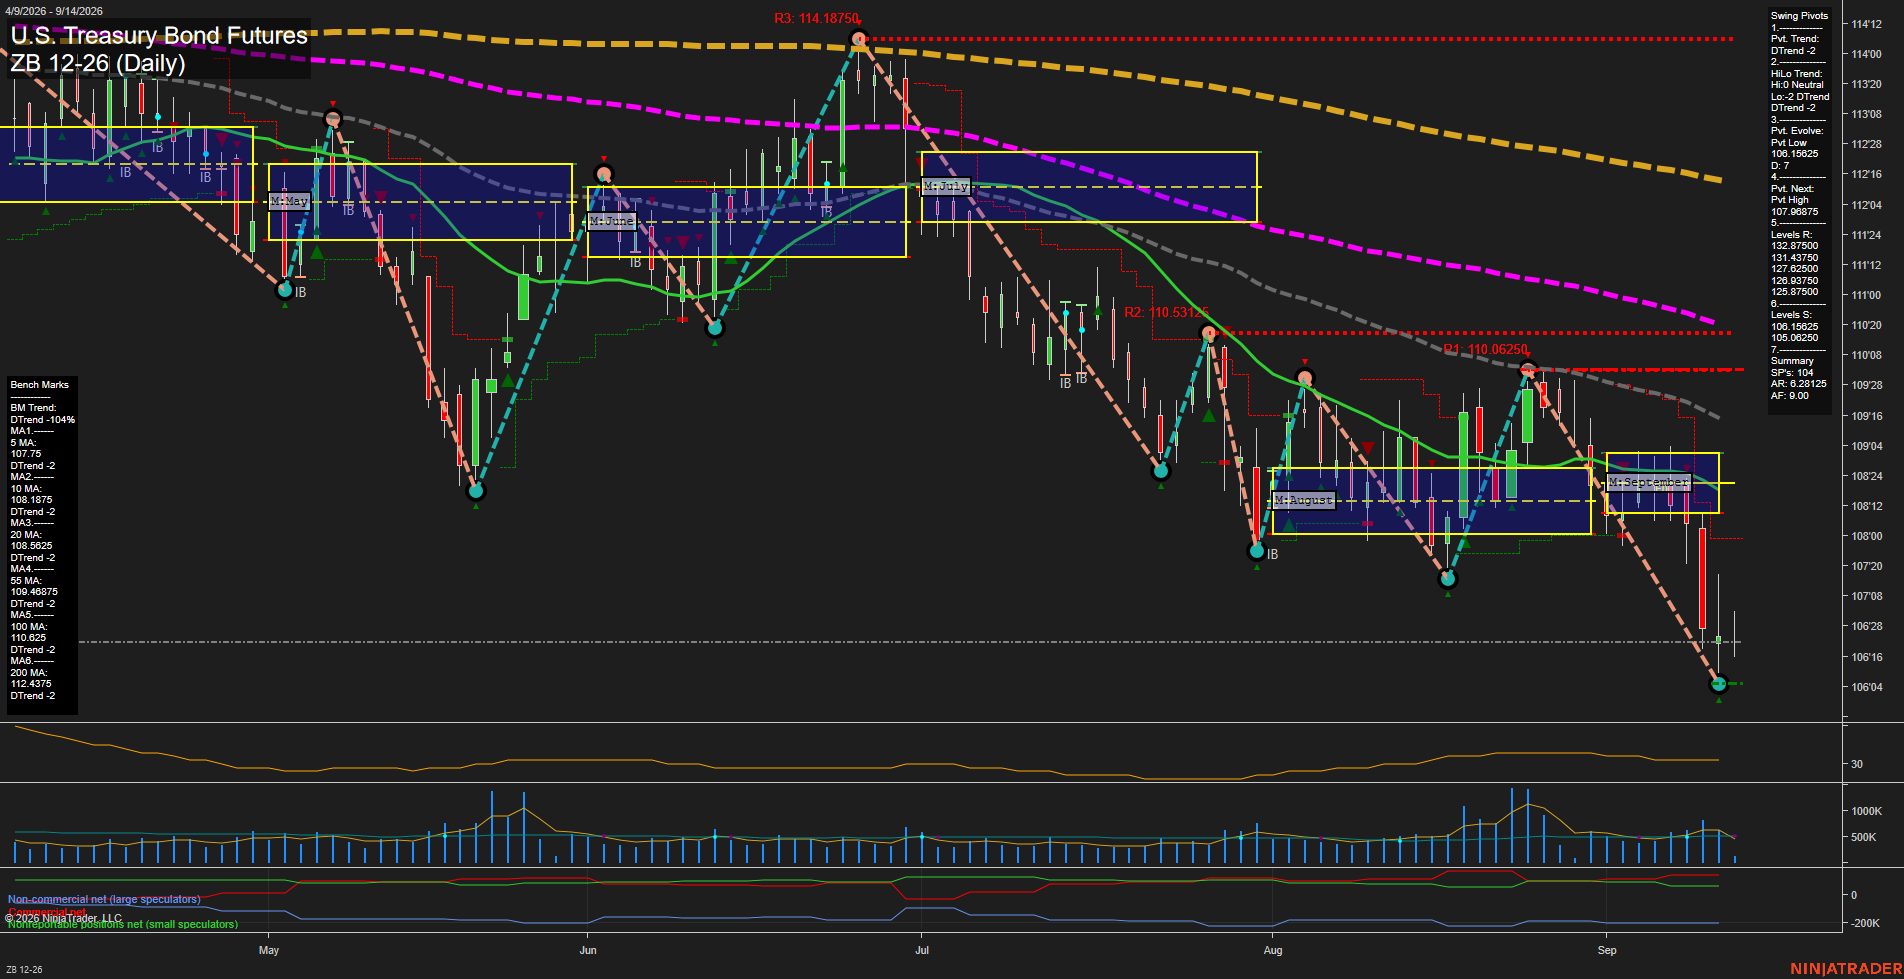
Overall Rating
- Short-Term: Bearish
- Intermediate-Term: Bearish
- Long-Term: Bearish.
Key Insights Summary
Price has accelerated lower from the September NTZ and remains beneath the weekly and monthly Fib-grid areas. The daily pivot structure is in a DTrend, with lower highs and a newly evolving pivot low near 106.109625. The decline has pushed through the 106.15625 support area, leaving 105.06250 as the next listed lower support. All six benchmark averages are declining and positioned above price, confirming broad short-, intermediate-, and long-term downside alignment. Momentum is fast and daily bars have expanded, reflecting a directional selloff with elevated swing-range conditions; 107.098875 is the nearest pivot reversal reference.
View charts on: AlphaWebTrader HTF Charts