NYSE pre-market futures ease as oil disruptions lift yields and AI shares weaken, while ES, NQ, YM, EMD, RTY and FDAX test key short-term support.
Fundamentals: U.S. equity futures moved lower in the NYSE pre-market session as crude prices climbed following Middle East energy infrastructure disruptions and Gulf shipping risks. The rise in oil coincided with Treasury yields above 5%, adding pressure to bonds, gold and rate-sensitive equities before the Federal Reserve decision. AI-sector weakness also weighed on major indexes.
Technicals: Pre-market conditions follow gains in GOOG, META and IBIT, while GLD, TSLA and NVDA declined in the prior session. Across major equity-index futures, daily structures are broadly bearish, with prices below key short-term benchmarks and testing pivot support. Weekly and yearly measures remain more constructive, framing current weakness as corrective within longer-term uptrends.
Pre-Market Trading 360° view Market Radar of: holidays, earnings, eco-news, market-news summary, news sentiment, prior session major ETFs, MAG7, Higher Time Frame Analysis Indices Futures Summary, and E-mini S&P500, Nasdaq 100, NYMEX Crude, Gold Futures Daily Chart analysis.
As of: September 15, 2026 07:16 CT
EcoNews Radar U.S. Events
| Day | Time | Impact | Event |
|---|---|---|---|
| Wed | 08:30 | Medium | Core Retail Sales m/m |
| Wed | 08:30 | Medium | Retail Sales m/m |
| Wed | 10:30 | Low | Crude Oil Inventories |
| Wed | 14:00 | High | Federal Funds Rate |
| Wed | 14:00 | High | FOMC Economic Projections |
| Wed | 14:00 | High | FOMC Statement |
| Wed | 14:30 | High | FOMC Press Conference |
| Thu | 08:30 | Medium | Philly Fed Manufacturing Index |
| Thu | 08:30 | Medium | Unemployment Claims |
EcoNews Summary
Wednesday contains the week’s primary market-moving cluster: the Federal Reserve’s rate decision, economic projections, policy statement, and press conference. The crude oil inventory release provides petroleum supply and energy-price context. Market momentum and volume often slow ahead of FOMC events, with increased volatility at release time.
Event Notes:
- Wednesday 10:30 – USD Crude Oil Inventories: Measures the weekly change in U.S. commercial crude oil stocks. Traders monitor inventories for petroleum supply conditions and their relationship to energy prices and inflation-sensitive market sentiment.
- Wednesday 14:00 – USD Federal Funds Rate: The Federal Reserve’s target interest-rate decision. It defines the stance of U.S. monetary policy and affects rate-sensitive pricing across equity index futures, bonds, and the U.S. dollar.
- Wednesday 14:00 – USD FOMC Economic Projections: Federal Reserve officials’ projections for economic growth, inflation, unemployment, and interest rates. Traders monitor the projections for changes in the policy-rate outlook.
- Wednesday 14:00 – USD FOMC Statement: The formal policy communication explaining the Federal Reserve’s decision and assessment of economic and inflation conditions. Language changes often drive immediate repricing across major markets.
- Wednesday 14:30 – USD FOMC Press Conference: Remarks and questions with the Federal Reserve Chair following the policy announcement. Traders monitor policy guidance, economic assessments, and clarification of the statement and projections.
Conclusion:
Wednesday is the single most important day of the week, led by the 14:00 USD Federal Funds Rate decision. The accompanying FOMC statement, economic projections, and 14:30 press conference concentrate the week’s highest-impact policy information. Crude oil inventories add energy-supply context earlier in the session.
For full details visit: Forex Factory EcoNews
Market News Summary:
Equity futures point lower as oil-supply disruption, rising Treasury yields, and AI-sector weakness pressure risk sentiment ahead of the Federal Reserve decision.
Primary Drivers & Risks:
- Primary Driver: Oil-driven Treasury yield surge
- Primary Risk: Escalating Middle East supply disruption
Tone:
Risk-off, with inflation and policy concerns dominant.
Stock Market / ETFs / Indices:
U.S. stock futures trended lower early Tuesday amid higher energy costs, refinery outages, and the Fed meeting. AI equities continued to weaken after industry warnings on development spending, and their large index weighting outweighed gains in some non-technology shares. Japan’s Nikkei also slipped, led by chip-related shares and trading houses.
Geopolitical:
Iran-U.S. tensions intensified alongside Houthi strikes on Saudi Arabia, attacks on Gulf shipping, and concern over Iranian conflict-related disruption. The Saudi East-West pipeline outage heightened doubts about Gulf shipping normalization.
Oil / Energy:
Crude extended gains as the Saudi pipeline shutdown and attacks on energy infrastructure tightened supply concerns. Russian sanctions, Ukrainian refinery strikes, stronger Chinese crude imports, and delayed non-OPEC+ supply additions added to the supply backdrop. Brent traded near $107.59, while higher gasoline prices raised broader consumer-cost concerns.
Gold / Metals:
Gold remained under pressure below $4,300 as Treasury yields rose, the dollar strengthened, and inflation concerns intensified. Reports cited the 10-year yield above 5% as a key constraint on gold and silver.
Fed / Financials:
The 10-year Treasury yield climbed to its highest level since 2007 as government-debt selling deepened before the Fed decision. Oil and Treasury yields moved in close alignment, tightening financial conditions and pressuring long-duration bonds; TLT fell to its lowest level since July 2025. Bond-market structure also drew attention as hedge funds filled demand left by pension-fund Treasury pullbacks.
Macro / Other:
Rising fuel prices lifted costs for air travel and other services, increasing inflation pressure across the economy. Bitcoin also declined ahead of a Senate vote on the Clarity Act.
Conclusion:
Higher crude prices and a sharp rise in Treasury yields are the principal near-term drivers for index futures. The Fed policy decision sits at the center of the rates-sensitive market backdrop.
Middle East infrastructure disruptions and Gulf shipping risks are sustaining the energy shock. AI-equity weakness adds index pressure, while higher yields weigh on bonds, metals, and broader risk assets.
Market News Sentiment
Market News Articles: 49
- Neutral: 55.10%
- Positive: 24.49%
- Negative: 20.41%
Sentiment Summary: Of 49 market news articles, 55% were neutral, 24% positive, and 20% negative, indicating predominantly balanced news flow for indices futures day traders.
Conclusion: Neutral coverage was the largest category, while positive sentiment modestly exceeded negative sentiment.
GLD,Gold Articles: 7
- Positive: 42.86%
- Negative: 42.86%
- Neutral: 14.29%
Sentiment Summary: GLD/Gold coverage is evenly split, with 43% positive, 43% negative, and 14% neutral sentiment across 7 articles.
Conclusion: Gold-related news presents a balanced sentiment backdrop for indices futures day traders, with no clear directional bias indicated.
USO,Oil Articles: 17
- Negative: 52.94%
- Positive: 41.18%
- Neutral: 5.88%
Sentiment Summary: USO/oil coverage is mixed with a negative tilt, with 53% negative, 41% positive, and 6% neutral articles across 17 items.
Conclusion: Oil-related news sentiment is modestly negative, which may remain a relevant cross-market input for indices futures traders.
Market Data Snapshot
ETF Snapshot of major stock market ETFs, Mag7, and others as of: September 15, 2026 07:16
Top Movers & Losers
- GOOG 345.71 Bullish 3.06% ▲
- META 665.60 Bullish 2.71% ▲
- IBIT 44.74 Bullish 2.22% ▲
- GLD 392.84 Bearish -1.49% ▼
- TSLA 358.97 Bearish -1.77% ▼
- NVDA 210.96 Bearish -3.36% ▼
Major Index ETFs: SPY, QQQ, DIA, IWM, IJH
- DIA 524.49 Bearish -0.25% ▼
- IWM 287.91 Bearish -0.34% ▼
- SPY 760.88 Bearish -0.45% ▼
- QQQ 709.18 Bearish -0.80% ▼
- IJH 73.79 Bearish -0.87% ▼
Major Index ETFs are Bearish across the group: IJH is the most bearish mover at -0.87%, followed by QQQ at -0.80% and SPY at -0.45%. DIA is the least negative mover at -0.25%, while IWM is down -0.34%.
Mag 7 Stocks: AAPL, MSFT, GOOG, AMZN, META, NVDA, TSLA
- GOOG 345.71 Bullish 3.06% ▲
- META 665.60 Bullish 2.71% ▲
- MSFT 505.41 Bullish 1.97% ▲
- AAPL 333.08 Bullish 0.24% ▲
- AMZN 253.54 Bearish -1.26% ▼
- TSLA 358.97 Bearish -1.77% ▼
- NVDA 210.96 Bearish -3.36% ▼
Mixed: GOOG is the most bullish mover at +3.06%, followed by META at +2.71% and MSFT at +1.97%. AAPL is modestly Bullish at +0.24%. NVDA is the most bearish mover at -3.36%, with TSLA Bearish at -1.77% and AMZN Bearish at -1.26%.
Cross-Market ETFs: TLT, GLD, USO, IBIT
- IBIT 44.74 Bullish 2.22% ▲
- USO 156.66 Bullish 1.14% ▲
- TLT 80.93 Bullish 0.07% ▲
- GLD 392.84 Bearish -1.49% ▼
Mixed cross-market context: IBIT is the most bullish mover at +2.22%, followed by USO at +1.14%. TLT is marginally bullish at +0.07%, while GLD is the most bearish mover at -1.49%.
ETF, Mag7, and Cross-Market ETF Insights
Overall Tone
Mixed: Mag7 leadership and Bitcoin strength were Bullish, while broad equity ETFs were Bearish and cross-market positioning was divergent.
Equity ETFs and Mag7:
Major Index ETFs were broadly Bearish, led lower by IJH at -0.87% and QQQ at -0.80%, while DIA was the least negative mover at -0.25%; SPY declined -0.45% and IWM fell -0.34%. Mag7 performance was selective: GOOG was the most bullish mover at +3.06%, followed by META at +2.71% and MSFT at +1.97%, while NVDA was the most bearish mover at -3.36%, with TSLA down -1.77% and AMZN down -1.26%. AAPL was marginally Bullish at +0.24%.
Cross-Market ETFs:
Cross-market ETFs were Mixed, with IBIT the most bullish mover at +2.22% and USO also Bullish at +1.14%. GLD was the most bearish mover at -1.49%, diverging from IBIT and USO, while TLT was near-flat and marginally Bullish at +0.07%.
Futures Indices – Higher Time Frame Analysis
Summary of the current state of US Indices Futures based on higher time-frame (HTF) technical analysis as of: 2026-09-15: 07:16 CT.
US Indices Futures
- ES YSFG/WSFG up, MSFG down; beneath short benchmarks; 7645 support, 7780.75 reversal, 7834.25-7850.25 resistance; weekly retracement below 7906.25.
- NQ YSFG/WSFG up, MSFG down; daily benchmarks down; 29107.25 support, 29864.25 reversal, 30064-30110.75 resistance; weekly range 28108.25-30842.25.
- YM YSFG up, MSFG/WSFG below F0%; short benchmarks declining; 51992-52199 support, 52990 reversal, 54330 and 54884 resistance.
- EMD YSFG up, MSFG/WSFG down; below benchmarks through 100-day; 3652.1-3656.1 support, 3743.7 reversal, 3856.3 and 3941.7 resistance.
- RTY YSFG up, MSFG down; beneath short/intermediate benchmarks; 2891.4 support, 2965.2 reversal, 3005.4-3102.0 resistance; weekly swing retraces.
- FDAX YSFG up, MSFG/WSFG down; below short benchmarks; 25180 and 25388 support, 25726 reversal, 26660-26665 resistance.
Overall State
- Short-Term: Bearish
- Intermediate-Term: Bearish
- Long-Term: Bullish
Conclusion
Daily structures are uniformly bearish, with downside pivot sequences and price below short-term benchmarks across the group. Weekly and monthly conditions are mixed-to-down, while YSFG positioning and rising long-term benchmarks retain broadly bullish long-term structure. ES, NQ, YM, EMD, RTY, and FDAX remain within corrective phases beneath stated pivot-reversal and resistance references.
Note: Intra-day counter-trend pullbacks or retracements may occur, HTF is context for informational usage and market structure. Glossary: Session Fib Grids periods of YSFG:’Yearly’, MSFG:’Monthly’, WSFG:’Weekly’
For full details visit: AlphaWebTrader Technicals
ES Daily View
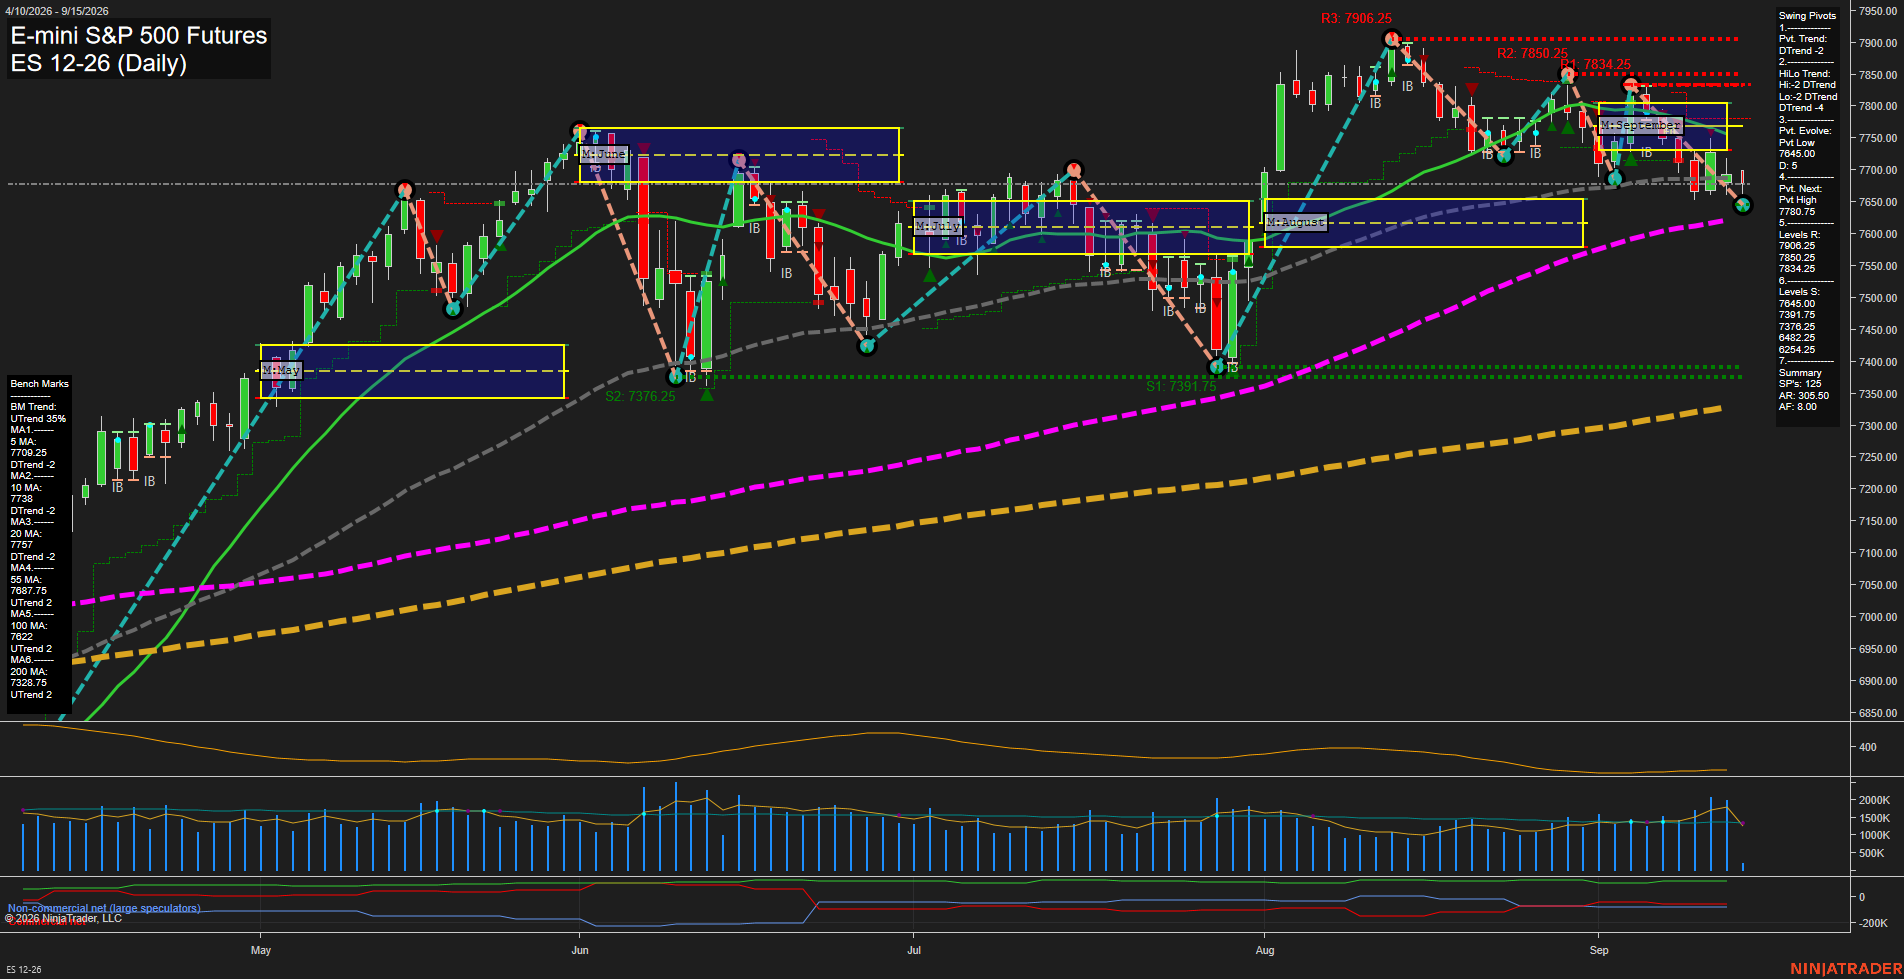
Overall Rating
- Short-Term: Bearish
- Intermediate-Term: Bearish
- Long-Term: Bullish.
Key Insights Summary
Price is consolidating near 7654.50 after a decline from the August high near 7906.25. Short-term pivot and HiLo structures are both in DTrend, while price remains below the 5-, 10-, 20-, and 55-day benchmarks. The weekly grid remains positive, but the September monthly grid is negative and price is below its monthly F0%/NTZ area, confirming a countertrend pullback within the broader yearly uptrend. The 7645.00 pivot-low area is the immediate structural support, while 7780.75 is the next pivot-reversal level and 7834.25 to 7850.25 forms the main overhead resistance band. Long-term structure remains constructive above rising 100- and 200-day averages, although current price action reflects a bearish, volatile retracement phase.
View charts on: AlphaWebTrader HTF Charts
NQ Daily View
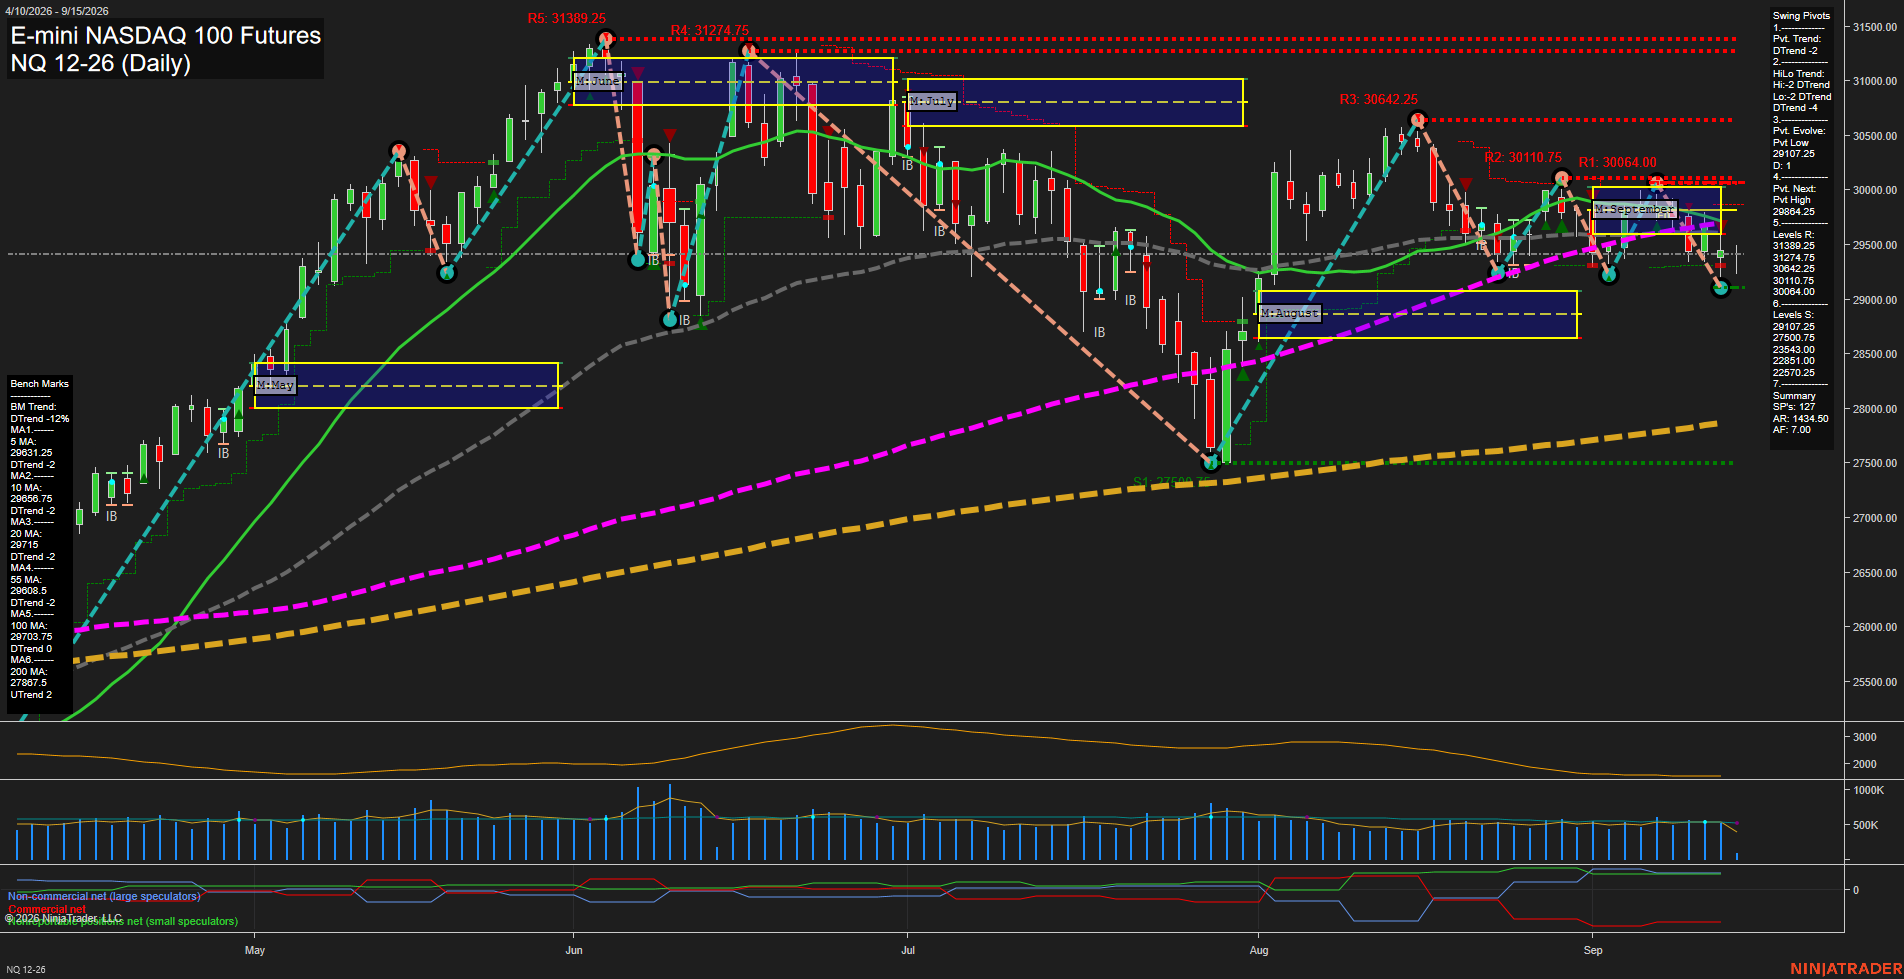
Overall Rating
- Short-Term: Bearish
- Intermediate-Term: Bearish
- Long-Term: Bullish.
Key Insights Summary
Daily structure is in a short-term and intermediate-term downswing, with price below the 5, 10, 20, 55, and 100-day benchmarks and beneath September MSFG F0%. The decline from the 30642.25 swing high has produced lower highs and a renewed test of the 29107.25 pivot-support area. Weekly positioning remains positive and the yearly structure remains upward, supported by price well above the rising 200-day benchmark. This creates a longer-term bullish backdrop beneath a corrective, choppy near-term phase; 29864.25 is the active pivot-reversal level, while 30064.00 through 30110.75 forms the first notable overhead resistance zone.
View charts on: AlphaWebTrader HTF Charts
CL Daily View
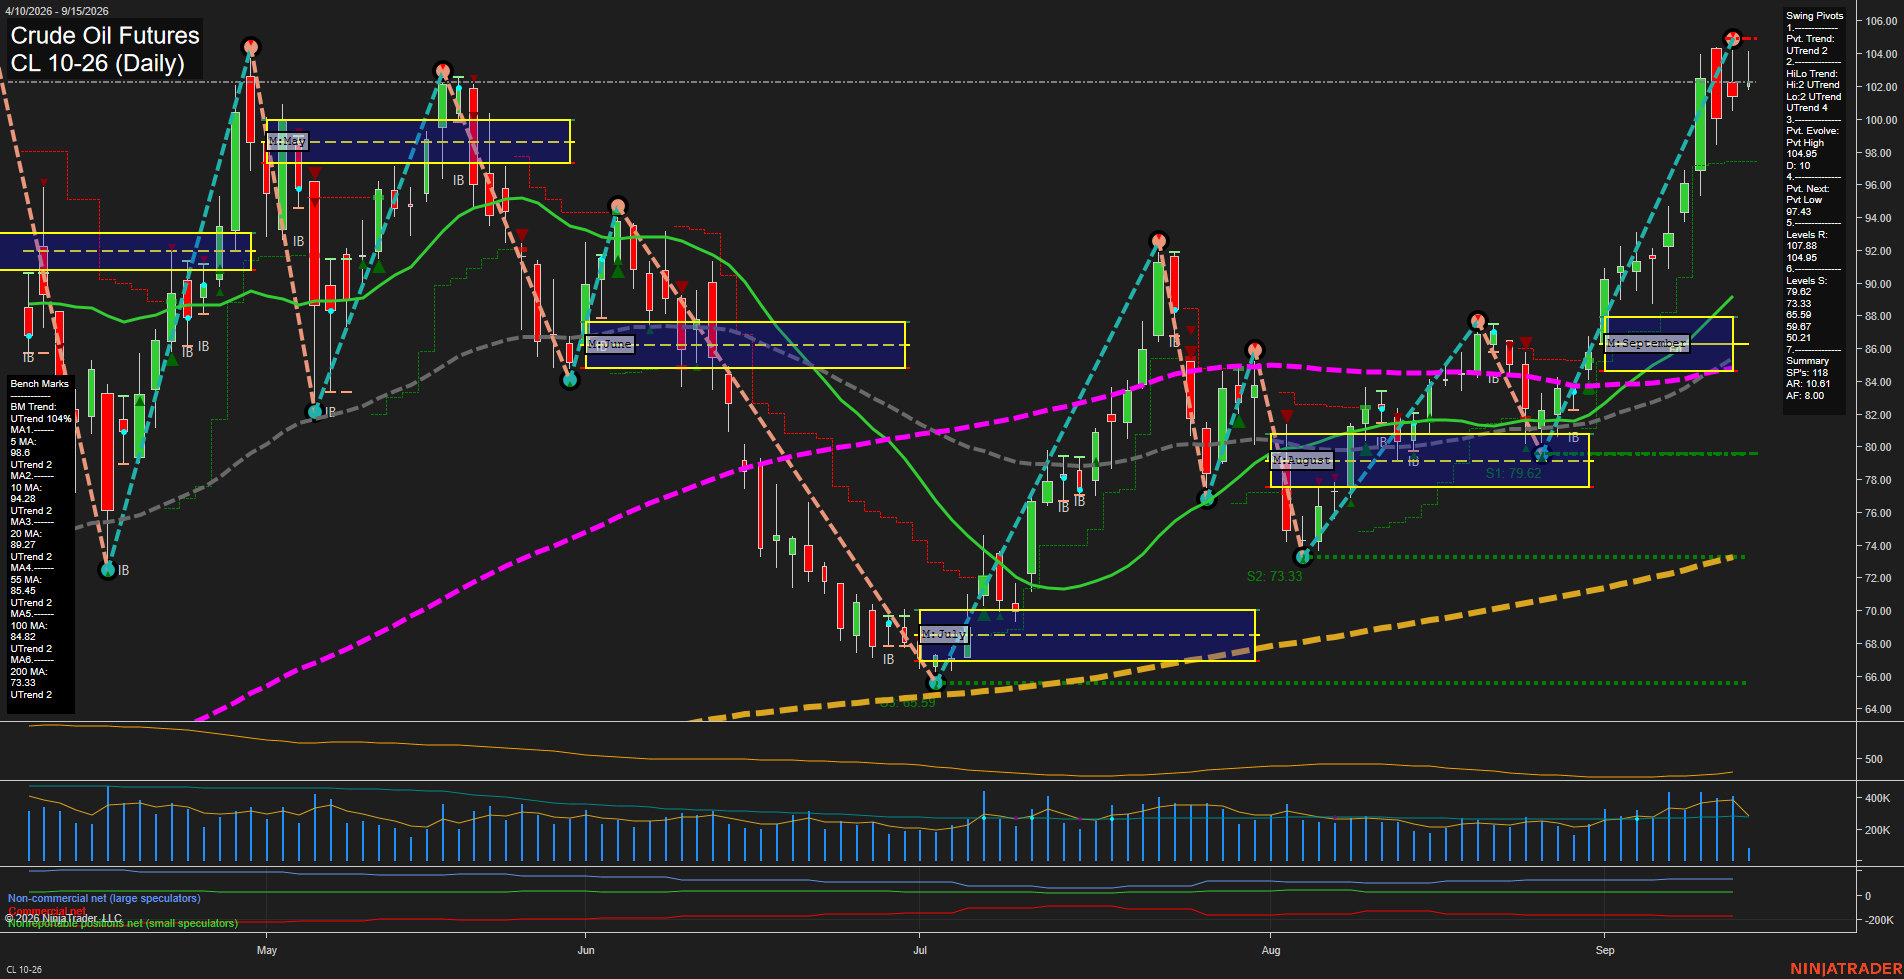
Overall Rating
- Short-Term: Bullish
- Intermediate-Term: Bullish
- Long-Term: Bullish.
Key Insights Summary
Price remains in a broad upside swing structure, with price above every daily benchmark and both pivot-trend measures in UTrend. The September advance accelerated sharply from the August higher low near 79.62 and reached a new pivot high at 104.95. Large recent bars and fast momentum reflect expanded volatility and a potentially frothy late-stage rally condition. The rejection from the 104.95 pivot high has created a short-term pullback, while 97.43 is the stated reversal level for a new pivot low. The weekly, monthly, and yearly Fib-grid biases remain above their respective F0% areas, preserving the prevailing bullish trend alignment despite the near-term two-way price action.
View charts on: AlphaWebTrader HTF Charts
GC Daily View
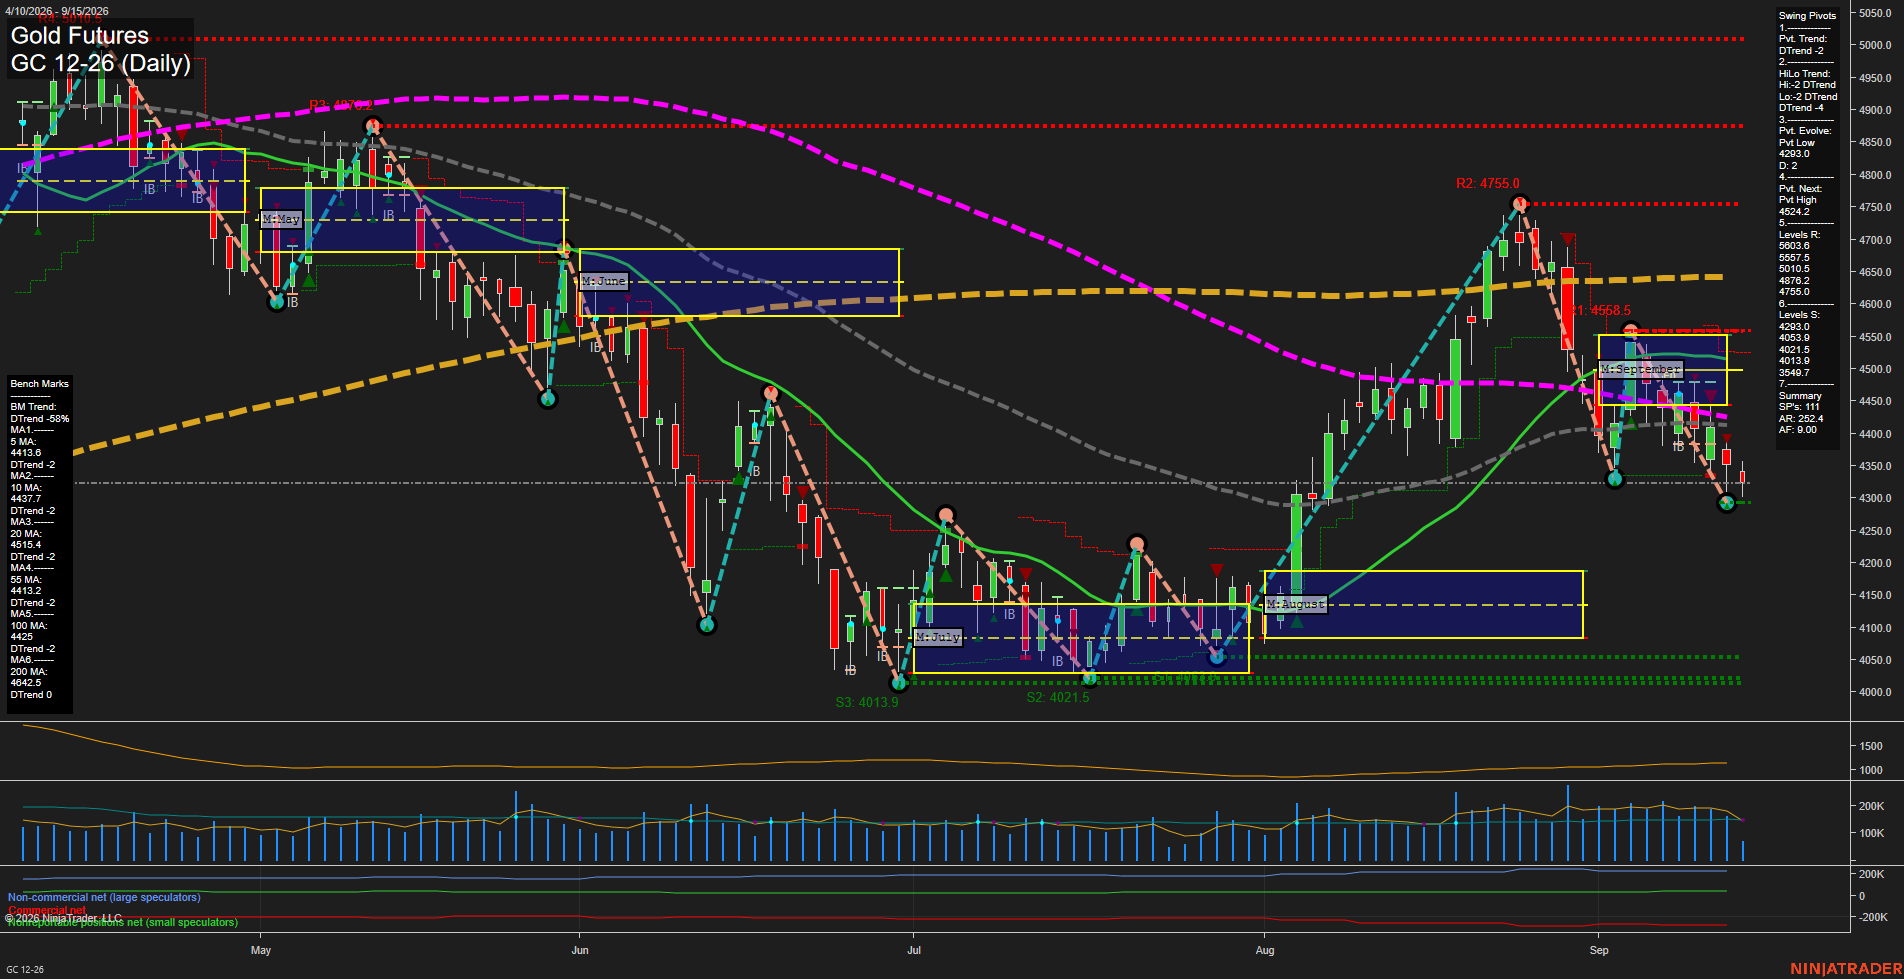
Overall Rating
- Short-Term: Bearish
- Intermediate-Term: Bearish
- Long-Term: Bearish.
Key Insights Summary
Gold futures remain in a broad bearish swing structure, with price below every benchmark average and both pivot trend measures in DTrend. The August rally peaked near 4755.0 and was followed by a sharp rejection, lower highs, and a renewed decline toward the 4293.0 pivot-low support. Price is below the weekly, monthly, and yearly Fib-grid centers, while small recent bars reflect slowing momentum after the selloff rather than a confirmed reversal. The 4542.2 pivot-next level defines the nearest upside swing threshold, with 4293.0 the immediate downside reference.
View charts on: AlphaWebTrader HTF Charts
ZB Daily View
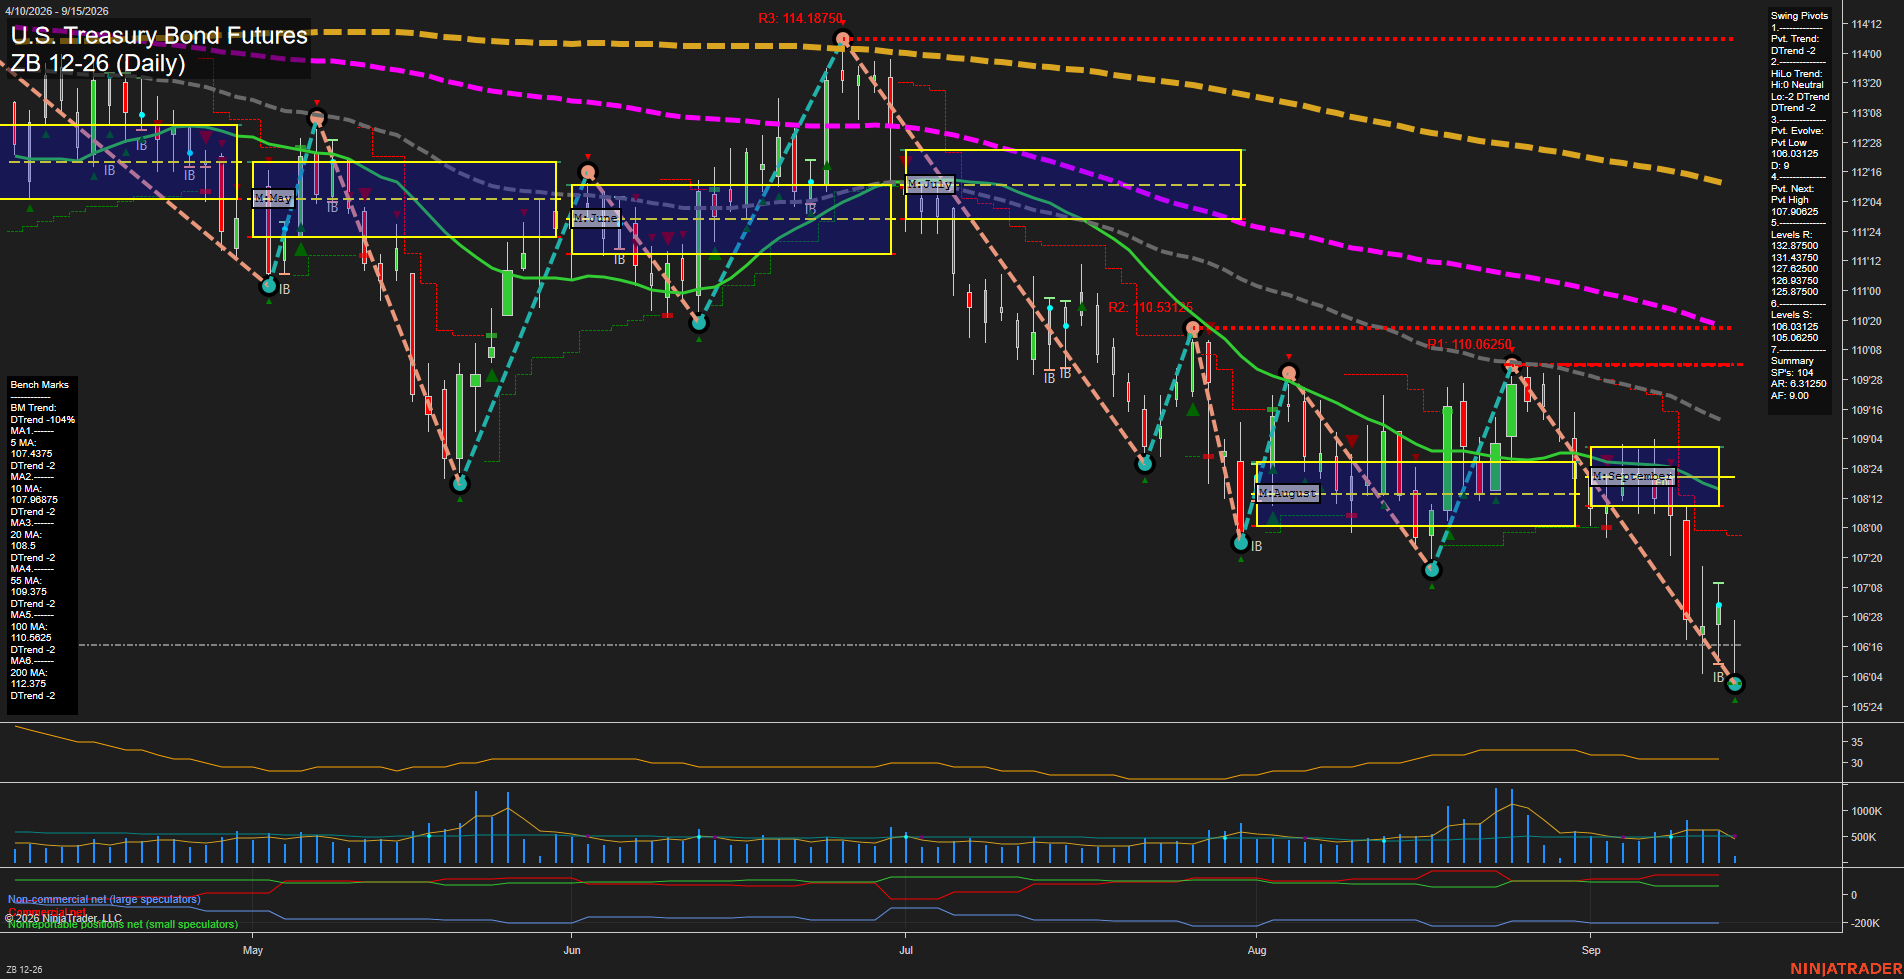
Overall Rating
- Short-Term: Bearish
- Intermediate-Term: Bearish
- Long-Term: Bearish.
Key Insights Summary
The daily structure remains decisively bearish: price is beneath every benchmark average, the short-term pivot trend is down, and the September monthly grid is trading below its lower NTZ area. The market has extended a sharp selloff into the 106:16 area and is attempting a modest bounce from the 106.03125 support zone, but the rebound has not yet altered the sequence of lower highs and lower lows. A pivot reversal condition is identified above 107.90625; until that level is exceeded, rallies remain counter-trend within the broader decline. The nearby 106.03125 and 105.06250 supports frame the current downswing, while declining 5-, 10-, 20-, 55-, 100-, and 200-day averages reflect bearish alignment across all major swing horizons.
View charts on: AlphaWebTrader HTF Charts