NYSE pre-market futures rose ahead of the Fed as short-term technical weakness met 5% Treasury yields, $100 oil and Middle East disruptions.
Fundamentals: U.S. index futures held early gains as markets awaited the Federal Reserve decision, with a potential rate increase, updated projections and the press conference in focus. Treasury yields near 5% and crude above $100 maintained pressure on rate-sensitive assets, while Middle East supply disruptions and tanker cyberattacks added to energy-market uncertainty.
Technicals: US index futures enter the NYSE pre-market session with bearish short-term and intermediate-term technical readings across ES, NQ, YM, EMD, RTY and FDAX. Price action reflects corrective pullbacks below key short-term benchmarks, while rising longer-term averages and positive yearly grids generally preserve broader bullish structures. USO led prior-session ETF gains, while IBIT was among the notable decliners.
Pre-Market Trading 360° view Market Radar of: holidays, earnings, eco-news, market-news summary, news sentiment, prior session major ETFs, MAG7, Higher Time Frame Analysis Indices Futures Summary, and E-mini S&P500, Nasdaq 100, NYMEX Crude, Gold Futures Daily Chart analysis.
As of: September 16, 2026 07:16 CT
EcoNews Radar U.S. Events
| Day | Time | Impact | Event |
|---|---|---|---|
| Wed | 08:30 | Medium | Core Retail Sales m/m |
| Wed | 08:30 | Medium | Retail Sales m/m |
| Wed | 10:30 | Low | Crude Oil Inventories |
| Wed | 14:00 | High | Federal Funds Rate |
| Wed | 14:00 | High | FOMC Economic Projections |
| Wed | 14:00 | High | FOMC Statement |
| Wed | 14:30 | High | FOMC Press Conference |
| Thu | 08:30 | Medium | Philly Fed Manufacturing Index |
| Thu | 08:30 | Medium | Unemployment Claims |
EcoNews Summary
Wednesday’s 14:00–14:30 FOMC releases form the week’s central high-impact risk window for U.S. index futures. The Federal Funds Rate decision, policy statement, economic projections, and press conference provide updated Federal Reserve policy direction, rate-path assumptions, and economic assessments. Market momentum and volume often slow ahead of FOMC announcements, with increased volatility at release time.
Event Notes:
- Wednesday 14:00 Federal Funds Rate: The Federal Reserve’s target interest-rate decision. Index futures traders monitor the decision for its direct connection to borrowing costs, financial conditions, inflation policy, and equity valuations.
- Wednesday 14:00 FOMC Economic Projections: Federal Reserve participants’ projections for economic growth, inflation, unemployment, and the policy-rate path. Traders monitor changes in the projected rate path and economic outlook.
- Wednesday 14:00 FOMC Statement: The Federal Reserve’s formal policy communication explaining its rate decision and assessment of economic and inflation conditions. Changes in language provide context on the policy stance.
- Wednesday 14:30 FOMC Press Conference: The Federal Reserve Chair’s remarks and responses following the policy decision. Traders monitor clarification of the statement, projections, and policy framework.
Conclusion:
The single most important event is Wednesday’s 14:00 Federal Funds Rate decision, accompanied by the FOMC statement and economic projections, followed by the 14:30 press conference. This concentrated FOMC release window is the week’s primary source of high-impact U.S. policy information for index futures.
For full details visit: Forex Factory EcoNews
Market News Summary:
Index futures held an early gain as markets focused on the Federal Reserve decision, elevated Treasury yields, and Middle East-driven energy risks.
Primary Drivers & Risks:
- Primary Driver: Fed decision and 5% yields
- Primary Risk: Iran conflict lifts energy costs
Tone:
Cautious, volatile, and rate-sensitive.
Stock Market / ETFs / Indices:
U.S. stock futures trended higher before the Fed decision, while the S&P 500 faced pressure from a 5% 10-year Treasury yield and oil near $105. Japan’s Nikkei slipped 0.2% as chip-related losses outweighed gains in energy shares and trading houses. Recent U.S. equity-market earnings growth remained strong, though AI-related market leadership and memory-chip scarcity remained cross-currents.
Geopolitical:
The U.S.-Iran conflict continued to disrupt Middle East energy supply. Saudi Arabia suspended Yanbu port oil loadings after an attack on its East-West pipeline, while cyberattacks targeted oil and LNG tankers headed toward the U.S. coast.
Oil / Energy:
Oil prices declined after an unexpected increase in U.S. crude inventories but remained above $100 per barrel and near multimonth highs. Supply disruptions, Houthi advances, tanker-security concerns, and German efforts to increase winter gas storage kept the energy backdrop strained.
Gold / Metals:
Gold and silver faced pressure from tightening expectations and elevated yields, with key technical support levels in focus before the Fed decision. Metals later stabilized as Treasury yields eased.
Fed / Financials:
The Fed decision dominated trading, with strong jobs data and persistent inflation framing a widely discussed 25-basis-point rate increase to 3.75%-4.00%. The 10-year Treasury yield reached a two-decade high near 5%; sustained elevated yields raised concerns for housing, commercial real estate, and heavily indebted companies.
Macro / Other:
Higher oil prices and Treasury yields added to household cost pressures, with estimates placing the combined burden near $1,700 per household. Memory shortages through 2027 were also cited as a cost and supply challenge for smaller phone and laptop makers.
Conclusion:
The Fed decision, Treasury yields near 5%, and crude prices above $100 were the central drivers for index futures. Early futures strength reflected positioning ahead of the policy announcement.
Middle East supply disruptions and tanker cyberattacks kept energy risk elevated despite lower crude prices. High rates, inflation pressure, and consumer energy costs remained material cross-currents for equities.
Market News Sentiment
Market News Articles: 44
- Neutral: 52.27%
- Negative: 27.27%
- Positive: 20.45%
Sentiment Summary: Of 44 market news articles, 52% were neutral, 27% negative, and 20% positive, indicating predominantly neutral coverage with negative sentiment exceeding positive sentiment.
Conclusion: The news flow presents a neutral-to-cautious tone for indices futures day traders.
GLD,Gold Articles: 14
- Negative: 42.86%
- Positive: 28.57%
- Neutral: 28.57%
Sentiment Summary: GLD/Gold coverage is mixed-to-negative, with 43% negative, 29% positive, and 29% neutral articles across 14 items.
Conclusion: For indices futures day traders, gold-related news tone is predominantly negative, though sentiment remains divided.
USO,Oil Articles: 11
- Neutral: 54.55%
- Negative: 27.27%
- Positive: 18.18%
Sentiment Summary: USO/Oil coverage is predominantly neutral (55%), with negative sentiment (27%) exceeding positive sentiment (18%).
Conclusion: Oil-related news tone is neutral overall, with a modest negative skew that may remain relevant to indices futures monitoring.
Market Data Snapshot
ETF Snapshot of major stock market ETFs, Mag7, and others as of: September 16, 2026 07:16
Top Movers & Losers
- USO 161.86 Bullish 3.32% ▲
- META 670.24 Bullish 0.70% ▲
- NVDA 212.17 Bullish 0.57% ▲
- MSFT 497.12 Bearish -1.64% ▼
- AMZN 248.42 Bearish -2.02% ▼
- IBIT 43.11 Bearish -3.64% ▼
Major Index ETFs: SPY, QQQ, DIA, IWM, IJH
- SPY 757.39 Bearish -0.46% ▼
- DIA 521.23 Bearish -0.62% ▼
- QQQ 704.54 Bearish -0.65% ▼
- IJH 73.23 Bearish -0.76% ▼
- IWM 285.14 Bearish -0.96% ▼
Major index ETFs are Bearish across the snapshot: IWM is the most bearish mover at -0.96%, followed by IJH at -0.76%, QQQ at -0.65%, and DIA at -0.62%. SPY is the least negative mover at -0.46%, while broad equity benchmarks remain uniformly lower.
Mag 7 Stocks: AAPL, MSFT, GOOG, AMZN, META, NVDA, TSLA
- META 670.24 Bullish 0.70% ▲
- NVDA 212.17 Bullish 0.57% ▲
- AAPL 331.34 Bearish -0.52% ▼
- TSLA 356.58 Bearish -0.67% ▼
- GOOG 341.43 Bearish -1.24% ▼
- MSFT 497.12 Bearish -1.64% ▼
- AMZN 248.42 Bearish -2.02% ▼
Mixed: META is the most bullish mover at +0.70%, followed by NVDA at +0.57%. AMZN is the most bearish mover at -2.02%, with MSFT down -1.64% and GOOG lower by -1.24%. AAPL is down -0.52% and TSLA is down -0.67%.
Cross-Market ETFs: TLT, GLD, USO, IBIT
- USO 161.86 Bullish 3.32% ▲
- GLD 394.15 Bullish 0.33% ▲
- TLT 80.71 Bearish -0.27% ▼
- IBIT 43.11 Bearish -3.64% ▼
Mixed cross-market context: USO is the most bullish mover at +3.32%, while GLD is modestly Bullish at +0.33%. IBIT is the most bearish mover at -3.64%, and TLT is marginally Bearish at -0.27%.
ETF, Mag7, and Cross-Market ETF Insights
Overall Tone
Bearish equity breadth and a sharply Bearish IBIT move contrast with Bullish oil and modestly Bullish gold, producing a Mixed cross-market tone.
Equity ETFs and Mag7:
Major Index ETFs were broadly Bearish: SPY fell -0.46%, DIA -0.62%, QQQ -0.65%, IJH -0.76%, and IWM -0.96%, with SPY the least negative mover and IWM the most bearish index ETF. Mag7 performance was selective, led by META at +0.70% and NVDA at +0.57%, while AMZN was the most bearish mover at -2.02%; AAPL, GOOG, MSFT, and TSLA were also Bearish.
Cross-Market ETFs:
Cross-market ETFs were Mixed, with USO the most bullish mover at +3.32% and GLD modestly Bullish at +0.33%. TLT was Bearish at -0.27%, while IBIT was the most bearish mover at -3.64%, diverging sharply from oil and gold strength.
Futures Indices – Higher Time Frame Analysis
Summary of the current state of US Indices Futures based on higher time-frame (HTF) technical analysis as of: 2026-09-16: 07:16 CT.
US Indices Futures
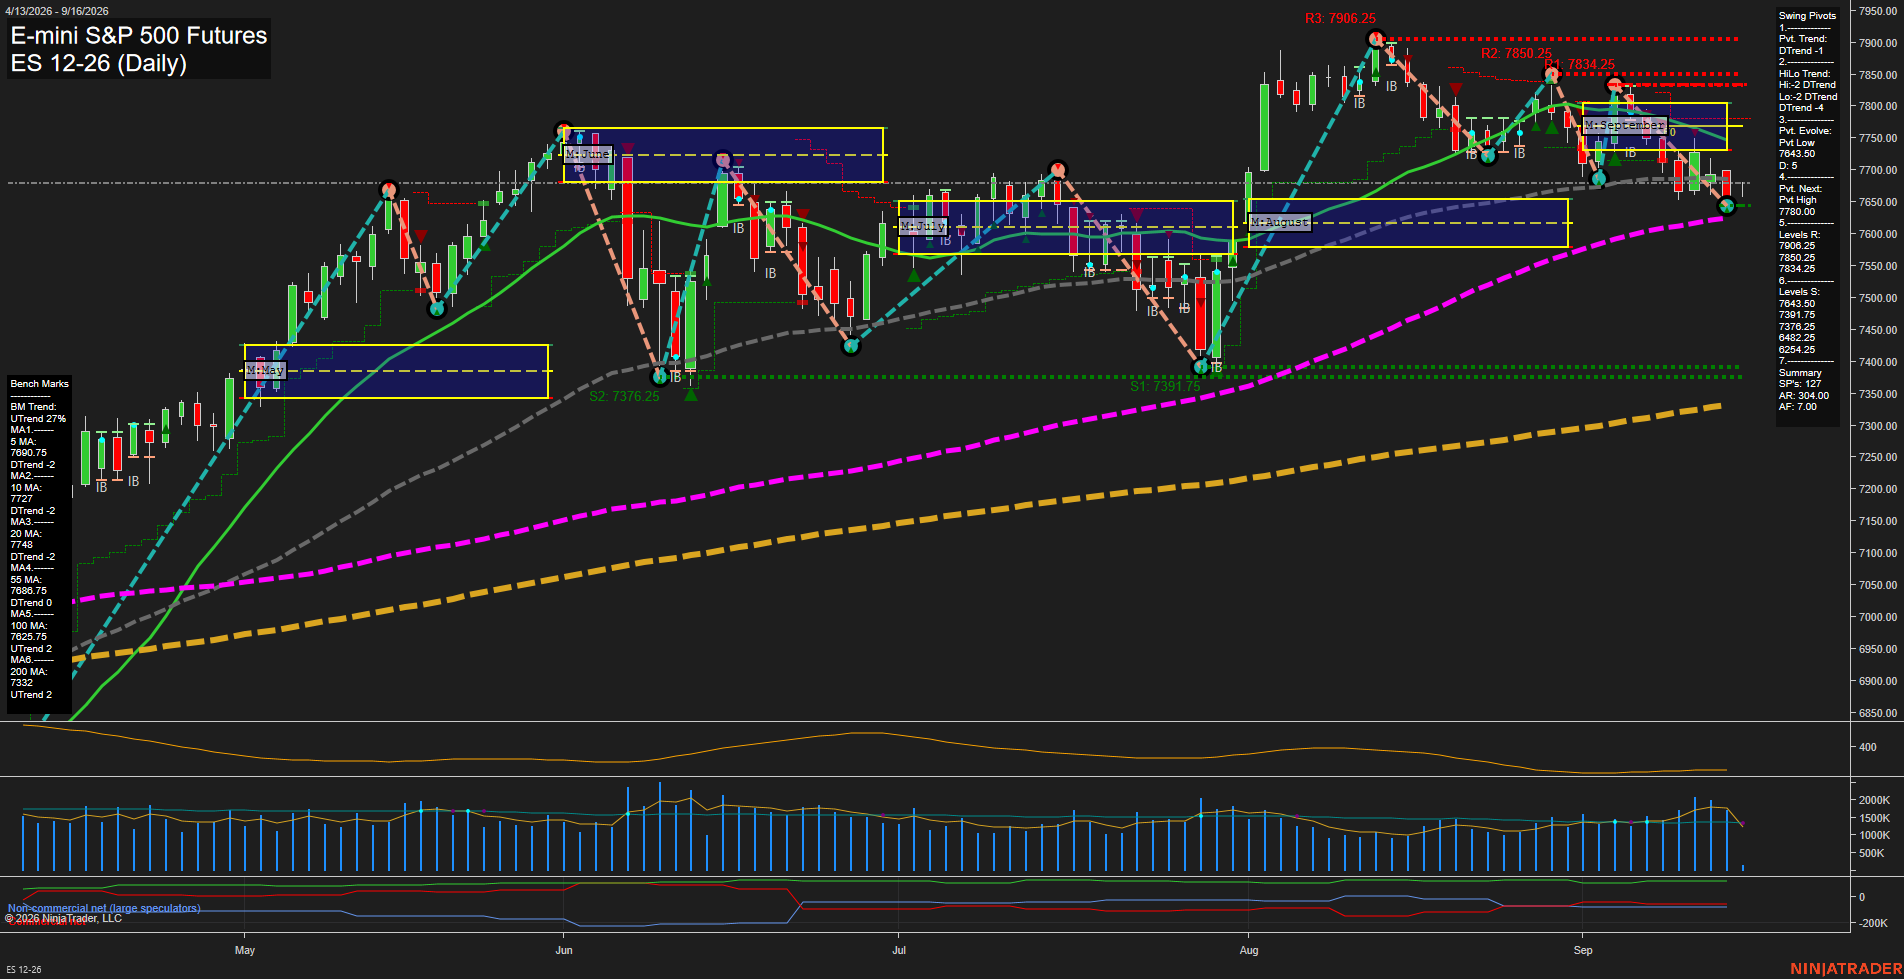
- ES YSFG above F0%, MSFG/WSFG below F0%, below 5–55-day benchmarks, support 7643.50/7517.50, resistance 7834.25–7906.25, weekly short signals active.
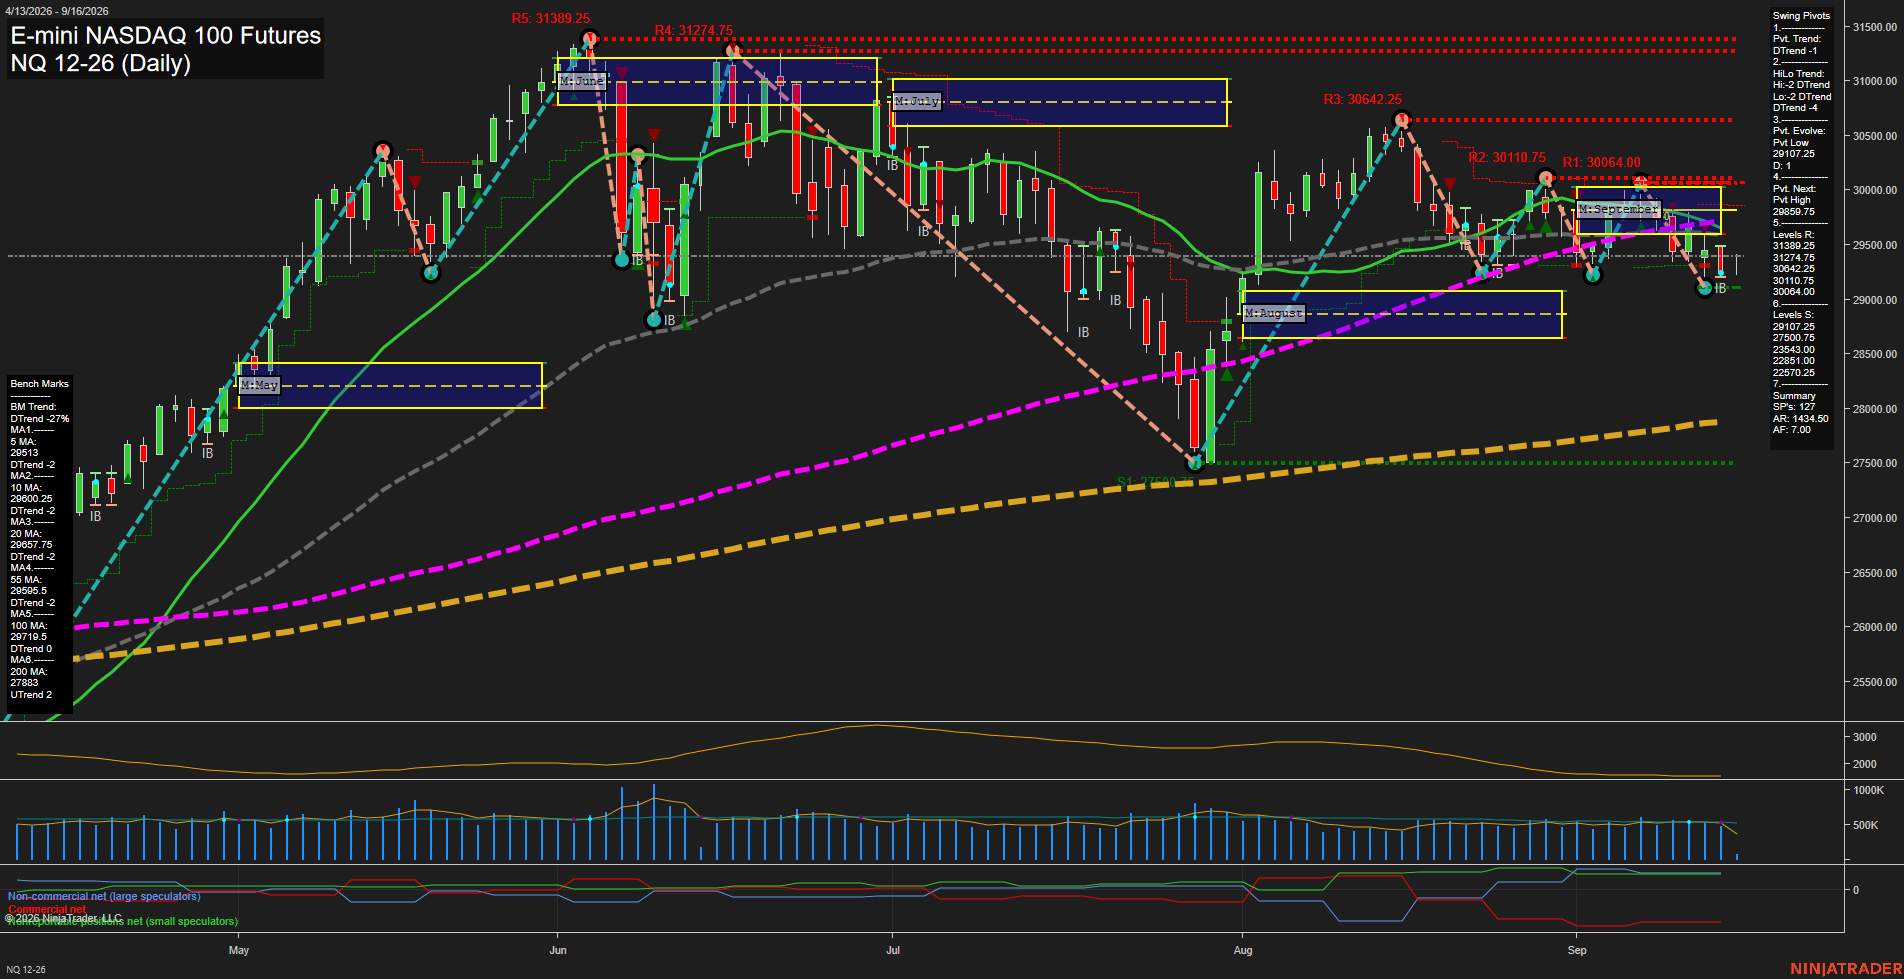
- NQ YSFG above F0%, MSFG below F0%, WSFG above F0%, daily benchmarks declining, support 29107.25/27500.75, resistance 29859.75–31389.25, mixed weekly-daily structure.
- YM YSFG above F0%, MSFG/WSFG below F0%, below short benchmarks, support 51908, resistance 52990/54250/54884, rising 55–200-period benchmarks retain long-term structure.
- EMD YSFG above F0%, MSFG/WSFG below F0%, below 5–100-day benchmarks, support 3655.1–3656.1, resistance 3742.1/3856.3/3941.7, 200-day benchmark remains rising.
- RTY YSFG above F0%, MSFG/WSFG below F0%, below short benchmarks, support 2850.0–2883.6, resistance 3054.2/3101.8, 55–200-week benchmarks remain rising.
- FDAX YSFG above F0%, MSFG/WSFG below F0%, below 10–55-day benchmarks, support 25180, resistance 25724/26588–26665, rising 100–200-day benchmarks underpin long-term trend.
Overall State
- Short-Term: Bearish
- Intermediate-Term: Bearish
- Long-Term: Bullish
Conclusion
US index futures display correlated short-term and intermediate-term retracements, with most daily structures in DTrend below MSFG and WSFG reference areas. ES, YM, EMD, RTY, and FDAX weekly structures are also short-term bearish; NQ weekly structure remains UTrend but has intermediate MSFG pressure. Rising longer-term benchmarks and YSFG positioning maintain a broader bullish structure, while listed swing lows and pivot-reversal levels define current HTF support and resistance.
Note: Intra-day counter-trend pullbacks or retracements may occur, HTF is context for informational usage and market structure. Glossary: Session Fib Grids periods of YSFG:’Yearly’, MSFG:’Monthly’, WSFG:’Weekly’
For full details visit: AlphaWebTrader Technicals
ES Daily View
Overall Rating
- Short-Term: Bearish
- Intermediate-Term: Bearish
- Long-Term: Bullish.
Key Insights Summary
Price is in a fast short-term pullback from the August peak near 7906.25, with lower highs and lower lows confirming DTrend conditions in both pivot measures. The decline is trading beneath the 5, 10, 20, and 55-day benchmarks and below the September MSFG F0% area, reinforcing the intermediate corrective phase. The 7643.50 pivot-low area is the immediate structural support, while 7834.25, 7850.25, and 7906.25 define the overhead resistance ladder. Despite the current correction, the rising 100-day and 200-day benchmarks and positive yearly grid position preserve the broader long-term upward structure.
View charts on: AlphaWebTrader HTF Charts
NQ Daily View
Overall Rating
- Short-Term: Bearish
- Intermediate-Term: Bearish
- Long-Term: Bullish.
Key Insights Summary
Price is consolidating below the declining 5, 10, 20, 55, and 100-day benchmarks, while the pivot structure remains in a short- and intermediate-term DTrend. The September MSFG remains below its F0% area, framing the current action as a countertrend retracement within the broader yearly uptrend. Recent bars are relatively small and momentum has slowed following the rejection from the 30064.00 to 30110.75 resistance zone. The 29107.25 pivot-low support is the immediate structural reference, while 29859.75 is the next pivot-reversal threshold; the rising 200-day average and positive yearly grid preserve the longer-term bullish backdrop.
View charts on: AlphaWebTrader HTF Charts
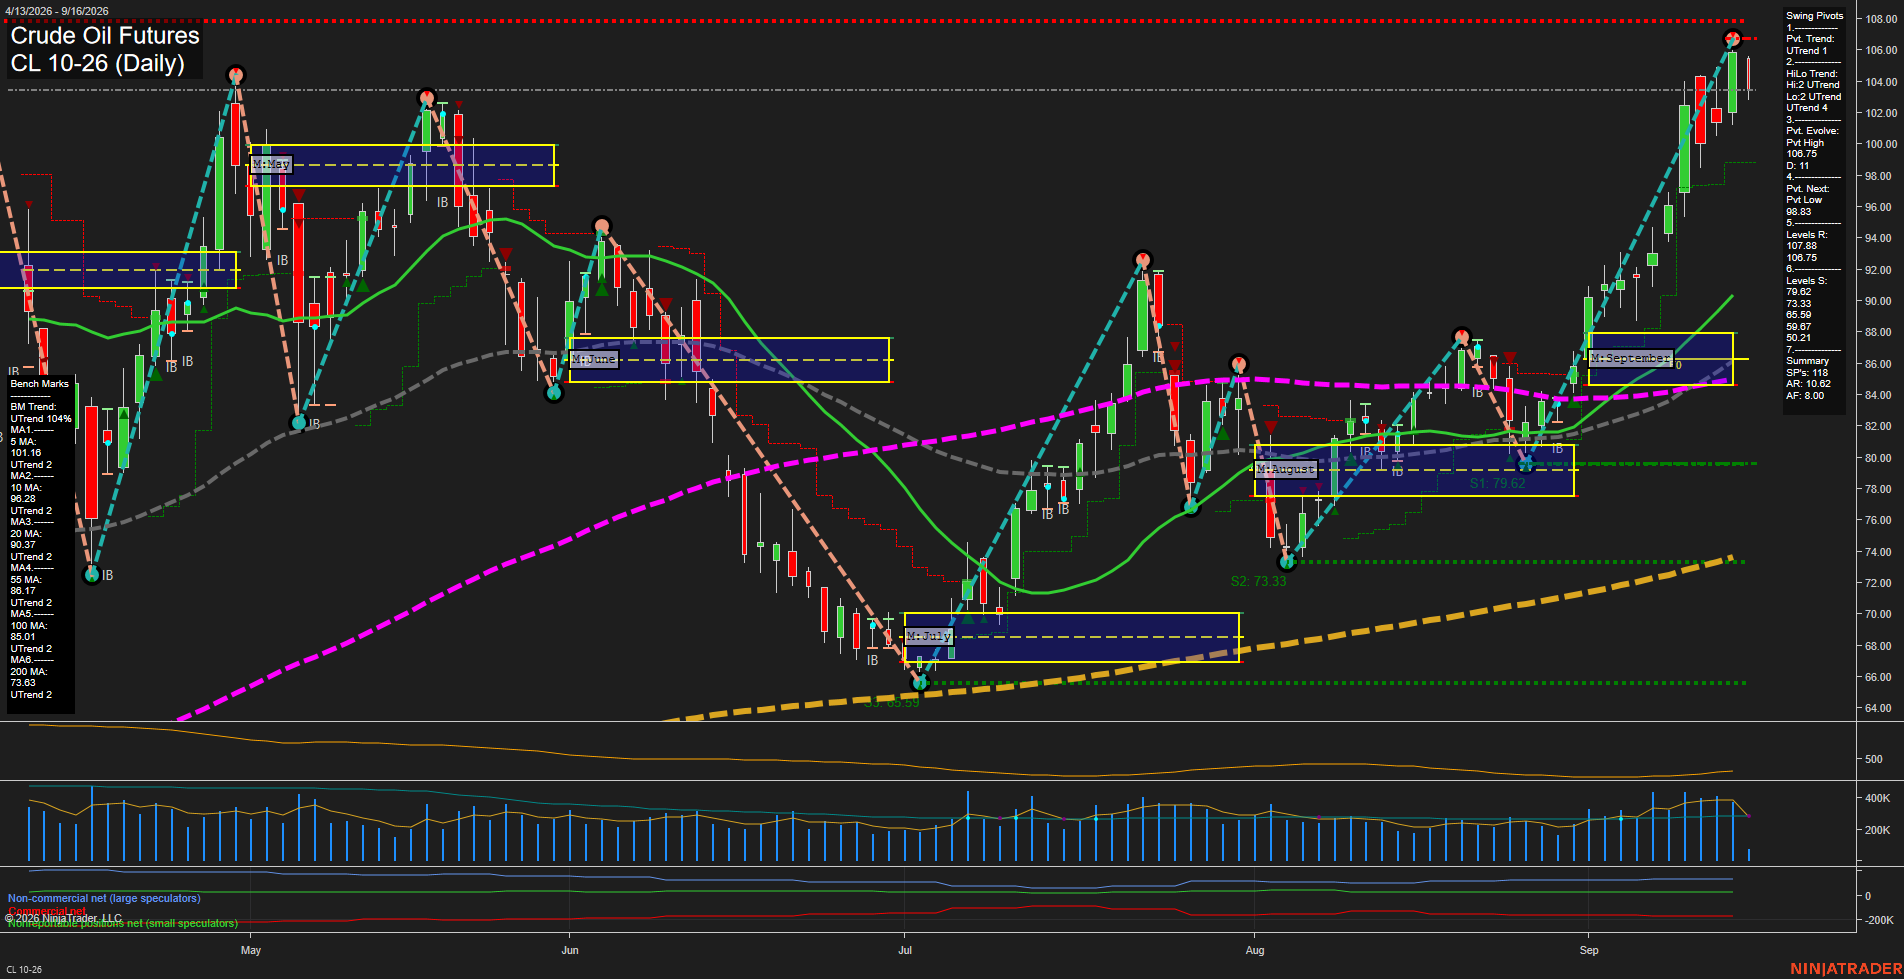
CL Daily View
Overall Rating
- Short-Term: Bullish
- Intermediate-Term: Bullish
- Long-Term: Bullish.
Key Insights Summary
Price is in a fast, large-range upside expansion, closing near the evolving 106.75 pivot high after a sequence of higher highs and higher lows from the August low. Short-term and intermediate pivot structures are aligned upward, while price remains above every benchmark average and above the weekly, monthly, and yearly Fib-grid reference zones. The immediate structure is testing the 106.75 to 108.75 resistance area; 98.83 is the pivot-reversal reference, with the prior September grid and lower swing supports substantially beneath current price. Rising participation and elevated range behavior reflect a momentum-driven breakout phase rather than a quiet consolidation.
View charts on: AlphaWebTrader HTF Charts
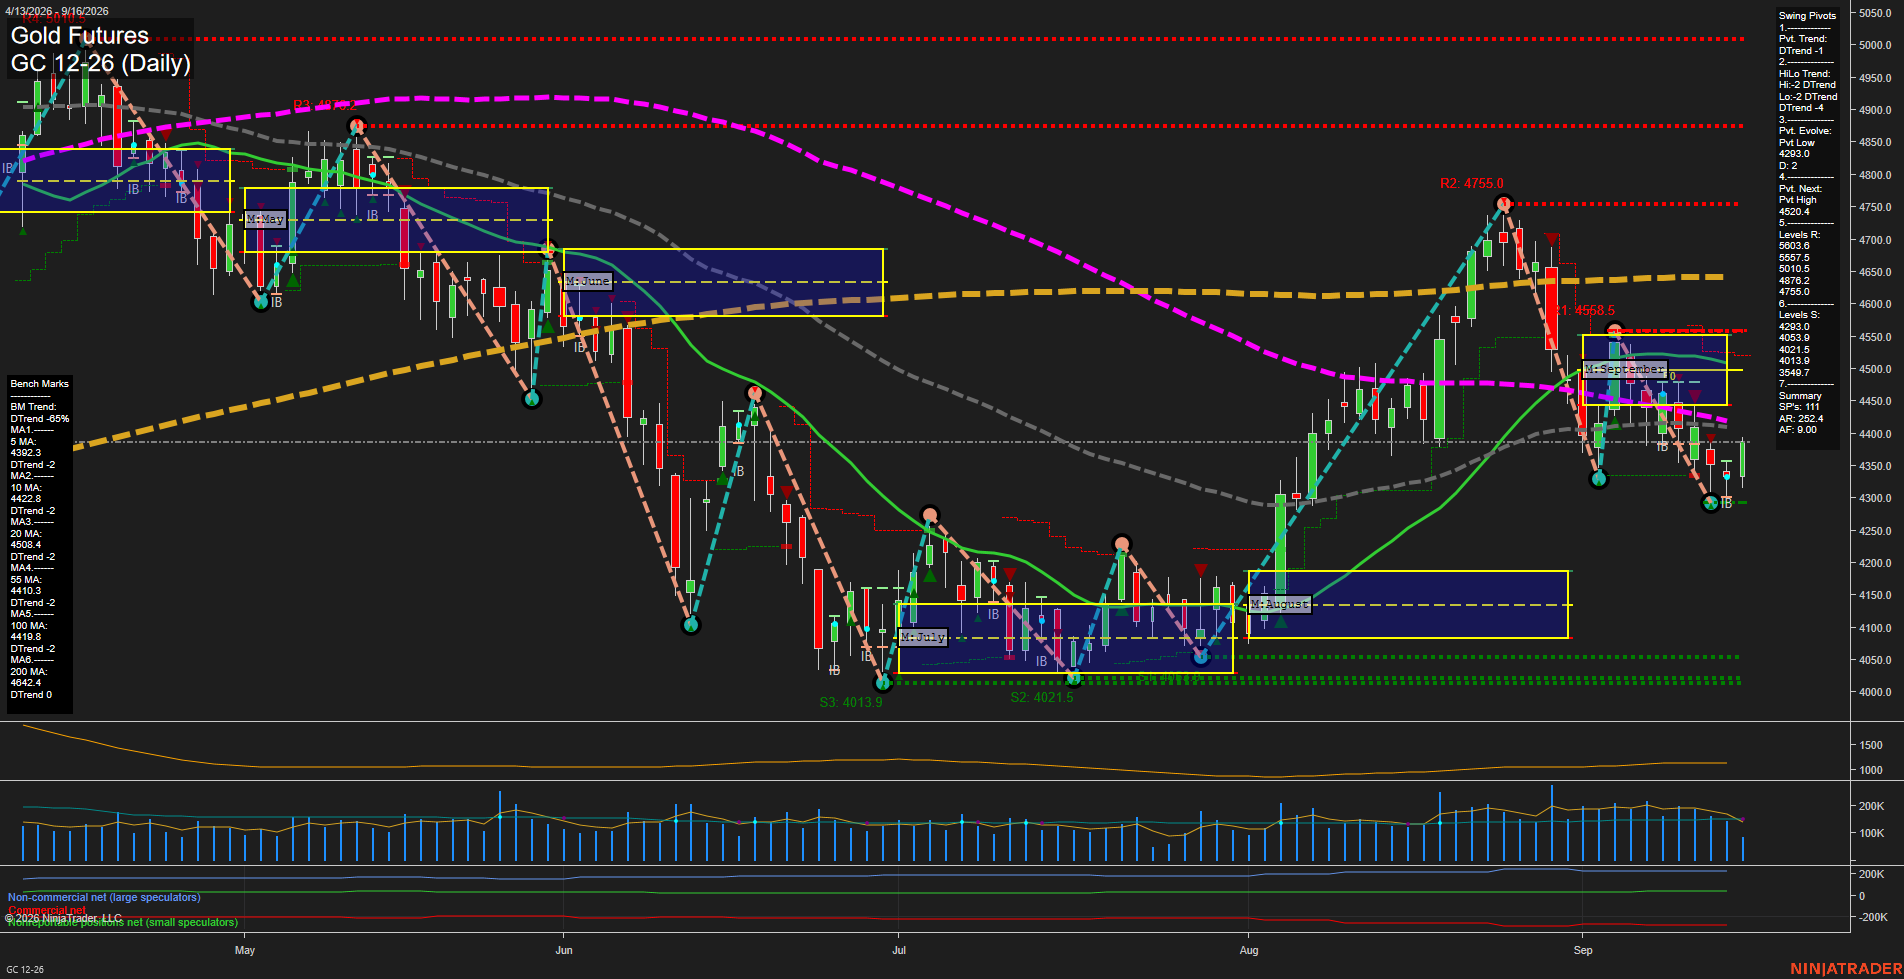
GC Daily View
Overall Rating
- Short-Term: Bearish
- Intermediate-Term: Bearish
- Long-Term: Bearish.
Key Insights Summary
GC is consolidating after a sharp decline from the 4755 pivot high, with small daily bars and slowing momentum indicating a near-term balance phase. The weekly grid remains marginally constructive above its F0% level, but the monthly and yearly grids remain negative. Both pivot structures are in DTrend, price is below the 10-, 20-, 55-, and 200-day benchmarks, and the recent short-term and intermediate-term signals align with the prevailing bearish structure. The 4293.0 pivot low is the closest defined support, while 4410.3 to 4520.4 represents an overhead benchmark and pivot-resistance zone.
View charts on: AlphaWebTrader HTF Charts
ZB Daily View
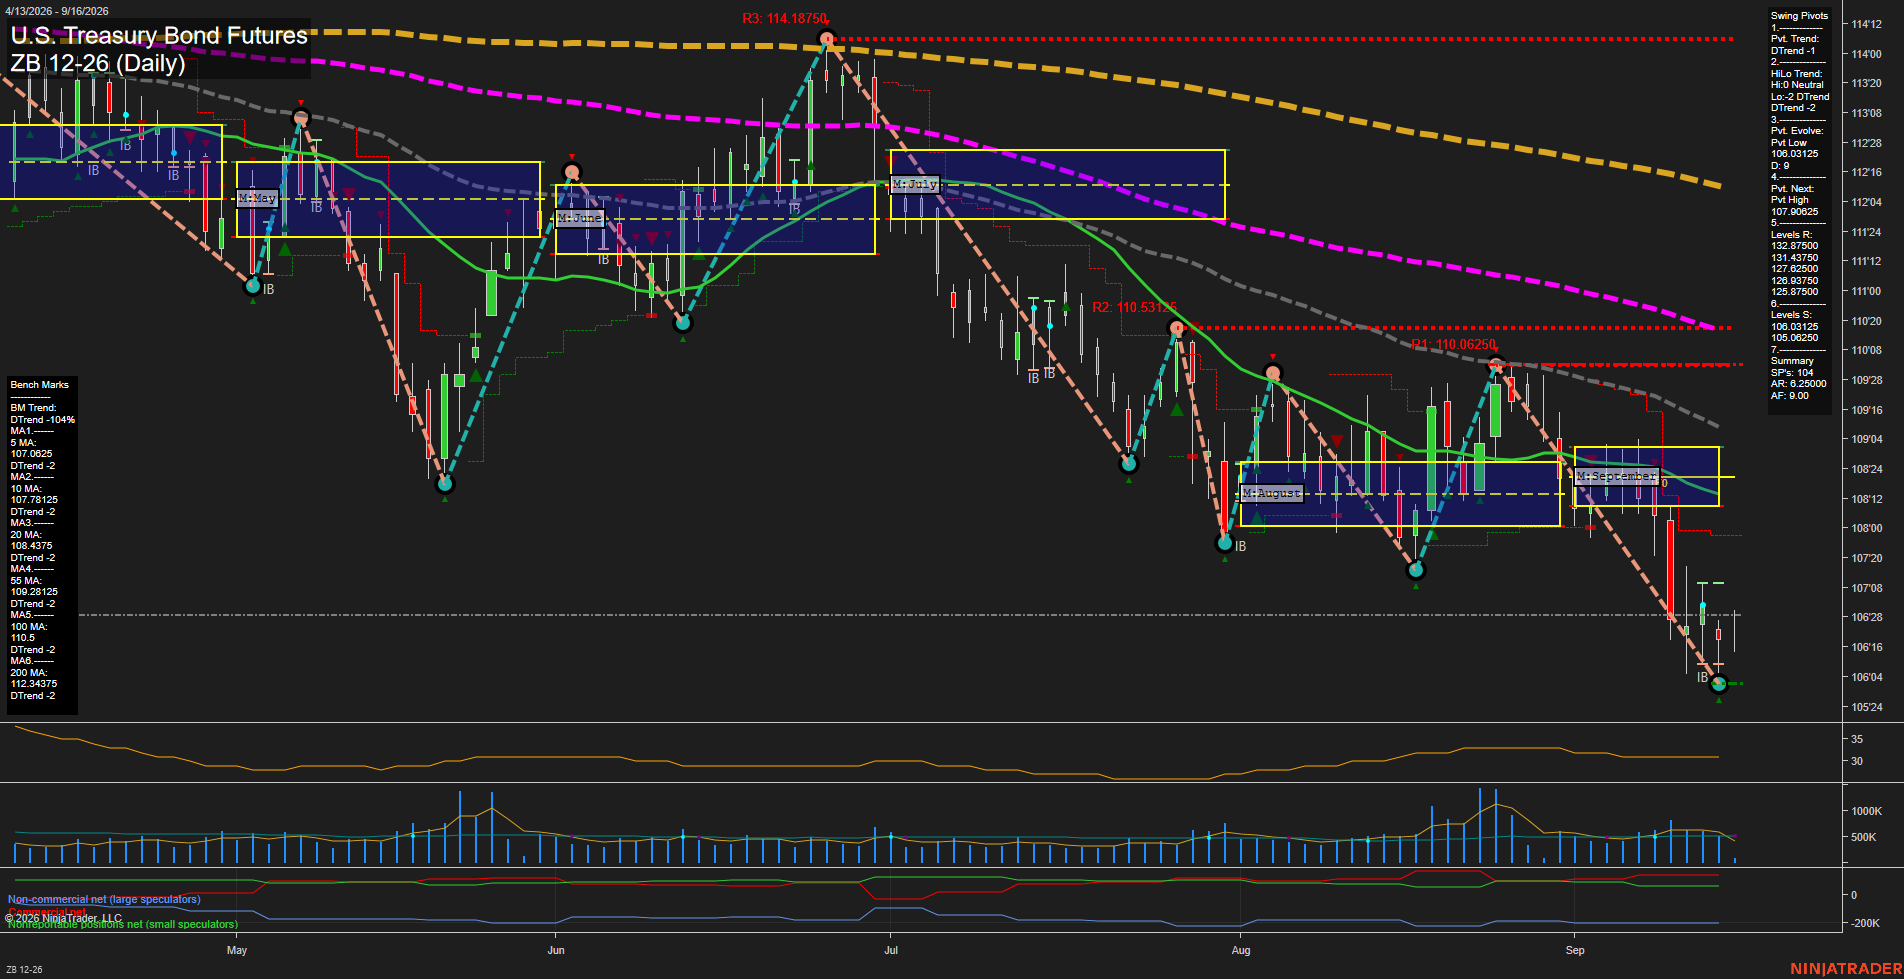
Overall Rating
- Short-Term: Bearish
- Intermediate-Term: Bearish
- Long-Term: Bearish.
Key Insights Summary
Price remains in a broad daily decline, trading beneath every benchmark average and below the September monthly NTZ. The swing-pivot structure retains a short-term and intermediate-term DTrend, with the recent 106'04 pivot low defining immediate support. The decline accelerated through the September range, then shifted into small-bodied consolidation near the lows, indicating slower downside momentum after a sharp selloff. Resistance is layered first near the 5-day and 10-day averages, with the next confirmed opposite pivot level at 107'29; the larger moving-average structure remains firmly downward sloped.
View charts on: AlphaWebTrader HTF Charts