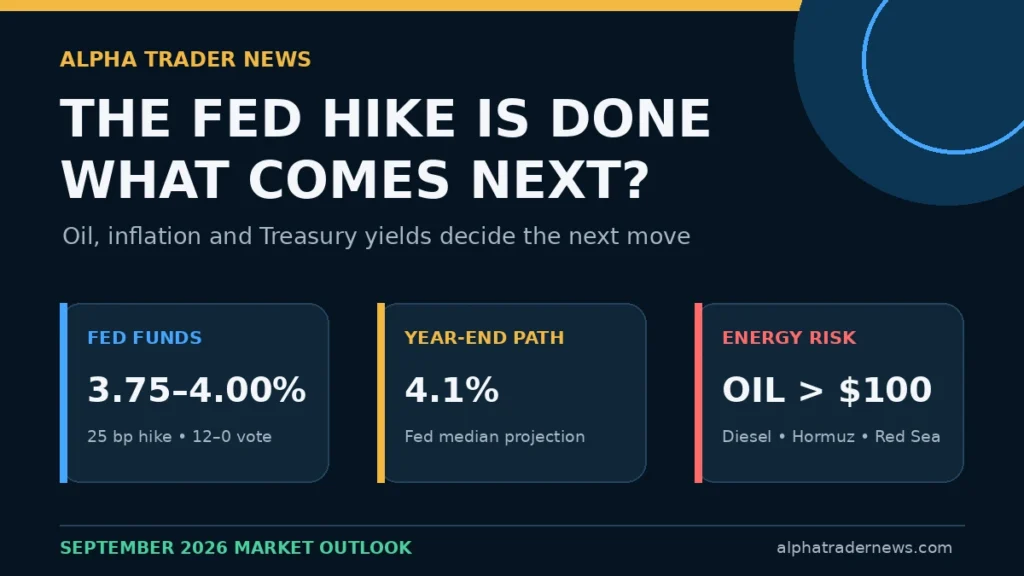
The Federal Reserve’s quarter-point rate increase was already largely priced in. The market-moving information was the unanimous vote, the higher projected rate path and the message that inflation—not the latest single data point—will determine what comes next.
The immediate question for traders is no longer whether the Fed would raise rates. It is whether crude oil, diesel, import costs and Treasury yields continue to confirm an inflation problem serious enough to produce another increase in October or December.
Updated September 17, 2026. Market prices in this article use the September 16 close and a September 17 pre-market snapshot at approximately 7:05 a.m. ET.
Key Takeaways
- The Federal Open Market Committee raised the federal funds target range by 25 basis points to 3.75%–4.00% in a unanimous 12–0 decision.
- The September projections were more important than the hike: the median year-end policy-rate estimate rose to 4.1%, consistent with another quarter-point increase before the end of 2026.
- Wall Street initially sold off, short-term Treasury yields rose, the yield curve flattened and the dollar strengthened. By Thursday morning, equity futures were rebounding as oil and the 10-year yield eased.
- Crude oil remains above $100 per barrel and diesel prices remain exceptionally high. The Fed can restrain demand and second-round inflation, but it cannot reopen the Strait of Hormuz, repair Saudi infrastructure or restore refinery capacity.
- The decisive late-September tests are Middle East de-escalation or escalation, weekly energy data, September 29 JOLTS and the September 30 PCE inflation report.
What the Federal Reserve Actually Did
On September 16, the Federal Reserve raised the federal funds target range by one-quarter percentage point to 3.75%–4.00%. All 12 voting members supported the decision.
The statement described economic activity as expanding at a solid pace, with resilient domestic spending, strong productivity and robust capital investment. It also said inflation remained elevated and that the rate increase would support a faster return to the 2% objective.
That is a significant combination. The Fed is not reacting to collapsing growth or a weakening labor market. It believes the economy can absorb tighter policy while inflation remains too high.
This confirms the central argument in our pre-meeting analysis, The Fed Rate Hike, CPI, Employment and Treasury Yields: the first 25 basis points were not the real issue. The future path of rates—and the inflation forces capable of changing that path—matters far more.
The Dot Plot Delivered the Hawkish Message
The September Summary of Economic Projections showed stronger growth, lower unemployment, slightly higher inflation and a materially higher policy-rate path than the June projections.
| 2026 Median Projection | September | June | Market Meaning |
|---|---|---|---|
| Real GDP growth | 2.3% | 2.2% | Growth remains firm enough to tolerate tighter policy. |
| Unemployment rate | 4.1% | 4.3% | Less labor-market weakness than previously expected. |
| PCE inflation | 3.7% | 3.6% | Headline inflation remains well above target. |
| Core PCE inflation | 3.4% | 3.3% | Underlying inflation is also proving persistent. |
| Federal funds rate | 4.1% | 3.8% | The median path implies another hike in 2026. |
Sixteen of the 18 policymakers who submitted a year-end rate projection expected at least one further quarter-point increase. Twelve placed the year-end midpoint at 4.125%, while four projected 4.375%. Only two projected no further increase from the new range.
The result is a hawkish policy mix: the Fed expects stronger growth and lower unemployment, but it also expects higher inflation and higher interest rates. That leaves markets highly sensitive to every change in energy prices, inflation expectations and short-term Treasury yields.
How Markets Reacted
The September 16 reaction unfolded in two stages.
Stage One: The Hawkish Repricing
Stocks had been positive before the decision but turned lower as the press conference ended. The Dow fell 1.2%, the S&P 500 lost about 0.4% and the Nasdaq finished almost unchanged. The two-year Treasury yield rose to around 4.73%, while the yield curve flattened as investors increased the probability of further near-term tightening. The dollar index climbed above 100.
The market was not surprised by the 25-basis-point move. It was repricing the possibility that this was the beginning of a sequence rather than a one-off adjustment.
Stage Two: Oil Relief and a Pre-Market Rebound
By Thursday morning, U.S. equity futures had turned higher. At approximately 7:05 a.m. ET, Dow futures were up 0.72%, S&P 500 futures 0.82% and Nasdaq 100 futures 1.06%. The 10-year Treasury yield slipped and crude oil extended its decline, taking some pressure off growth stocks and other rate-sensitive assets.
Brent crude was trading near $103.70 and West Texas Intermediate near $100.70 in that snapshot. Those prices were lower on the day, but they remained high enough to keep the inflation threat alive. Futures markets assigned roughly a 58% probability to another Fed increase in October, up from about 44% before the decision.
This is the clearest reading of the price action: the market accepted the hike, but it has not resolved the inflation outlook. Equities can rebound when oil and long-term yields ease; they remain vulnerable when crude, diesel and the front end of the Treasury curve rise together.
Oil and Diesel Now Matter More Than the Fed’s Words
The Fed can raise the cost of credit, cool demand and try to prevent an energy shock from spreading into wages, services and inflation expectations. It cannot create crude oil, repair a damaged pipeline, protect a tanker or reopen a shipping lane.
That distinction matters because the current inflation shock is not confined to crude oil. U.S. diesel prices reached a record $6.31 per gallon, while European diesel futures also reached record levels. Diesel is embedded in freight, agriculture, construction, manufacturing and delivery costs. Its impact can therefore move from the energy component of CPI into the prices of goods and services.
The latest U.S. data already show several inflation channels working at the same time:
- Consumer prices: CPI rose 0.4% in August, with gasoline contributing to the increase.
- Producer costs: final-demand PPI rose 0.4%, while prices for goods increased 1.1%.
- Imported inflation: import prices rose 0.7% in August and 7.0% over 12 months; nonfuel import prices were also firm.
- Real earnings: real average hourly earnings declined 0.1% in August, showing the renewed pressure on purchasing power.
- Demand: August retail sales rose 1.2%, and the control group used in GDP calculations increased 1.4%, suggesting demand has not yet weakened enough to extinguish price pressure.
- Housing and financing: the 10-year Treasury yield near 5% has pushed mortgage rates higher, while builders also report higher material, labor, gasoline and diesel costs.
This is why oil-market price action can answer the uncertainty left by the Fed. If crude and diesel fall decisively, inflation expectations and long-term yields should begin to ease. If energy prices stay elevated or accelerate, the probability of further tightening should rise—even if the Fed says little between meetings.
Geopolitical News That Could Move Markets Next
1. Strait of Hormuz Shipping
The Strait of Hormuz carried roughly 20% of global oil exports before the war and remains severely disrupted. Any verified increase in vessel transits would be a disinflationary and potentially risk-on catalyst. New seizures, attacks, exclusion zones or shipping restrictions would be inflationary and risk-off.
2. Saudi Arabia’s East-West Pipeline
Attacks damaged two pumping stations on the pipeline that carries Saudi crude to the Red Sea. Traders estimate that a prolonged outage could affect as much as 4% of global oil supply. Reports of extra Saudi cargoes loading through Oman and expectations of a faster repair have recently pushed crude lower, but the repair timeline remains uncertain.
3. Yemen and the Bab el-Mandeb Strait
Iran-aligned Houthi forces have advanced along Yemen’s Red Sea coast and widened attacks on Saudi targets. This creates a second chokepoint risk at Bab el-Mandeb while Hormuz is already disrupted. The market impact is not limited to lost barrels: longer voyages, insurance costs and tanker availability can raise delivered energy prices even when headline crude futures temporarily decline.
4. U.S.–Gulf Diplomacy at the United Nations
President Trump is expected to meet Gulf Cooperation Council leaders on the sidelines of the United Nations General Assembly. Markets will look for evidence of a practical de-escalation plan, a shipping arrangement or progress toward reopening Hormuz. General statements of optimism will matter far less than verified changes in flows and infrastructure.
5. Russia, Sanctions and Refinery Capacity
Fresh U.S. sanctions pressure on Russia and Ukrainian attacks on Russian refinery infrastructure can tighten diesel and refined-product markets even if crude supply is adequate. Traders should therefore monitor product inventories and refining capacity, not crude oil alone.
Scheduled Market Catalysts Through the End of September
| Date | Scheduled Catalyst | Why It Matters |
|---|---|---|
| September 17 | U.S. jobless claims, housing starts and Philadelphia Fed survey; Bank of England decision | Tests labor resilience, rate-sensitive housing and global bond-market pressure. |
| September 18 | U.S. industrial production and capacity utilization; Bank of Japan decision | Measures production momentum and can move global yields, the dollar and yen-funded positions. |
| Week of September 21 | United Nations General Assembly diplomacy and expected U.S.–Gulf discussions | Potential catalyst for Iran-war, Hormuz and regional shipping expectations. |
| September 23 | EIA weekly petroleum inventories | Crude, gasoline and distillate stocks will show whether product tightness is easing or worsening. |
| September 24 | New-home sales, weekly jobless claims and U.S. international transactions | Housing is an early test of the effect of 5% Treasury yields and higher mortgage rates. |
| September 29 | August JOLTS job openings | A firm labor-demand reading would reinforce the Fed’s ability to keep tightening. |
| September 30 | August Personal Income and Outlays, PCE inflation, Q2 GDP third estimate and corporate profits | The final major September inflation test and the most important scheduled input for the October Fed meeting. |
| September 30 | EIA petroleum inventories and quarter-end portfolio flows | Energy data and institutional rebalancing can amplify volatility into the month-end close. |
The next FOMC decision is scheduled for October 28. That leaves the September 30 PCE report, the October 2 employment report and the October 14 CPI report as the major scheduled U.S. data tests before policymakers decide again.
Four Scenarios for the Weeks Ahead
| Scenario | Confirmation | Likely Market Impulse |
|---|---|---|
| Energy relief | Oil breaks below $100, diesel retreats, shipping improves and the 10-year yield falls. | Risk-on bias; support for Nasdaq and duration-sensitive assets; October hike odds decline. |
| Sticky but contained inflation | Oil remains near $100, demand data stay firm and PCE does not improve materially. | Higher-for-longer rates; choppy equities; December becomes the cleaner base case for another hike. |
| Renewed supply shock | More attacks, restricted shipping, delayed pipeline repairs and renewed gains in crude and diesel. | Risk-off; stronger dollar; pressure on transports, small caps and high-duration growth; higher front-end yields. |
| Growth shock | Labor, housing and spending weaken sharply while energy prices remain elevated. | Stagflation risk: weaker equities, a flatter curve and a more difficult Fed decision. |
What Traders Should Watch on the Screen
- WTI, Brent and diesel: crude below $100 would help, but falling refined-product prices would provide stronger evidence that inflation pressure is genuinely easing.
- Two-year versus 10-year Treasury yields: the two-year reflects the expected Fed path; the 10-year combines inflation, growth, fiscal and term-premium risks.
- U.S. dollar: continued dollar strength tightens global financial conditions and can weigh on commodities, multinational earnings and risk assets.
- Market breadth: confirmation from transports, small caps and cyclicals would make an equity rebound more credible than a narrow mega-cap technology rally.
- Gold: gold holding firm despite a stronger dollar and higher real yields would signal that geopolitical and inflation hedging remains active.
- Inflation expectations: breakevens rising with oil would indicate a broader inflation repricing; breakevens falling with crude would support the view that the shock is being contained.
Bottom Line
The Fed’s September hike was not the end of the story. It removed one uncertainty and replaced it with a more important one: whether the inflation shock fades quickly enough to avoid another increase.
The answer will come first from market price action. A durable fall in crude oil, diesel, inflation expectations and long-term yields would tell investors that supply pressure is easing and the Fed may have room to wait. Renewed gains in energy and short-term yields would tell the opposite story.
For the rest of September, the hierarchy is clear: geopolitical developments and energy flows first, inflation transmission second, scheduled data third, and Fed commentary last. The 25-basis-point hike is now history. What happens next will be decided by the evidence.
Sources and Further Reading
- Federal Reserve: September 16, 2026 FOMC Statement
- Federal Reserve: September 2026 Summary of Economic Projections
- Federal Reserve: FOMC Meeting Calendar
- Reuters: Stocks Pull Back After Fed Raises Rates
- Reuters: U.S. Stock Futures Rise as Oil Pullback Amplifies Fed Boost
- Reuters: Oil Prices Extend Losses as Supply Fears Ease
- Reuters: Hormuz Diplomacy, Houthi Attacks and Saudi Supply Risk
- Reuters: Planned U.S.–Gulf Talks on the Iran War
- U.S. Bureau of Labor Statistics: Latest CPI, PPI, Earnings and Import-Price Data
- U.S. Bureau of Labor Statistics: 2026 Release Calendar
- U.S. Bureau of Economic Analysis: Release Schedule
- U.S. Census Bureau: New Residential Sales and Next Release Date
- Alpha Trader News: September 13, 2026 Sunday Market Radar