U.S. futures rise after a hawkish Fed rate hike as traders assess broad technical pressure, softer oil, Middle East supply risks and key data.
Fundamentals: U.S. index futures moved higher as investors absorbed the Federal Reserve’s 25-basis-point rate hike and hawkish policy outlook. Lower oil prices eased near-term inflation concerns, while Middle East transport disruptions and low European gas inventories remained relevant risks. Traders also await the Philly Fed Manufacturing Index and weekly unemployment claims.
Technicals: U.S. index futures enter the NYSE pre-market session with short-term and intermediate technical pressure across ES, NQ, YM, EMD and RTY, despite generally constructive longer-term trends. Prior-session ETF movers included gains in NVDA, META and TSLA, while DIA, MSFT and USO declined. FDAX shows a short-term rebound within an intermediate corrective phase.
Pre-Market Trading 360° view Market Radar of: holidays, earnings, eco-news, market-news summary, news sentiment, prior session major ETFs, MAG7, Higher Time Frame Analysis Indices Futures Summary, and E-mini S&P500, Nasdaq 100, NYMEX Crude, Gold Futures Daily Chart analysis.
As of: September 17, 2026 07:16 CT
EcoNews Radar U.S. Events
| Day | Time | Impact | Event |
|---|---|---|---|
| Thu | 08:30 | Medium | Philly Fed Manufacturing Index |
| Thu | 08:30 | Medium | Unemployment Claims |
EcoNews Summary
No qualifying high-impact EcoNews events are listed. The listed medium-impact USD events are not directly related to oil, crude inventories, energy prices, or petroleum supply, so they are excluded.
Event Notes:
- No qualifying events listed.
Conclusion:
No qualifying high-impact EcoNews events are listed for the week. No single most important qualifying event is identified.
For full details visit: Forex Factory EcoNews
Market News Summary:
Index futures point higher as equities absorb a hawkish Federal Reserve rate hike, while easing near-term oil supply concerns offset broader energy and geopolitical pressures.
Primary Drivers & Risks:
- Primary Driver: Futures rise after Fed hike
- Primary Risk: Energy-driven inflation and further tightening
Tone:
Cautiously constructive for equities, with inflation and geopolitical cross-currents.
Stock Market / ETFs / Indices:
U.S. stock futures trended higher early Thursday despite the Fed’s 25-basis-point hike and hawkish outlook. The S&P 500 remains near record highs, while commentary highlighted historical equity resilience after rate hikes and bullish year-end index targets. Japan’s Nikkei rose 1.0%, aided by softer crude and bargain hunting; pharma and machinery led gains.
Geopolitical:
Middle East supply disruption concerns eased after reports that Saudi Arabia offered additional crude cargoes through Oman. However, the Strait of Hormuz remains closed in the LNG market context, and disrupted Red Sea and Hormuz flows remain tied to longer-term refined-fuel pressure.
Oil / Energy:
Oil extended losses in Asian and European trade as traders assessed efforts to contain disrupted Middle East exports and the prospect of restored Saudi capacity. Separate industry commentary maintained that LNG prices face winter pressure from low European gas inventories and constrained supply routes, while longer-term oil and refined-product supply risks remain elevated.
Gold / Metals:
Gold and silver rebounded after earlier weakness, supported by easing oil prices and the Bank of England holding rates unchanged. Hawkish Fed guidance and further tightening expectations capped the metals’ advance.
Fed / Financials:
The Fed’s first rate hike in more than three years lifted the dollar and pressured Asian bonds, while Treasury yields were little changed in Asian trading. Markets absorbed the hike alongside the prospect of additional tightening; global central-bank tightening was cited as a factor limiting a sustained dollar surge. Commentary also cited market pricing for a higher 2027 policy rate than the Fed’s stated target.
Macro / Other:
AI safety and regulation debates intensified among technology leaders, policymakers, and critics, adding a policy-related cross-current for major technology companies. U.S.-Japan discussions over semiconductor-factory construction formed part of broader investment talks.
Conclusion:
Higher U.S. futures and resilience near S&P 500 highs are the immediate equity backdrop. The market is digesting the Fed’s 25-basis-point hike and hawkish policy path.
Lower near-term oil prices eased one inflation channel, but Middle East transport disruptions, low European gas stocks, and structural fuel constraints remain relevant. Stronger-dollar pressure, bond-market sensitivity, and AI policy debate add cross-currents.
Market News Sentiment
Market News Articles: 57
- Neutral: 57.89%
- Negative: 24.56%
- Positive: 17.54%
Sentiment Summary: Market news tone was predominantly neutral (58%), with negative coverage (25%) exceeding positive coverage (18%).
Conclusion: Indices futures headlines reflected a neutral-to-cautious information backdrop, with more negative than positive articles.
GLD,Gold Articles: 13
- Positive: 61.54%
- Negative: 23.08%
- Neutral: 15.38%
Sentiment Summary: GLD/Gold coverage is 62% positive, 23% negative, and 15% neutral across 13 articles.
Conclusion: Gold-related sentiment is predominantly positive, with negative coverage representing less than one-quarter of articles.
USO,Oil Articles: 10
- Negative: 50.00%
- Neutral: 40.00%
- Positive: 10.00%
Sentiment Summary: USO/oil coverage is predominantly negative at 50%, with 40% neutral and 10% positive.
Conclusion: Oil-related news tone is negative overall, which may contribute to a cautious sentiment backdrop for indices futures traders.
Market Data Snapshot
ETF Snapshot of major stock market ETFs, Mag7, and others as of: September 17, 2026 07:16
Top Movers & Losers
- NVDA 213.90 Bullish 0.82% ▲
- META 673.31 Bullish 0.46% ▲
- TSLA 358.08 Bullish 0.42% ▲
- DIA 515.22 Bearish -1.15% ▼
- MSFT 490.30 Bearish -1.37% ▼
- USO 156.17 Bearish -3.52% ▼
Major Index ETFs: SPY, QQQ, DIA, IWM, IJH
- QQQ 704.72 Bullish 0.03% ▲
- IWM 283.92 Bearish -0.43% ▼
- SPY 754.05 Bearish -0.44% ▼
- IJH 72.80 Bearish -0.59% ▼
- DIA 515.22 Bearish -1.15% ▼
Major Index ETFs were Mixed: QQQ was the most bullish mover at +0.03%, a marginal gain, while DIA was the most bearish mover at -1.15%. SPY -0.44%, IWM -0.43%, and IJH -0.59% were Bearish.
Mag 7 Stocks: AAPL, MSFT, GOOG, AMZN, META, NVDA, TSLA
- NVDA 213.90 Bullish 0.82% ▲
- META 673.31 Bullish 0.46% ▲
- TSLA 358.08 Bullish 0.42% ▲
- AAPL 332.41 Bullish 0.32% ▲
- GOOG 339.36 Bearish -0.61% ▼
- AMZN 245.96 Bearish -0.99% ▼
- MSFT 490.30 Bearish -1.37% ▼
Mixed Mag7 snapshot: NVDA is the most bullish mover at +0.82%, followed by META at +0.46%, TSLA at +0.42%, and AAPL at +0.32%. MSFT is the most bearish mover at -1.37%, with AMZN at -0.99% and GOOG at -0.61%.
Cross-Market ETFs: TLT, GLD, USO, IBIT
- TLT 80.88 Bullish 0.21% ▲
- IBIT 43.04 Bearish -0.16% ▼
- GLD 391.74 Bearish -0.61% ▼
- USO 156.17 Bearish -3.52% ▼
Mixed cross-market snapshot: TLT is the most bullish mover at +0.21%. USO is the most bearish mover at -3.52%, while GLD declined -0.61% and IBIT was marginally lower at -0.16%.
ETF, Mag7, and Cross-Market ETF Insights
Overall Tone
Mixed, with broad equity ETFs Bearish while several Mag7 names are Bullish and cross-market ETFs show pronounced commodity weakness.
Equity ETFs and Mag7:
Major Index ETFs were broadly Bearish: DIA led losses at -1.15%, followed by IJH at -0.59%, SPY at -0.44%, and IWM at -0.43%, while QQQ was marginally Bullish at +0.03%. Mag7 performance was selective, led by NVDA at +0.82%, while MSFT was the most bearish mover at -1.37%; META, TSLA, and AAPL were Bullish, while GOOG and AMZN were Bearish.
Cross-Market ETFs:
Cross-market performance was Mixed: TLT was Bullish at +0.21%, while IBIT was modestly Bearish at -0.16% and GLD declined -0.61%. USO was the most bearish mover at -3.52%, showing substantially greater weakness than equities, while TLT was the most bullish mover.
Futures Indices – Higher Time Frame Analysis
Summary of the current state of US Indices Futures based on higher time-frame (HTF) technical analysis as of: 2026-09-17: 07:16 CT.
US Indices Futures
- ES: YSFG above F0%, MSFG down, WSFG marginally above F0%; above rising 200 benchmark; 7575.50 support, 7834.25–7906.25 resistance; daily pivots down.
- NQ: YSFG above F0%, MSFG down, WSFG near F0%; above rising 200 benchmark; 29053 support, 29817 reversal pivot, 30064–30110.75 resistance.
- YM: YSFG constructive, MSFG and WSFG below F0%; below short benchmarks, above rising long benchmarks; 51209 support, 53577 pivot threshold, 54884 resistance.
- EMD: YSFG above F0%, MSFG and WSFG below F0%; benchmarks align lower through 100-period; 3623.0 pivot support, 3797.4 resistance, 3941.7 high.
- RTY: YSFG above F0%, MSFG and WSFG down; below 10–100 benchmarks, above rising 200 benchmark; 2851.9–2855.1 support, 2927.1 pivot threshold.
- FDAX: YSFG above F0%, MSFG down; below declining 20-day benchmark, above rising 100/200 benchmarks; 25362 support, 25940–26153 resistance, 26847 high.
Overall State
- Short-Term: Bearish
- Intermediate-Term: Bearish
- Long-Term: Bullish
Conclusion
Daily short-term structure is predominantly down across ES, NQ, YM, EMD, and RTY, with FDAX neutral after a rebound. MSFG readings are generally below F0%, while YSFG and rising 200-period benchmarks maintain broader bullish structure in most contracts. Weekly conditions show retracements from recent pivot highs; immediate pivot supports and overhead resistance levels define the current HTF ranges.
Note: Intra-day counter-trend pullbacks or retracements may occur, HTF is context for informational usage and market structure. Glossary: Session Fib Grids periods of YSFG:’Yearly’, MSFG:’Monthly’, WSFG:’Weekly’
For full details visit: AlphaWebTrader Technicals
ES Daily View
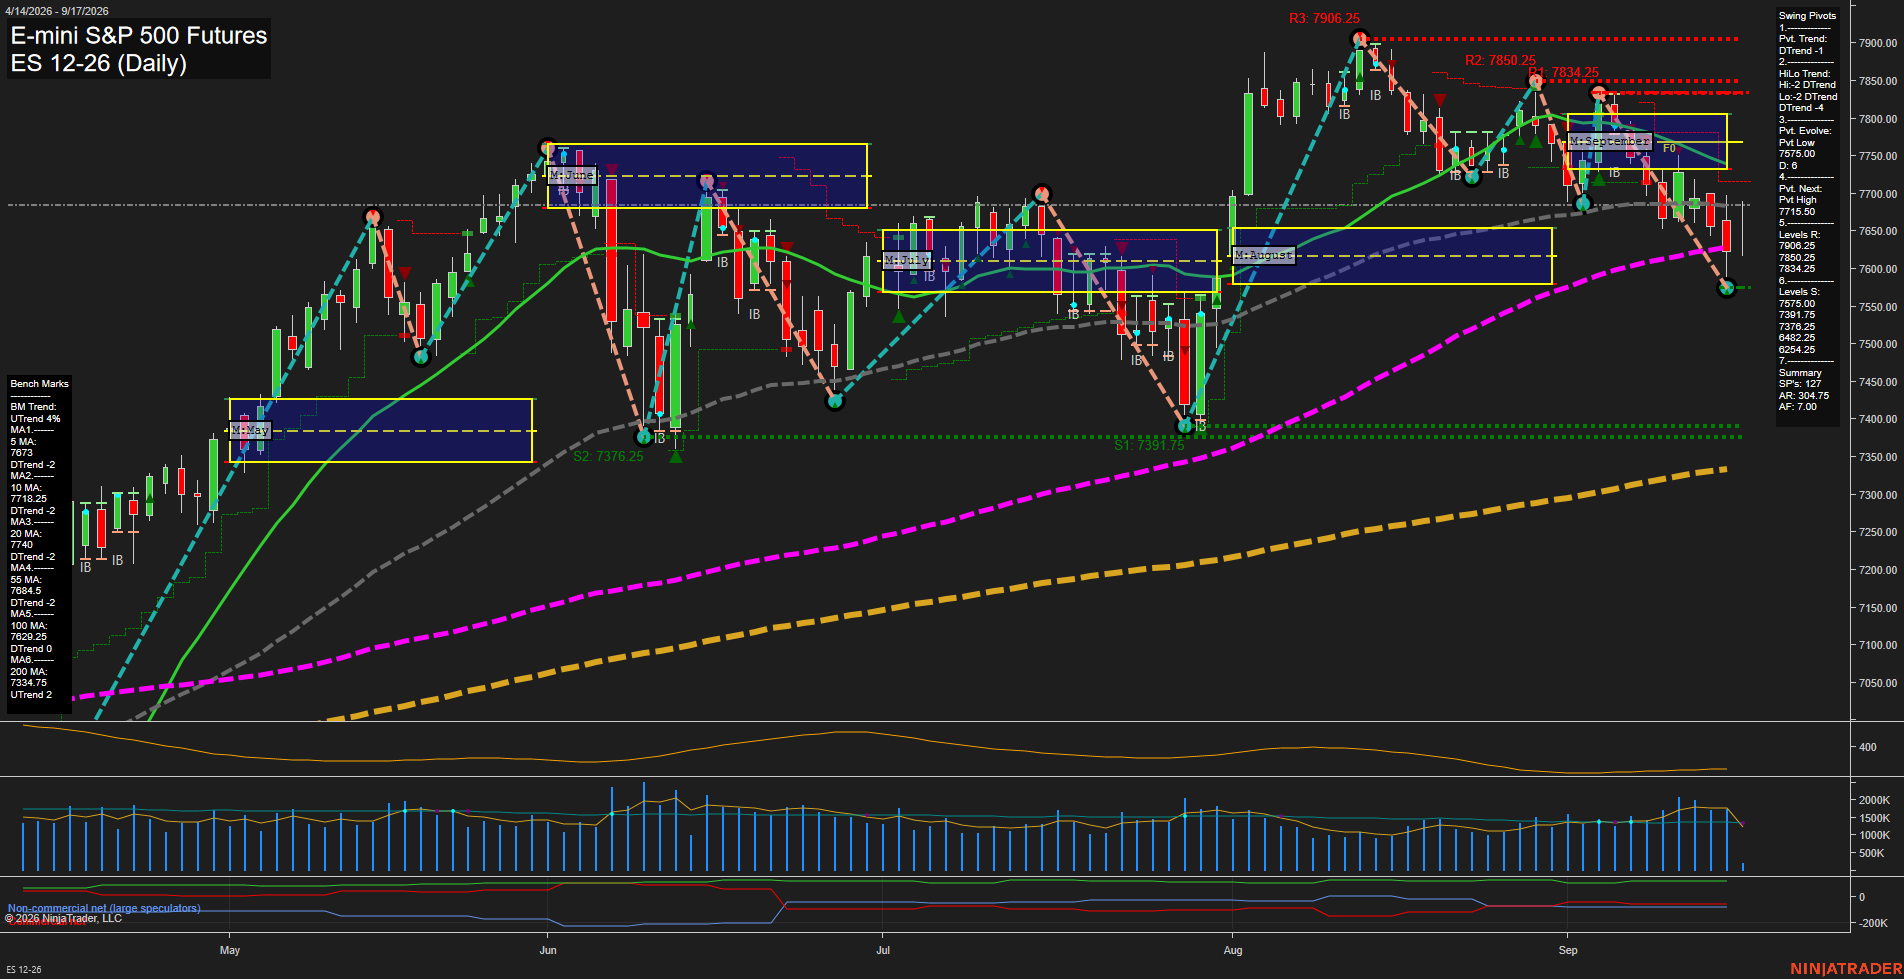
Overall Rating
- Short-Term: Bearish
- Intermediate-Term: Bearish
- Long-Term: Bullish.
Key Insights Summary
Price is consolidating near 7615.50 after a sharp September retracement from the 7906.25 swing high. The short-term pivot structure remains in a DTrend, with lower highs and a newly evolving 7575.50 pivot low. Price is below the 5, 10, 20, 55, and 100-day benchmarks, while the weekly grid remains marginally above its F0% level. Intermediate structure is weaker: the September MSFG is below F0%, the HiLo trend is down, and price remains below the declining 20- and 55-day averages. The broader annual structure remains positive because price holds well above the rising 200-day benchmark and the yearly grid remains above F0%. The 7575.50 support is the immediate downside reference, while 7834.25, 7850.25, and 7906.25 define the major overhead swing-resistance sequence.
View charts on: AlphaWebTrader HTF Charts
NQ Daily View
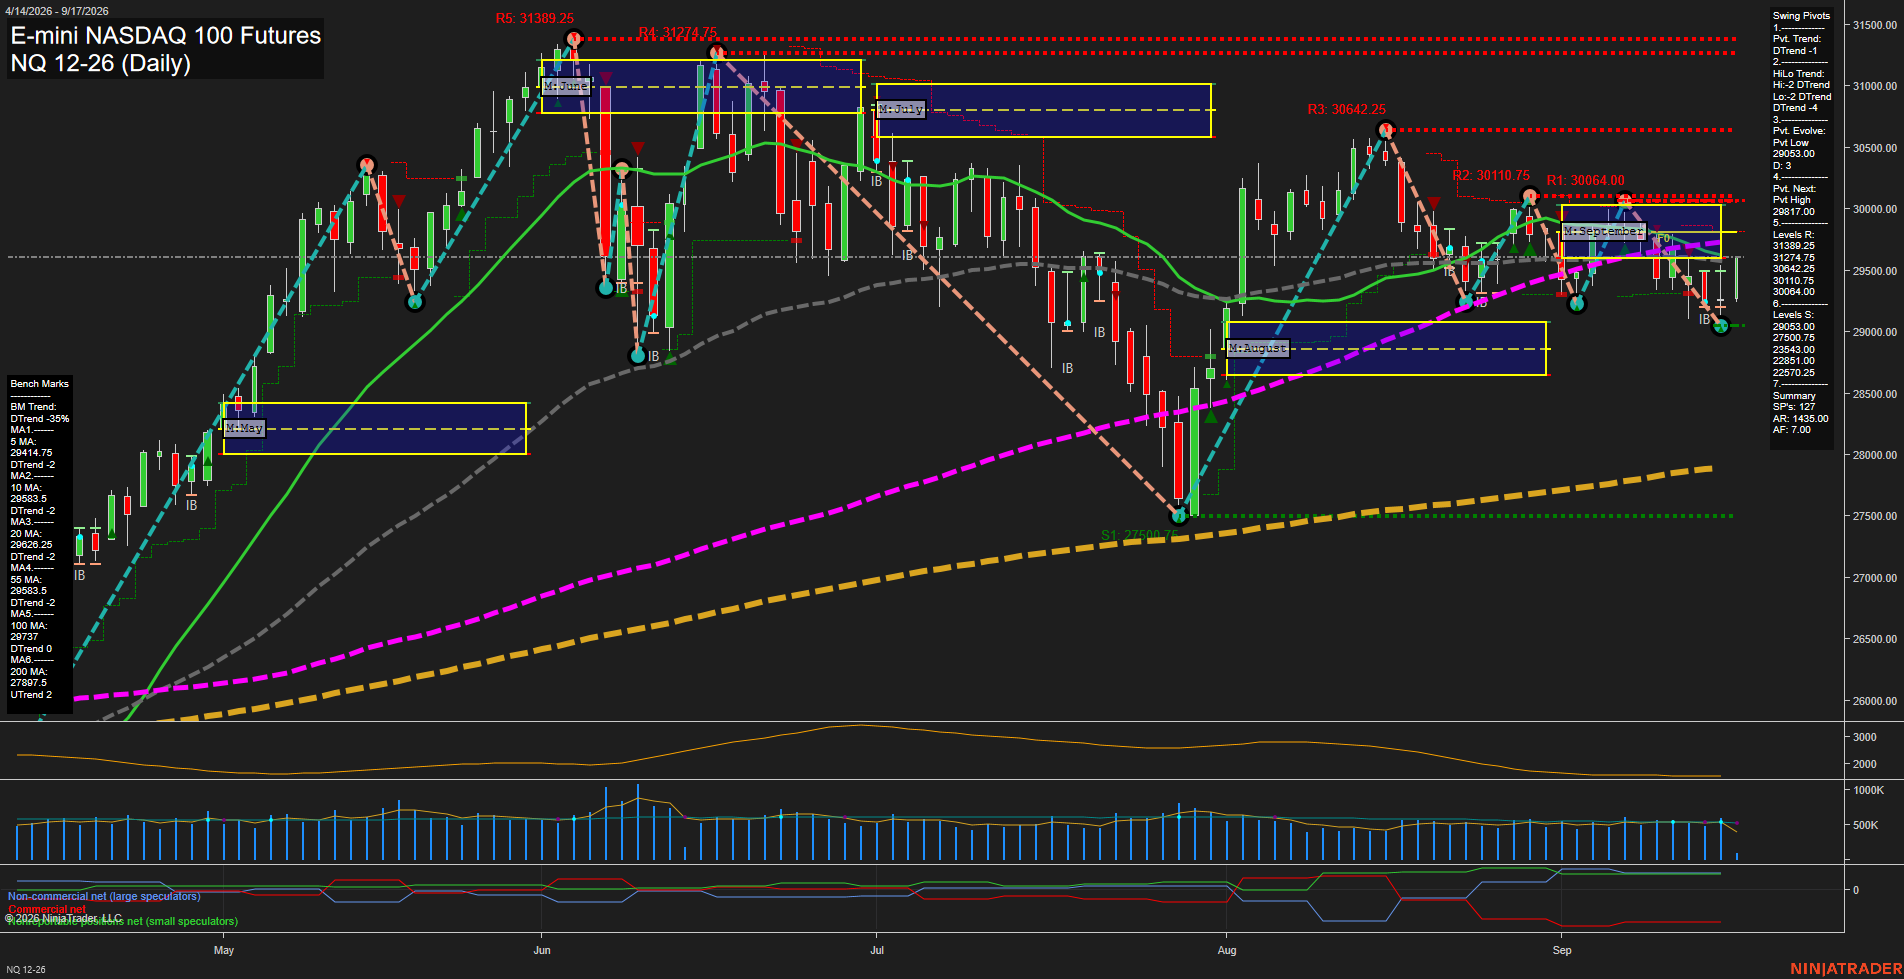
Overall Rating
- Short-Term: Bearish
- Intermediate-Term: Bearish
- Long-Term: Bullish.
Key Insights Summary
NQ is consolidating following a sharp August recovery and a September rejection below the 30064.00 to 30110.75 pivot-resistance band. The short-term pivot structure and all benchmarks through the 100-day average remain down, while price is marginally above the weekly F0% area and the 5-day benchmark. This reflects a counter-trend bounce within an intermediate-term decline. The monthly grid remains below F0%, with 29817.00 defining the next swing-pivot reversal threshold and 29053.00 to 29050.75 forming the nearby pivot-support area. The 200-day benchmark remains rising well below price, preserving the broader annual uptrend despite the current daily correction.
View charts on: AlphaWebTrader HTF Charts
CL Daily View
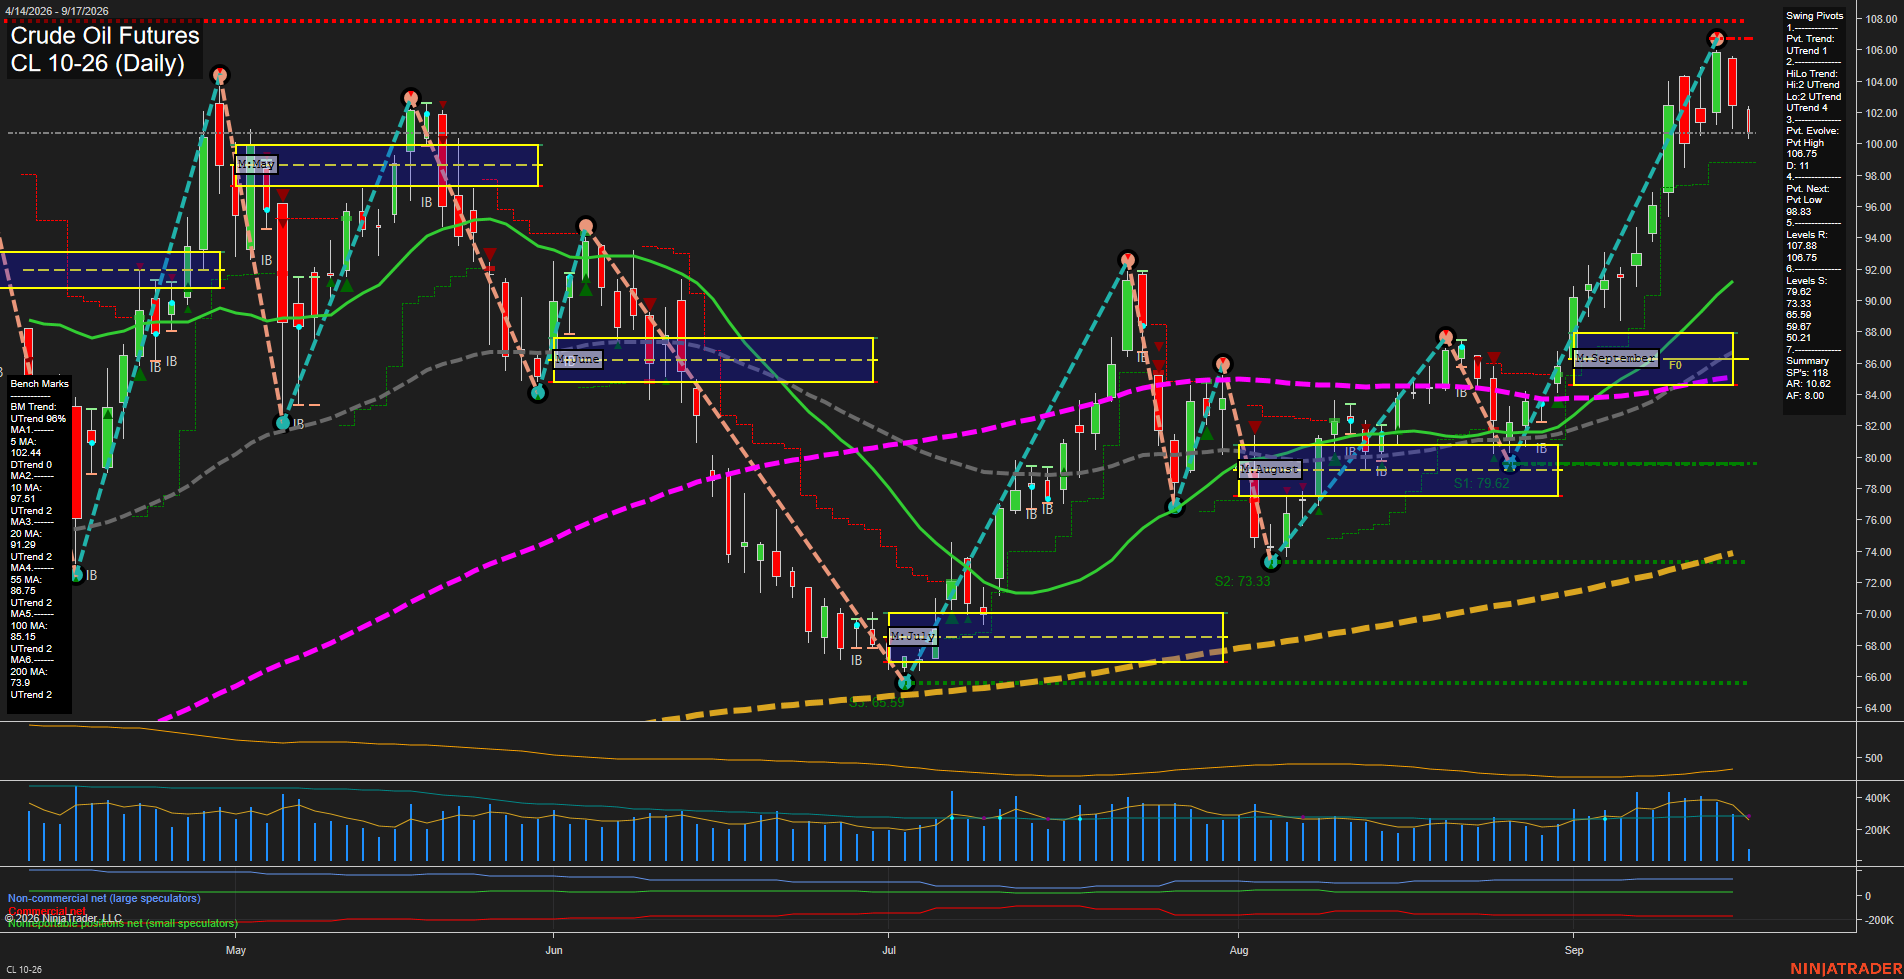
Overall Rating
- Short-Term: Neutral
- Intermediate-Term: Bullish
- Long-Term: Bullish.
Key Insights Summary
Price remains in a powerful higher-high, higher-low advance and is materially above the rising 20, 55, 100, and 200-day benchmarks. The latest large-range decline from the 106.75 pivot high has placed price beneath the falling 5-day average and below the weekly F0% grid, creating a short-term countertrend pullback within the broader bullish structure. The 95.87 pivot-next level defines the nearby reversal threshold, while 104.78 and 106.75 remain overhead swing resistance. The September monthly grid, positive intermediate pivot trend, and long-term moving-average alignment continue to characterize the larger cycle as bullish despite elevated volatility and near-term profit-taking.
View charts on: AlphaWebTrader HTF Charts
GC Daily View
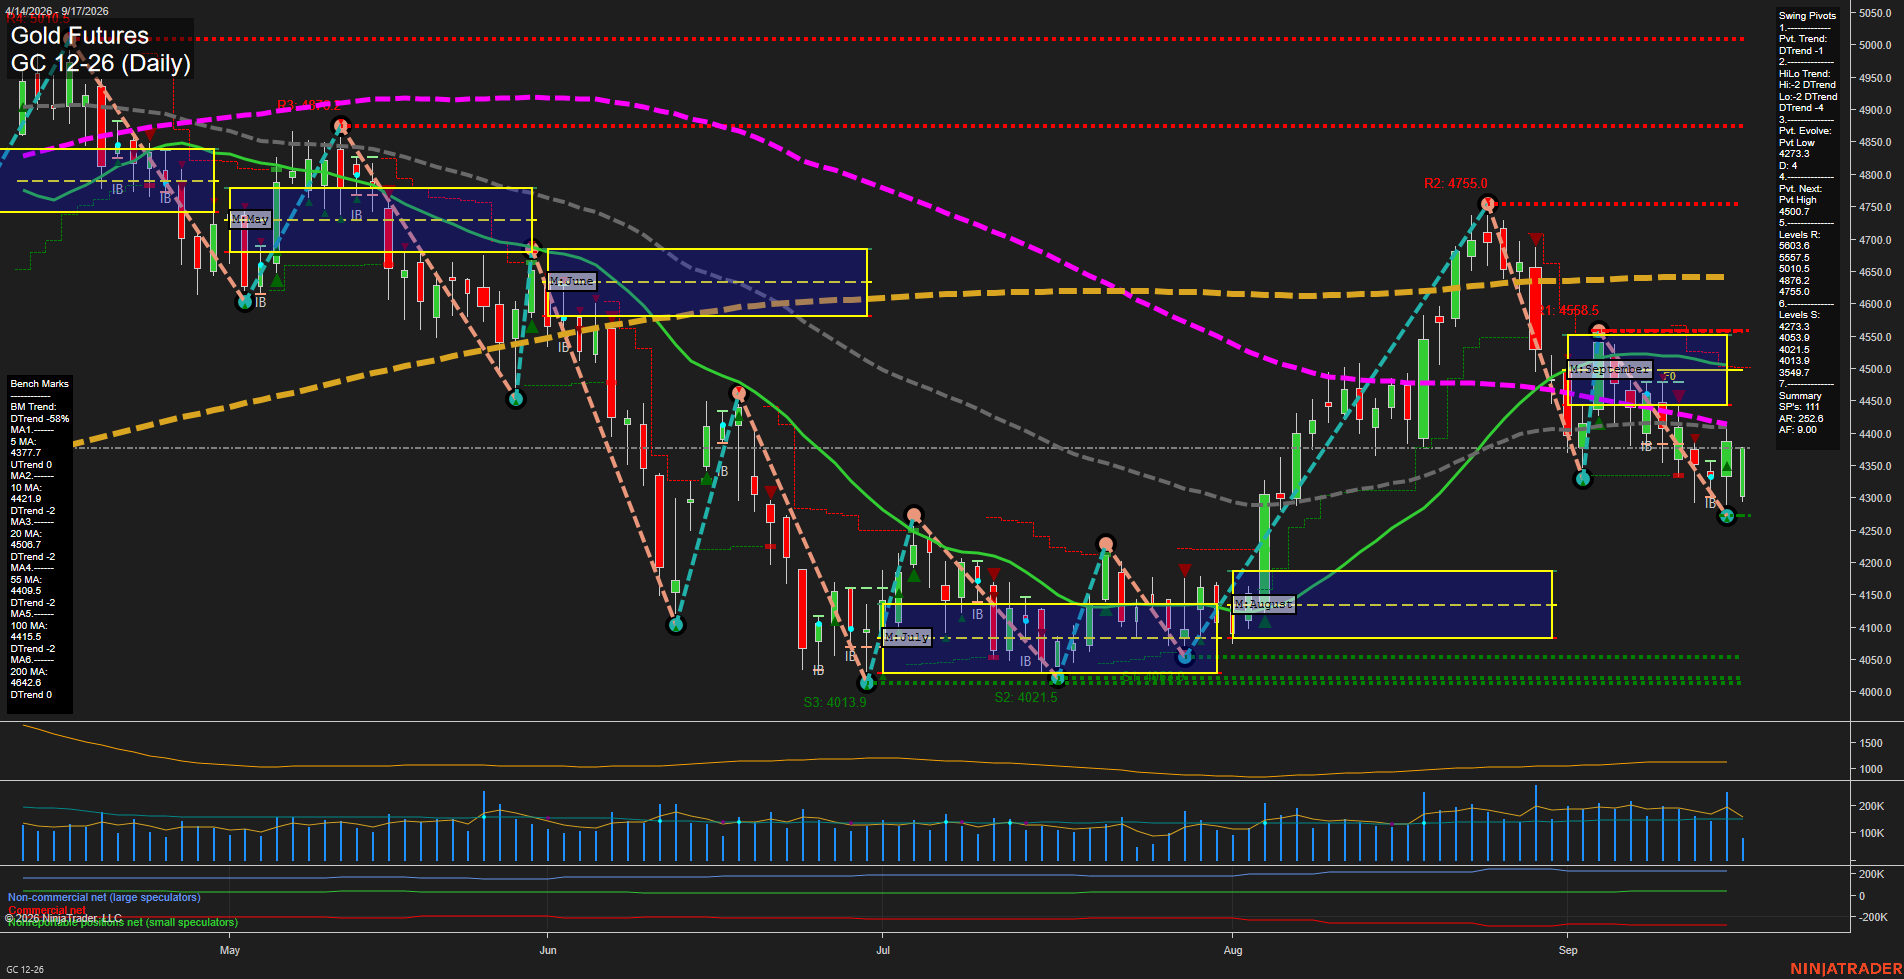
Overall Rating
- Short-Term: Bearish
- Intermediate-Term: Bearish
- Long-Term: Bearish.
Key Insights Summary
Gold is undergoing a countertrend bounce from the 4273.3 pivot low, but the daily pivot structure remains in a DTrend and price remains below the 10-, 20-, 55-, 100-, and 200-day benchmarks. The 4377.7 close is near the 5-day average, showing short-term stabilization, while 4409.5 to 4508.7 forms an overhead moving-average and monthly-grid resistance band. The September MSFG remains below F0% with a down trend, aligning with the intermediate and long-term bearish structure. A recovery through 4500.7 would define the next opposite swing-pivot reversal level; failure to sustain the rebound leaves 4273.3 as the nearest structural support.
View charts on: AlphaWebTrader HTF Charts
ZB Daily View
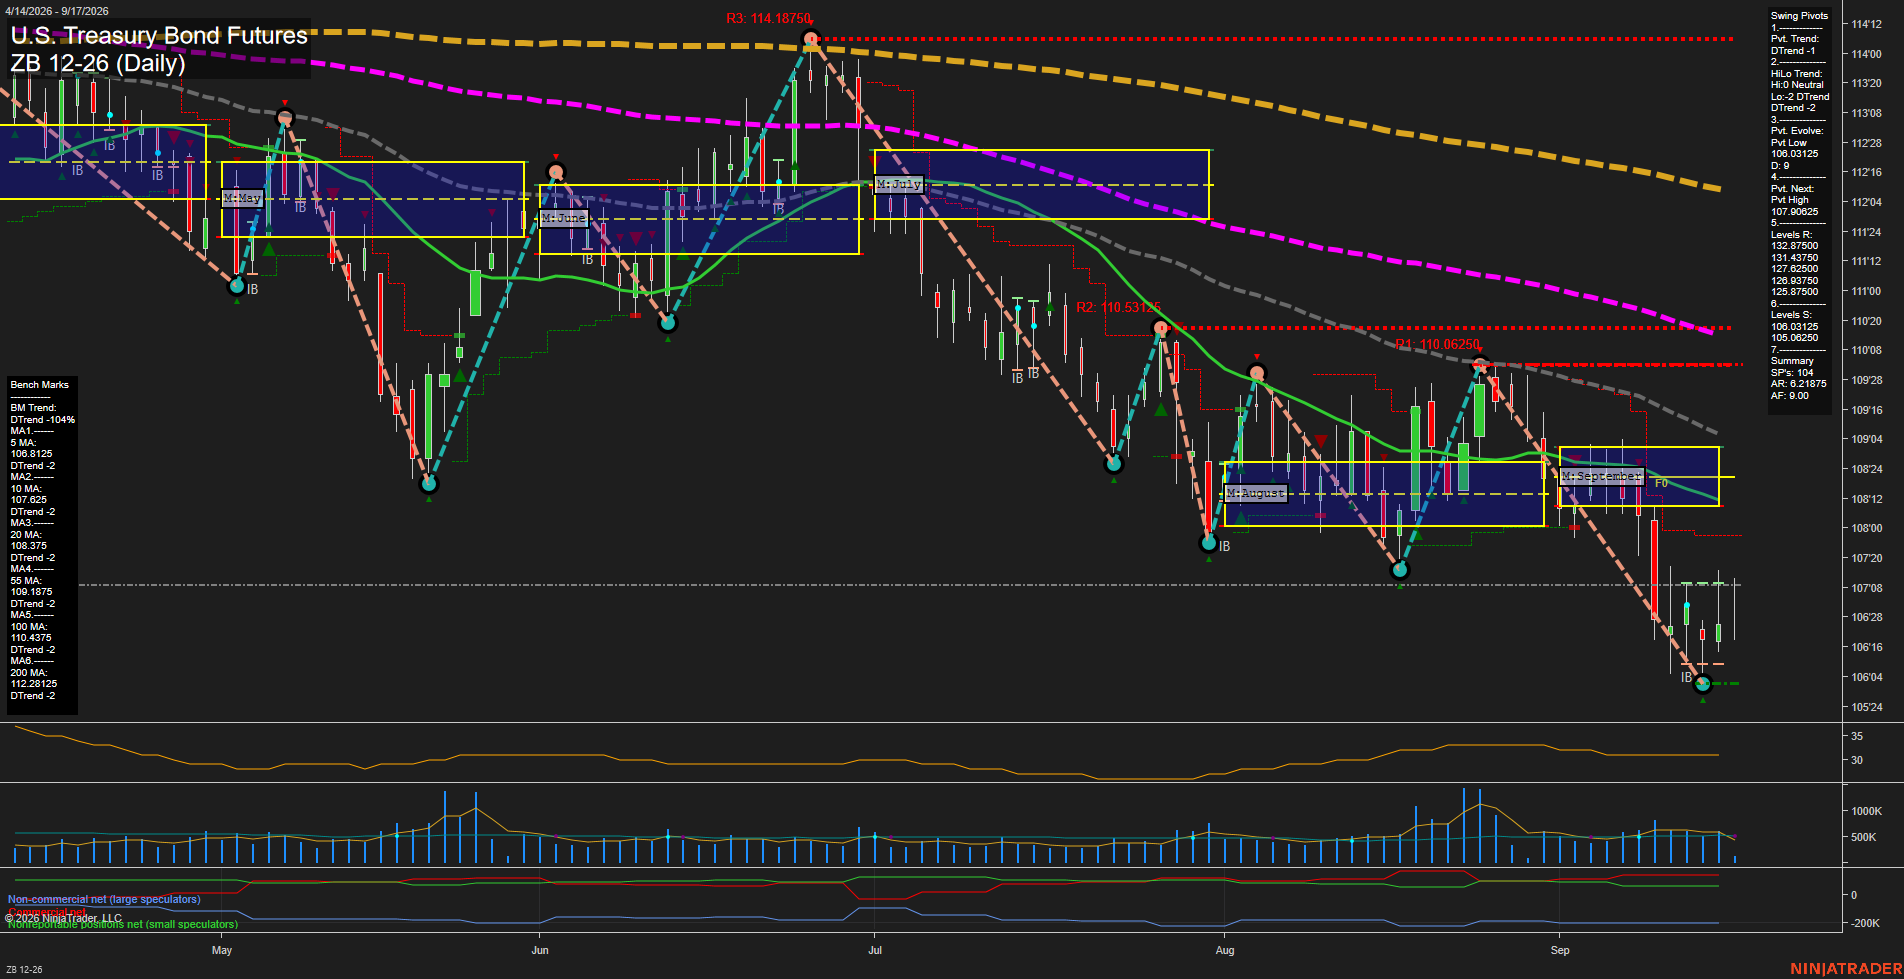
Overall Rating
- Short-Term: Bearish
- Intermediate-Term: Bearish
- Long-Term: Bearish.
Key Insights Summary
The daily structure remains broadly bearish: price is below every benchmark average, the averages are aligned in declining order, and both short-term pivot trend and intermediate HiLo trend are in DTrend. The September MSFG has been lost to the downside, leaving the 106.03125 swing-support area as the nearest structural downside reference. Recent small candles near the 106-handle indicate slowing downside momentum and a modest stabilization attempt following the sharp decline, but the current pivot sequence remains lower-high/lower-low until price can reclaim the 107.90625 pivot-reversal level. Volume is moderate relative to recent activity and ATR near 35 reflects reduced daily range expansion after the selloff.
View charts on: AlphaWebTrader HTF Charts