U.S. stocks rallied on AI and chip demand after the Fed raised rates, while Iran-linked energy costs, yields and inflation risks stayed in focus.
Fundamentals: U.S. equities recorded their biggest one-day gains in six weeks as investors bought AI and semiconductor shares following the Fed’s 25-basis-point rate increase to 3.75%-4%. Stabilizing oil prices eased some rate concerns, but elevated Treasury and mortgage yields, persistent inflation, and Iran-related fuel costs affecting freight and transport remained key market constraints.
Technicals: Major ETFs finished higher, led by Nvidia, Tesla and Amazon, while USO declined. Futures technical readings showed short-term and intermediate pressure across several equity benchmarks following September pullbacks. Longer-term structures remained bullish for many contracts, including ES, NQ, YM, RTY and FDAX, with pivot support and resistance levels framing current consolidation and corrective swings.
After Market Close daily snapshot: market news summary and sentiment, major ETFs, Magnificent 7 analysis, Indices Futures Higher Time Frame Analysis, and E-mini S&P500, Nasdaq 100, NYMEX Crude, Gold Futures Daily Chart analysis.
As of: September 17, 2026 05:00 CT
Market News Summary:
U.S. equities rallied after the Fed’s rate increase as AI and chip shares drew buying interest, while inflation, yields, and Iran-related energy costs remained key cross-currents.
Primary Drivers & Risks:
- Primary Driver: AI-led equity rebound after Fed
- Primary Risk: Iran conflict fuels energy inflation
Tone:
Near-term risk appetite improved, with significant inflation and geopolitical constraints.
Stock Market / ETFs / Indices:
The S&P 500 and Nasdaq recorded their largest one-day gains in six weeks, with investors shifting focus from inflation and rates toward AI stocks. Chip shares advanced following Intel-related comments, while a strategist reduced a prior 8,400 S&P 500 target for reasons unrelated to earnings. Bitcoin ETFs remained under pressure after a 54% drawdown, despite cumulative net inflows.
Geopolitical:
The U.S.-Israeli war involving Iran lifted concern over fuel costs and global freight rates. Investors questioned whether the established pattern of buying dips around Trump’s Iran threats remained intact, while U.S.-China AI and semiconductor competition remained in focus around a Trump-Xi state dinner.
Oil / Energy:
Oil prices stabilized and crude pulled back during the session, easing some rate-pressure concerns. Record diesel prices raised transportation-sector costs, higher jet fuel squeezed major airlines, and Iran-related fuel costs drove container-shipping rates back toward post-pandemic levels.
Gold / Metals:
Gold, silver, and platinum advanced as the U.S. dollar softened, crude declined, and Treasury yields eased. North American gold ETF buying surged sharply, though higher real yields remained a constraint; gold also drew safe-haven interest amid concern over U.S. debt.
Fed / Financials:
The Fed raised rates by about 25 basis points to 3.75%-4%, its first increase in three years, reinforcing higher-for-longer policy expectations. Mortgage rates climbed near 7%, while long-term Treasury yields remained elevated around 5% amid inflation, fiscal-deficit, and federal-debt concerns; later reports cited 10-year yields moving below 5%.
Macro / Other:
Persistent inflation and elevated energy costs remained central macro concerns. Municipal bonds traded near their cheapest relative level to Treasuries in a year as heavy issuance and weaker demand met a broader fixed-income selloff.
Conclusion:
Equity strength centered on renewed AI and semiconductor demand after the Fed hike. Stabilizing oil prices and confidence in inflation containment supported the broader stock rebound.
Higher-for-longer rates, elevated bond yields, and mortgage-rate pressure remain material constraints. Iran-related fuel costs are feeding through to freight and transport industries, sustaining inflation-related risk.
Market News Sentiment
Market News Articles: 45
- Neutral: 46.67%
- Negative: 28.89%
- Positive: 24.44%
Sentiment Summary: Of 45 market news articles, 47% were neutral, 29% negative, and 24% positive, indicating neutral coverage with a modest negative skew.
Conclusion: Indices futures news tone was primarily neutral, while negative articles modestly outnumbered positive articles.
GLD,Gold Articles: 14
- Positive: 92.86%
- Neutral: 7.14%
Sentiment Summary: Gold-related coverage is 93% positive and 7% neutral across 14 articles.
Conclusion: The snapshot indicates strongly positive sentiment toward gold, a commonly monitored risk-sensitive market input for indices futures traders.
USO,Oil Articles: 9
- Negative: 55.56%
- Neutral: 22.22%
- Positive: 22.22%
Sentiment Summary: USO/Oil coverage is predominantly negative at 56%, with neutral and positive articles each at 22%.
Conclusion: Oil-related news tone is negative overall, which may be relevant context for indices futures day traders monitoring energy-sector sentiment.
Market Data Snapshot
ETF Snapshot of major stock market ETFs, Mag7, and others as of: September 17, 2026 05:00
Top Movers & Losers
- NVDA 219.34 Bullish 2.54% ▲
- TSLA 366.20 Bullish 2.27% ▲
- AMZN 251.19 Bullish 2.13% ▲
- IJH 73.21 Bullish 0.56% ▲
- IWM 285.43 Bullish 0.53% ▲
- USO 155.31 Bearish -0.55% ▼
Major Index ETFs: SPY, QQQ, DIA, IWM, IJH
- QQQ 716.92 Bullish 1.73% ▲
- SPY 762.60 Bullish 1.13% ▲
- DIA 518.35 Bullish 0.61% ▲
- IJH 73.21 Bullish 0.56% ▲
- IWM 285.43 Bullish 0.53% ▲
Major index ETFs are Bullish, led by QQQ at +1.73%. SPY gained +1.13%, while DIA rose +0.61% and IJH added +0.56%. IWM was the least positive mover at +0.53%.
Mag 7 Stocks: AAPL, MSFT, GOOG, AMZN, META, NVDA, TSLA
- NVDA 219.34 Bullish 2.54% ▲
- TSLA 366.20 Bullish 2.27% ▲
- AMZN 251.19 Bullish 2.13% ▲
- MSFT 497.75 Bullish 1.52% ▲
- AAPL 337.00 Bullish 1.38% ▲
- META 682.31 Bullish 1.34% ▲
- GOOG 343.68 Bullish 1.27% ▲
Mag7 is Bullish across the group: NVDA is the most bullish mover at +2.54%, followed by TSLA at +2.27% and AMZN at +2.13%. MSFT gained +1.52%, while AAPL, META, and GOOG advanced +1.38%, +1.34%, and +1.27%, respectively. GOOG is the least positive mover.
Cross-Market ETFs: TLT, GLD, USO, IBIT
- GLD 398.36 Bullish 1.69% ▲
- TLT 81.78 Bullish 1.11% ▲
- IBIT 43.30 Bullish 0.60% ▲
- USO 155.31 Bearish -0.55% ▼
Other ETFs were Mixed: GLD was the most bullish mover at +1.69%, followed by TLT at +1.11% and IBIT at +0.60%. USO was the most bearish mover at -0.55%.
ETF, Mag7, and Cross-Market ETF Insights
Overall Tone
Bullish tone: equity ETFs, all Mag7 names, bonds, gold, and bitcoin exposure advanced, while oil was Bearish.
Equity ETFs and Mag7:
Major equity ETFs were broadly Bullish, led by QQQ at +1.73%, followed by SPY at +1.13%; DIA gained +0.61%, IJH +0.56%, and IWM +0.53%. Mag7 leadership was strongest in NVDA, the most bullish mover, at +2.54%, with TSLA at +2.27% and AMZN at +2.13%; GOOG was the least positive Mag7 mover at +1.27%. Equity participation was broadly Bullish, with larger technology exposure leading smaller-cap and industrial exposure.
Cross-Market ETFs:
Cross-market ETFs were Mixed: GLD led gains at +1.69%, making it the most bullish mover, while TLT rose +1.11% and IBIT added +0.60%. USO was the most bearish mover at -0.55%, diverging from Bullish equities, gold, bonds, and bitcoin exposure. The combination of GLD and TLT strength alongside equity gains reflects cross-market Bullish participation with Bearish oil.
Futures Indices – Higher Time Frame Analysis
Summary of the current state of US Indices Futures based on higher time-frame (HTF) technical analysis as of: 2026-09-17: 17:00 CT.
US Indices Futures
- ES: YSFG above F0%, MSFG down, WSFG marginally above F0%, 20–200 benchmarks rising, 7575.50 support, 7834.25–7906.25 resistance.
- NQ: YSFG above F0%, MSFG down, WSFG near F0%, 55–200 benchmarks rising, 29050.75 support, 30064.00–31389.25 resistance.
- YM: YSFG above F0%, MSFG and WSFG below F0%, short benchmarks declining, 51209 support, 53577 and 54884 pivot resistance.
- EMD: YSFG above F0%, MSFG and WSFG below F0%, 5–20 benchmarks declining, 3623.0 pivot support, 3797.4 and 3941.7 resistance.
- RTY: YSFG above F0%, MSFG and WSFG below F0%, 20–100 benchmarks lower, 2851.9–2855.1 support, 2927.1 and 3005.2 resistance.
- FDAX: YSFG above F0%, MSFG down, weekly benchmarks broadly rising, 25362 support, 25940–26153 and 26847 resistance.
Overall State
- Short-Term: Bearish
- Intermediate-Term: Bearish
- Long-Term: Bullish
Conclusion
US index futures display broad short- and intermediate-term corrective alignment, led by lower MSFG and WSFG readings in YM, EMD, and RTY. ES and FDAX retain stronger intermediate benchmark structures, while NQ holds above major long-term benchmarks despite a monthly-grid retracement. Across all contracts, YSFG context and rising 100- or 200-period benchmarks maintain longer-term upward structure. Current swing pivots define nearby support, while recent highs and benchmark clusters define overhead resistance.
Note: Intra-day counter-trend pullbacks or retracements may occur, HTF is context for informational usage and market structure. Glossary: Session Fib Grids periods of YSFG:’Yearly’, MSFG:’Monthly’, WSFG:’Weekly’
For full details visit: AlphaWebTrader Technicals
ES Daily View
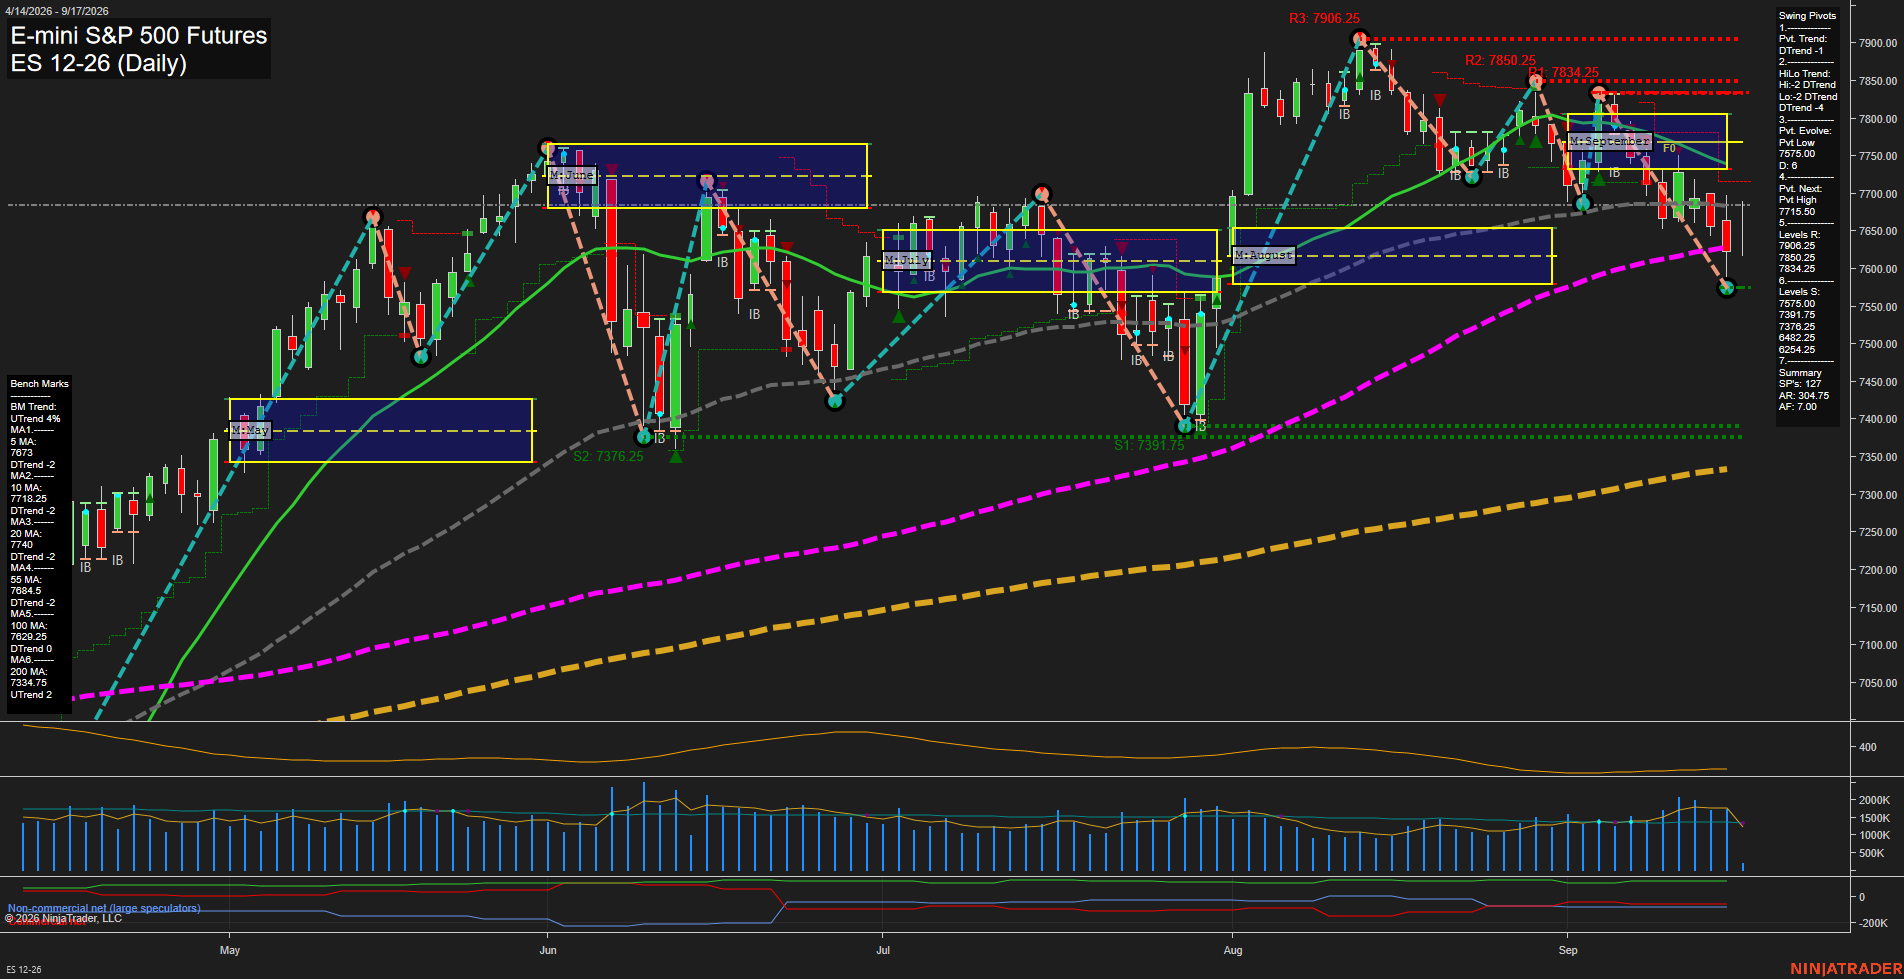
Overall Rating
- Short-Term: Bearish
- Intermediate-Term: Bearish
- Long-Term: Bullish.
Key Insights Summary
Price is consolidating near 7615.50 after a sharp September retracement from the 7906.25 swing high. The short-term pivot structure remains in a DTrend, with lower highs and a newly evolving 7575.50 pivot low. Price is below the 5, 10, 20, 55, and 100-day benchmarks, while the weekly grid remains marginally above its F0% level. Intermediate structure is weaker: the September MSFG is below F0%, the HiLo trend is down, and price remains below the declining 20- and 55-day averages. The broader annual structure remains positive because price holds well above the rising 200-day benchmark and the yearly grid remains above F0%. The 7575.50 support is the immediate downside reference, while 7834.25, 7850.25, and 7906.25 define the major overhead swing-resistance sequence.
View charts on: AlphaWebTrader HTF Charts
NQ Daily View
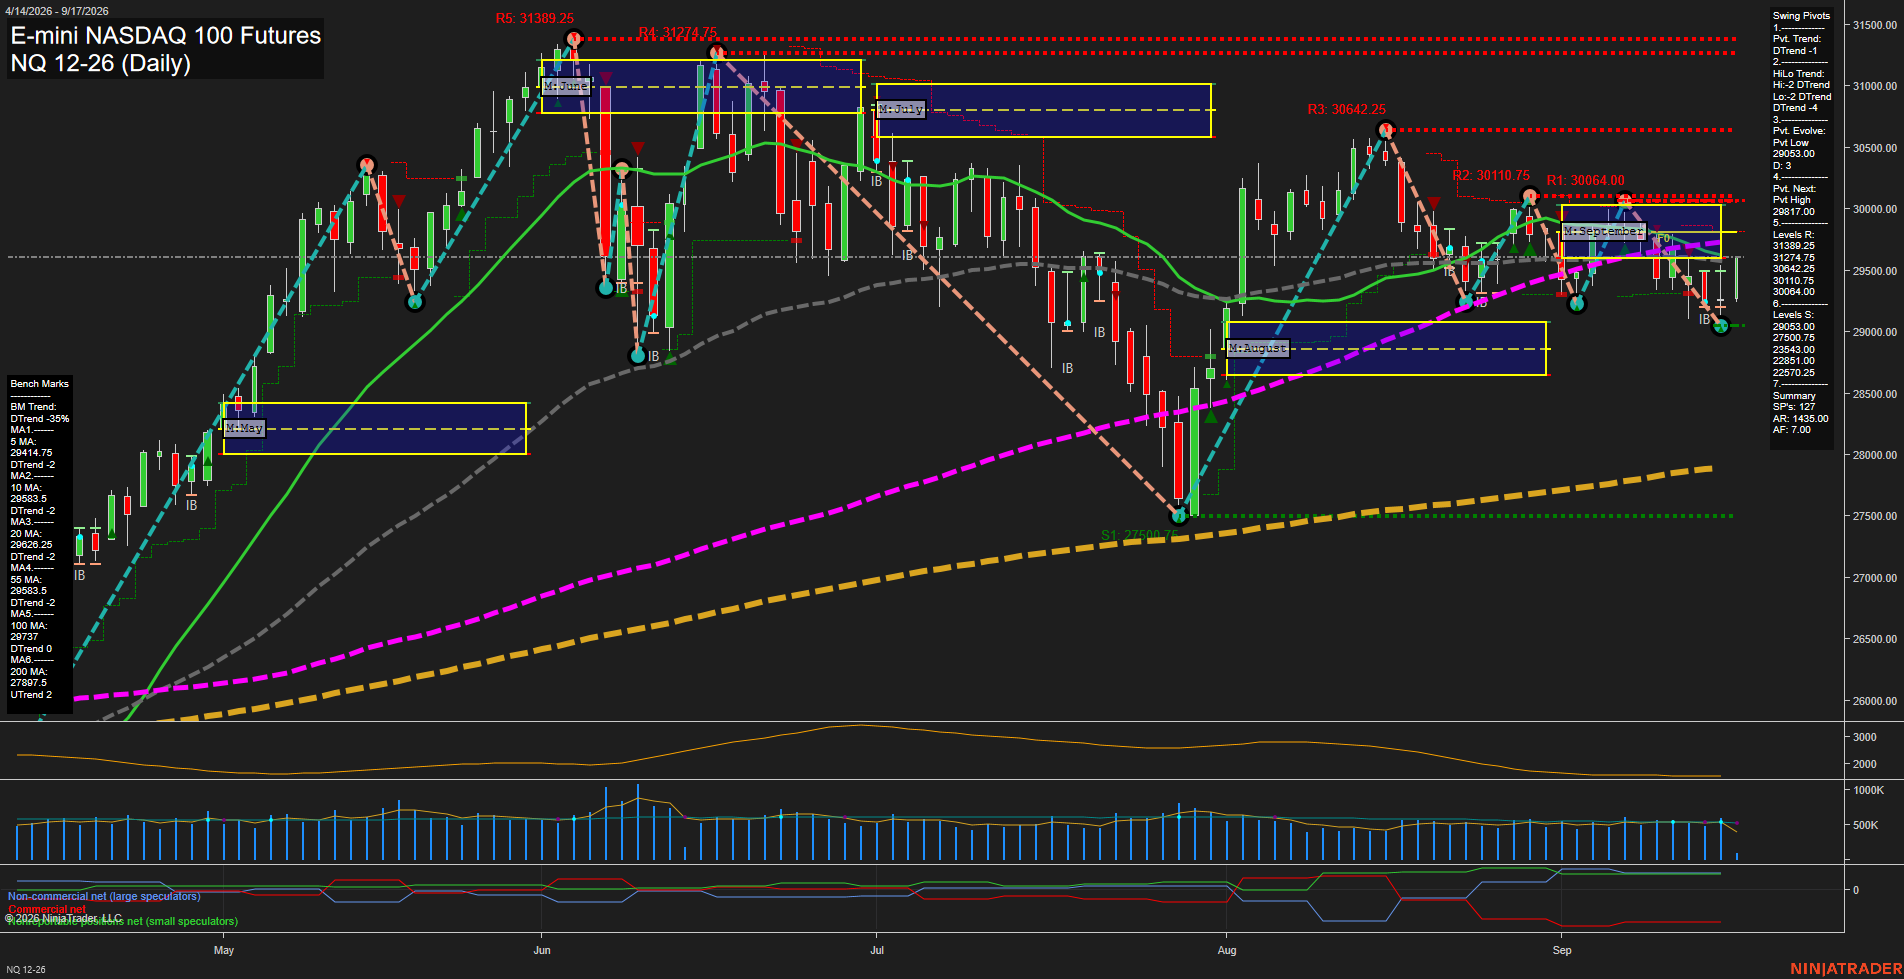
Overall Rating
- Short-Term: Bearish
- Intermediate-Term: Bearish
- Long-Term: Bullish.
Key Insights Summary
NQ is consolidating following a sharp August recovery and a September rejection below the 30064.00 to 30110.75 pivot-resistance band. The short-term pivot structure and all benchmarks through the 100-day average remain down, while price is marginally above the weekly F0% area and the 5-day benchmark. This reflects a counter-trend bounce within an intermediate-term decline. The monthly grid remains below F0%, with 29817.00 defining the next swing-pivot reversal threshold and 29053.00 to 29050.75 forming the nearby pivot-support area. The 200-day benchmark remains rising well below price, preserving the broader annual uptrend despite the current daily correction.
View charts on: AlphaWebTrader HTF Charts
CL Daily View
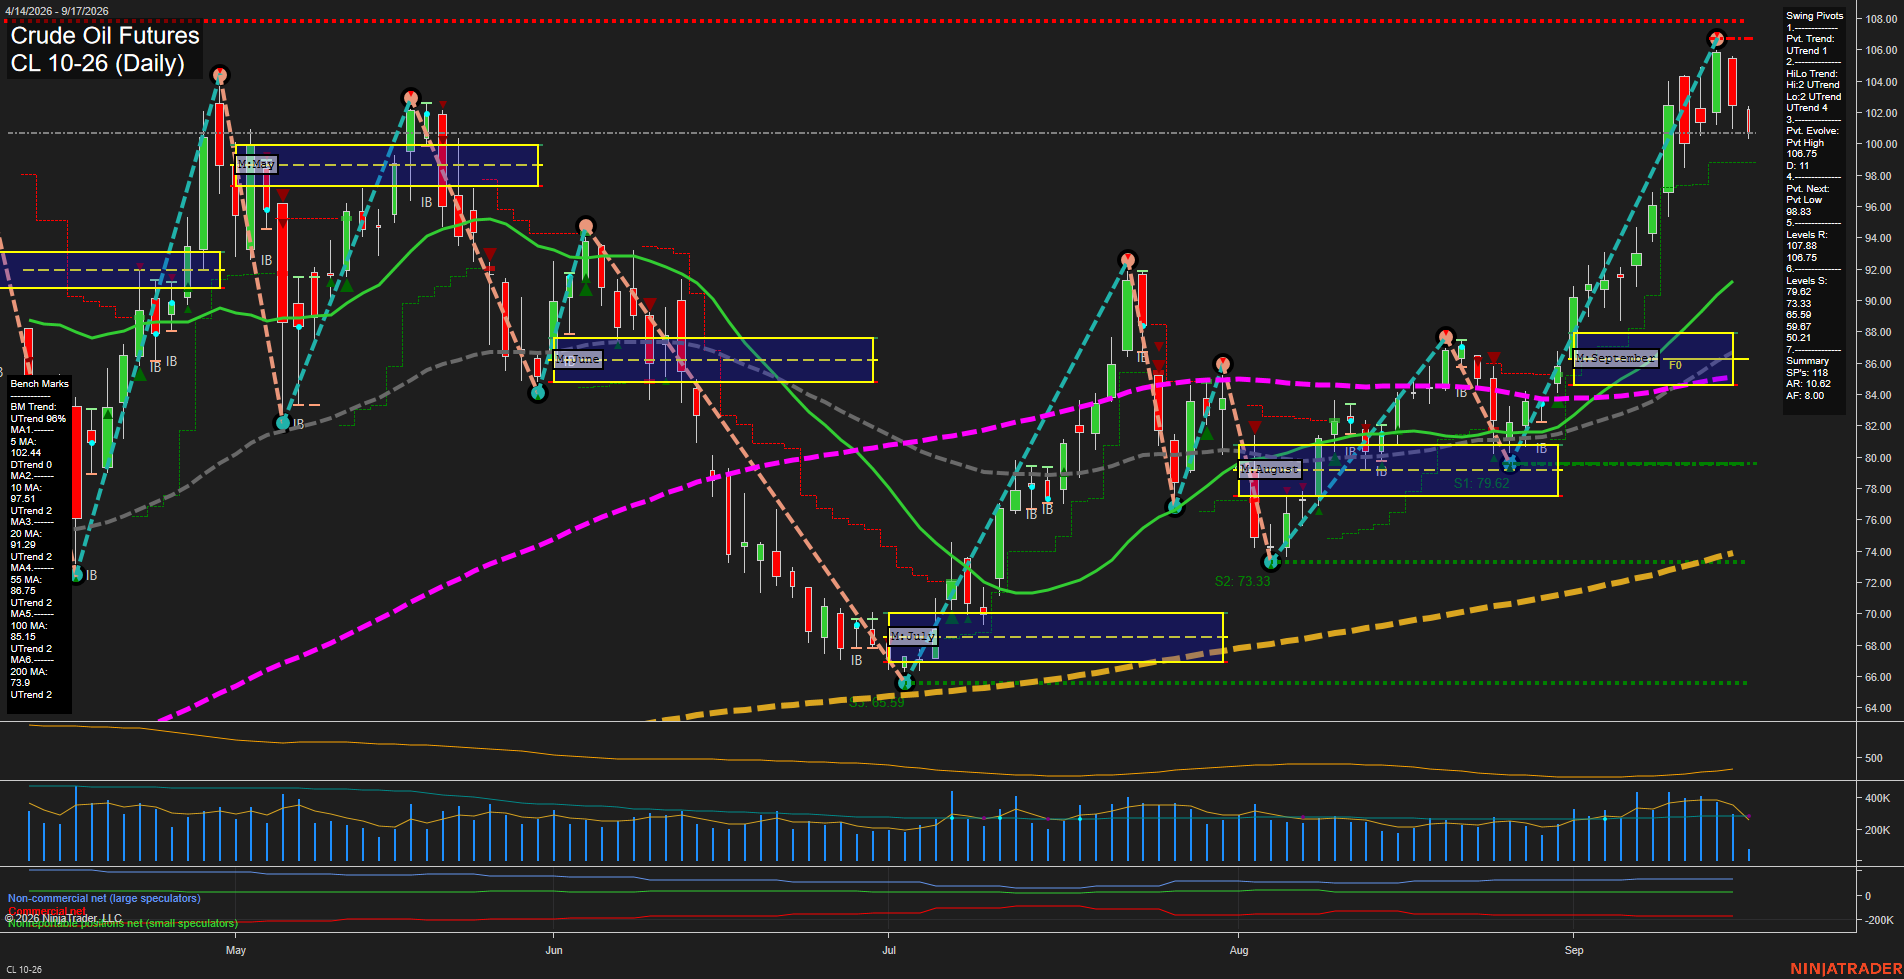
Overall Rating
- Short-Term: Neutral
- Intermediate-Term: Bullish
- Long-Term: Bullish.
Key Insights Summary
Price remains in a powerful higher-high, higher-low advance and is materially above the rising 20, 55, 100, and 200-day benchmarks. The latest large-range decline from the 106.75 pivot high has placed price beneath the falling 5-day average and below the weekly F0% grid, creating a short-term countertrend pullback within the broader bullish structure. The 95.87 pivot-next level defines the nearby reversal threshold, while 104.78 and 106.75 remain overhead swing resistance. The September monthly grid, positive intermediate pivot trend, and long-term moving-average alignment continue to characterize the larger cycle as bullish despite elevated volatility and near-term profit-taking.
View charts on: AlphaWebTrader HTF Charts
GC Daily View
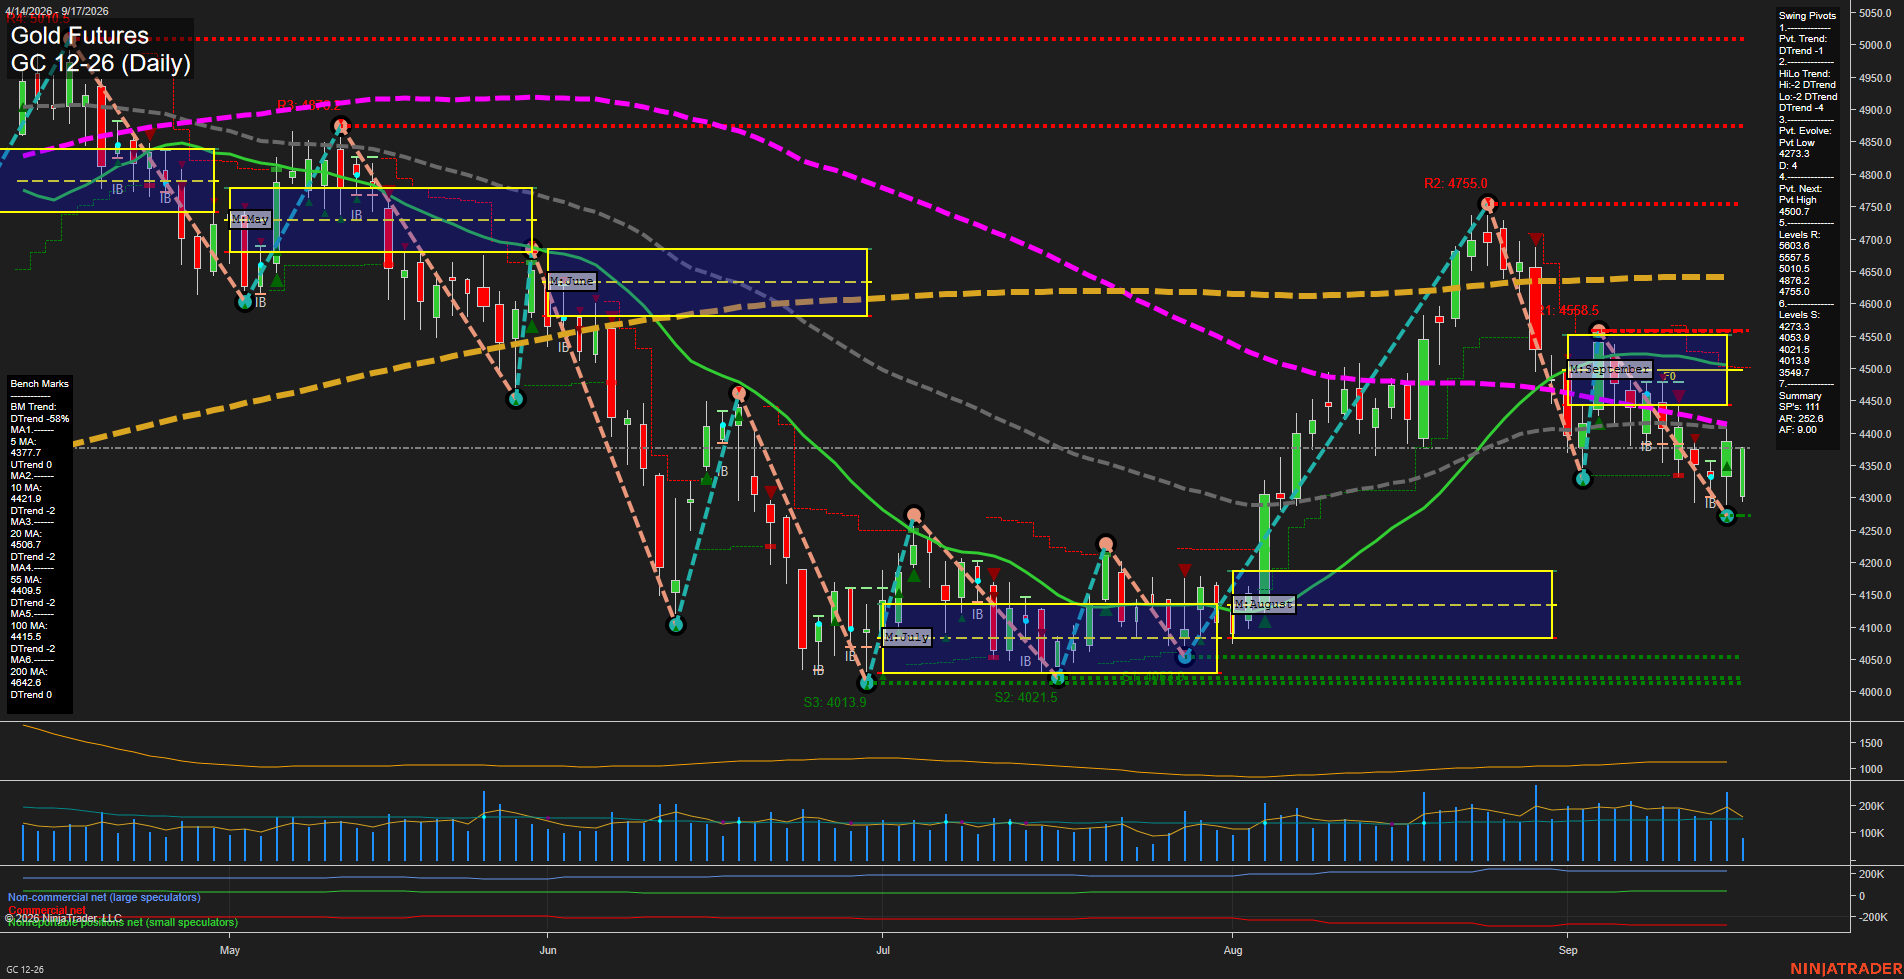
Overall Rating
- Short-Term: Bearish
- Intermediate-Term: Bearish
- Long-Term: Bearish.
Key Insights Summary
Gold is undergoing a countertrend bounce from the 4273.3 pivot low, but the daily pivot structure remains in a DTrend and price remains below the 10-, 20-, 55-, 100-, and 200-day benchmarks. The 4377.7 close is near the 5-day average, showing short-term stabilization, while 4409.5 to 4508.7 forms an overhead moving-average and monthly-grid resistance band. The September MSFG remains below F0% with a down trend, aligning with the intermediate and long-term bearish structure. A recovery through 4500.7 would define the next opposite swing-pivot reversal level; failure to sustain the rebound leaves 4273.3 as the nearest structural support.
View charts on: AlphaWebTrader HTF Charts
ZB Daily View
Overall Rating
- Short-Term: Bearish
- Intermediate-Term: Bearish
- Long-Term: Bearish.
Key Insights Summary
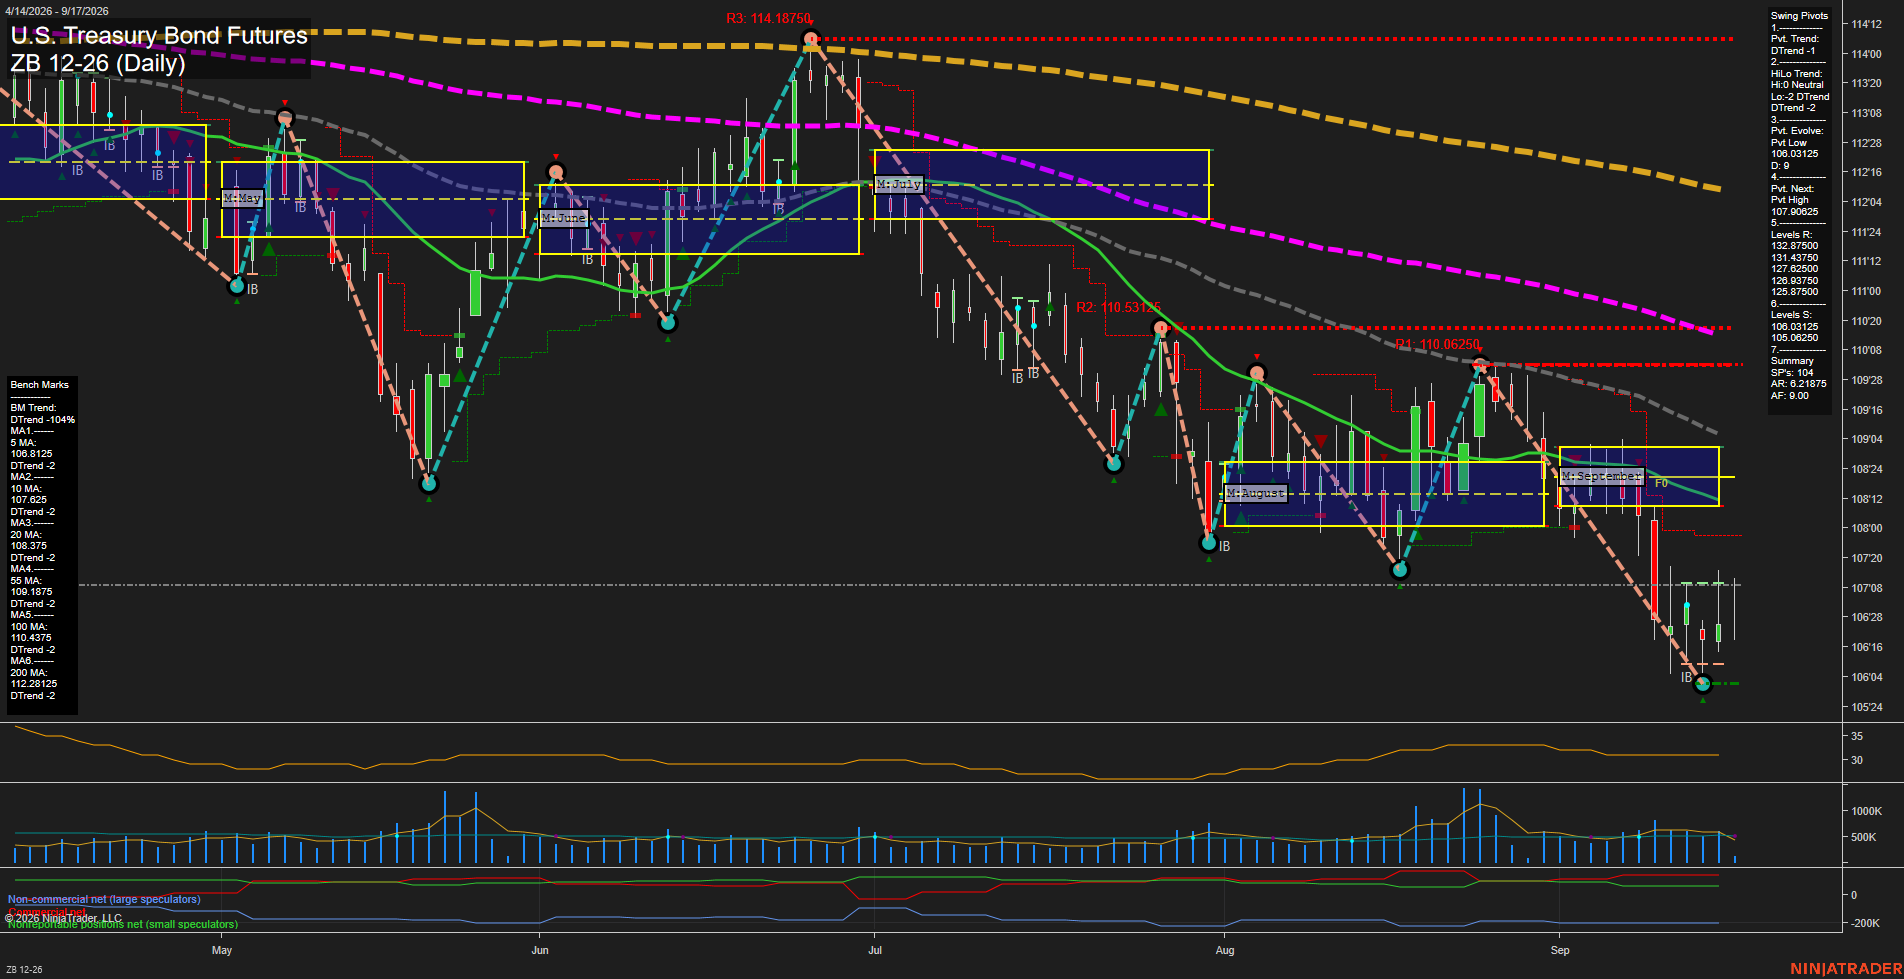
The daily structure remains broadly bearish: price is below every benchmark average, the averages are aligned in declining order, and both short-term pivot trend and intermediate HiLo trend are in DTrend. The September MSFG has been lost to the downside, leaving the 106.03125 swing-support area as the nearest structural downside reference. Recent small candles near the 106-handle indicate slowing downside momentum and a modest stabilization attempt following the sharp decline, but the current pivot sequence remains lower-high/lower-low until price can reclaim the 107.90625 pivot-reversal level. Volume is moderate relative to recent activity and ATR near 35 reflects reduced daily range expansion after the selloff.
View charts on: AlphaWebTrader HTF Charts