S&P 500 futures test resistance as Nasdaq trends stay constructive, while breadth, oil, rates, Fed policy and Trump-Xi talks shape market focus.
Fundamentals: Index futures enter the week with the S&P 500 holding near key resistance after recovering from the prior week’s decline. Attention centers on the September 24 Trump-Xi summit, the Fed’s policy backdrop and levels at 7710, 7816 and 8010. Weak market breadth, high-yield bond softness, higher oil prices, elevated valuations and AI financing strains remain notable cross-currents.
Technicals: Futures analysis shows constructive longer-term trends for the S&P 500 and Nasdaq, though the S&P remains in a mixed intermediate-term position below key resistance. Dow, small-cap, EMD and DAX contracts reflect sharper short-term pullbacks, while the Nasdaq retains broadly bullish alignment. ETF movers included gains in IBIT, Nvidia and Amazon, with declines in Meta, Microsoft and USO.
Market Week Ahead – Trading 360° view Market Radar for: holidays, earnings, eco-news, market-news summary, news sentiment, and major ETFs, MAG7, Higher Time Frame Analysis Indices Futures Summary, and ETF SPY S&P500, QQQ Tech, USO Oil, GLD Gold Weekly Chart analysis
As of: September 20, 2026 06:15 CT
Market News Summary:
Index futures enter the week with technical support in the S&P 500 offset by valuation, liquidity, rate, and U.S.-China policy concerns.
Primary Drivers & Risks:
- Primary Driver: Trump-Xi summit focus
- Primary Risk: Weakening liquidity and elevated valuations
Tone:
Mixed, with fragile risk sentiment beneath resilient index levels.
Stock Market / ETFs / Indices:
The S&P 500 recovered from the prior week’s decline and held near flat, with technical analysis identifying 7710 as channel resistance, 7816 as the all-time high, and 8010 as a higher technical level. Separately, declining market breadth, weakness in high-yield bonds, and deterioration in NYSE advance-decline measures point to liquidity strain beneath headline index performance. Long-term VOO investing commentary highlights the historical benefits of consistent S&P 500 exposure.
Geopolitical:
Treasury Secretary Scott Bessent met Chinese Vice Premier He Lifeng before the September 24 Trump-Xi summit in Washington. Discussions center on trade, tariffs, Taiwan, AI competition, rare-earth exports, and Boeing orders; the status of the rare-earth export-ban truce remains a key tension point.
Oil / Energy:
Higher oil prices were cited as a headwind for the S&P 500 alongside elevated valuations and rising interest rates.
Fed / Financials:
The Fed’s September 25-basis-point rate hike followed prior cumulative cuts of 75 basis points, placing the October meeting against a backdrop of equity and Treasury-yield volatility. The rate decision was framed around restoring progress toward the 2% inflation target.
Macro / Other:
AI infrastructure financing faces increased capital-intensity and credit concerns. Oracle’s higher capital spending, sharply negative free cash flow, discounted Project Jupiter loans, and wider CDS spreads illustrate the shift from internal funding toward debt-financed AI investment.
Conclusion:
Near-term attention centers on the Trump-Xi summit, the Fed policy backdrop, and S&P 500 technical levels. The index remains near key resistance following a rebound from last week’s decline.
Underlying breadth and high-yield weakness contrast with resilient headline indices. Elevated valuations, higher oil prices, rising rates, and AI-sector credit stress remain cross-currents.
Market News Sentiment
Market News Articles: 8
- Neutral: 62.50%
- Positive: 25.00%
- Negative: 12.50%
Sentiment Summary: Market news sentiment is predominantly neutral at 63%, with 25% positive and 13% negative coverage across eight articles.
Conclusion: The news flow presents a largely balanced tone for indices futures day traders, with positive coverage exceeding negative coverage.
No stock-related news items found.
Sentiment Summary: No stock-related news items were identified, leaving market sentiment unsupported by the provided data.
Conclusion: No news-based sentiment signal is available for indices futures day traders.
No stock-related news items found.
Sentiment Summary: No stock-related news items were identified, leaving market sentiment indicators unavailable for indices futures day traders.
Conclusion: The snapshot provides no news-based directional signal for index futures.
SPY Weekly View
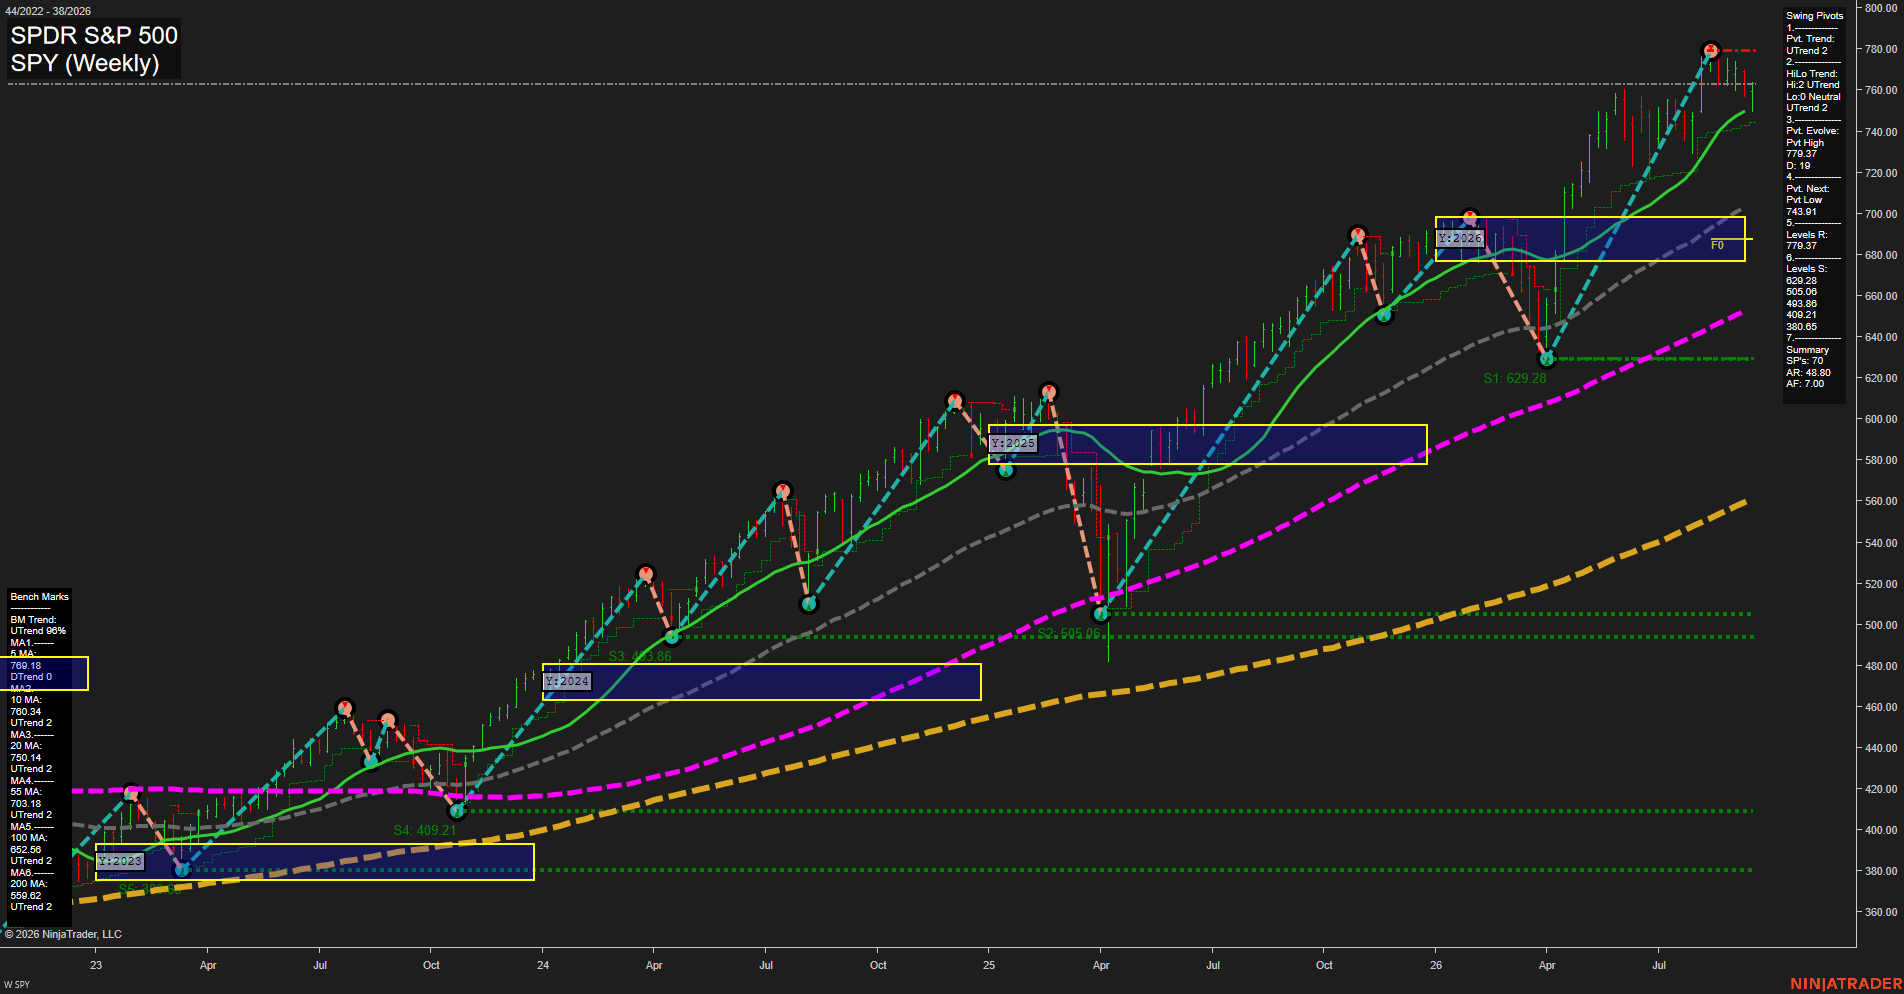
Overall Rating
- Short-Term: Neutral
- Intermediate-Term: Bullish
- Long-Term: Bullish.
Key Insights Summary
SPY’s weekly structure remains broadly constructive from a futures swing-trader perspective: price is holding above the rising 10-, 20-, 55-, 100-, and 200-period benchmark averages, while the intermediate HiLo pivot trend remains in an uptrend. The short-term pivot condition has shifted to DTrend following the 779.37 pivot high, characterizing the current action as a pullback within the larger advance. The 743.91 pivot-next level defines the nearby structural reversal reference, while 779.37 remains the principal overhead swing resistance. Price remains well above the 2026 yearly NTZ and F0% area near the upper-680s to 700 zone, preserving the longer-term bullish price-cycle backdrop despite near-term consolidation.
View charts on: AlphaWebTrader HTF Charts
QQQ Weekly View
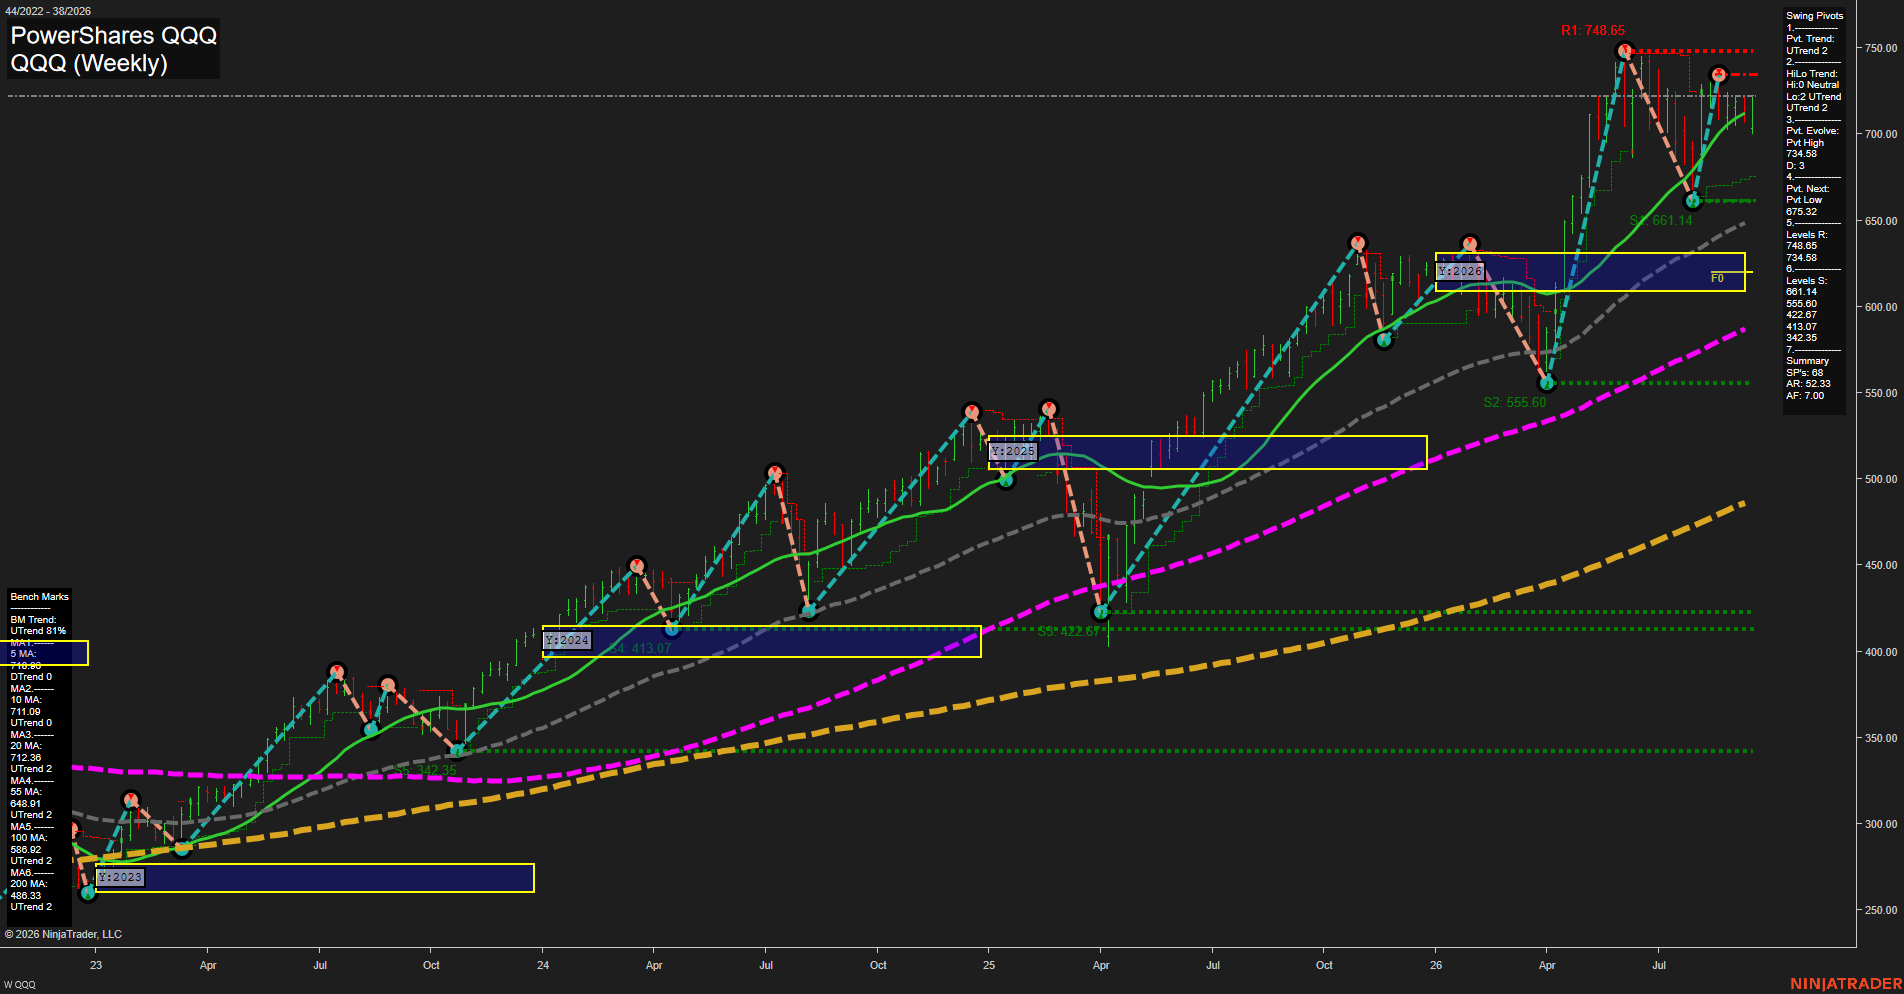
Overall Rating
- Short-Term: Bullish
- Intermediate-Term: Bullish
- Long-Term: Bullish.
Key Insights Summary
QQQ remains in a broad weekly higher-high and higher-low structure, a condition that aligns with a constructive Nasdaq futures swing backdrop. Price is holding above the rising 5-, 10-, 20-, 55-, 100-, and 200-period benchmarks, with the wide separation above the 55-period average confirming a strong intermediate and long-term advance. The recent recovery from the 661.14 pivot low produced a V-shaped continuation back toward 734.58 resistance; the current small weekly bars reflect consolidation beneath that prior swing high rather than a decisive trend failure. A weekly resolution above 734.58 would restore focus toward 775.33, while 675.32 and 661.14 define the nearer swing-structure support zone. The yearly Fib grid is below current price, reinforcing that the dominant 2026 auction remains above its annual neutral zone despite elevated price extension.
View charts on: AlphaWebTrader HTF Charts
USO Weekly View
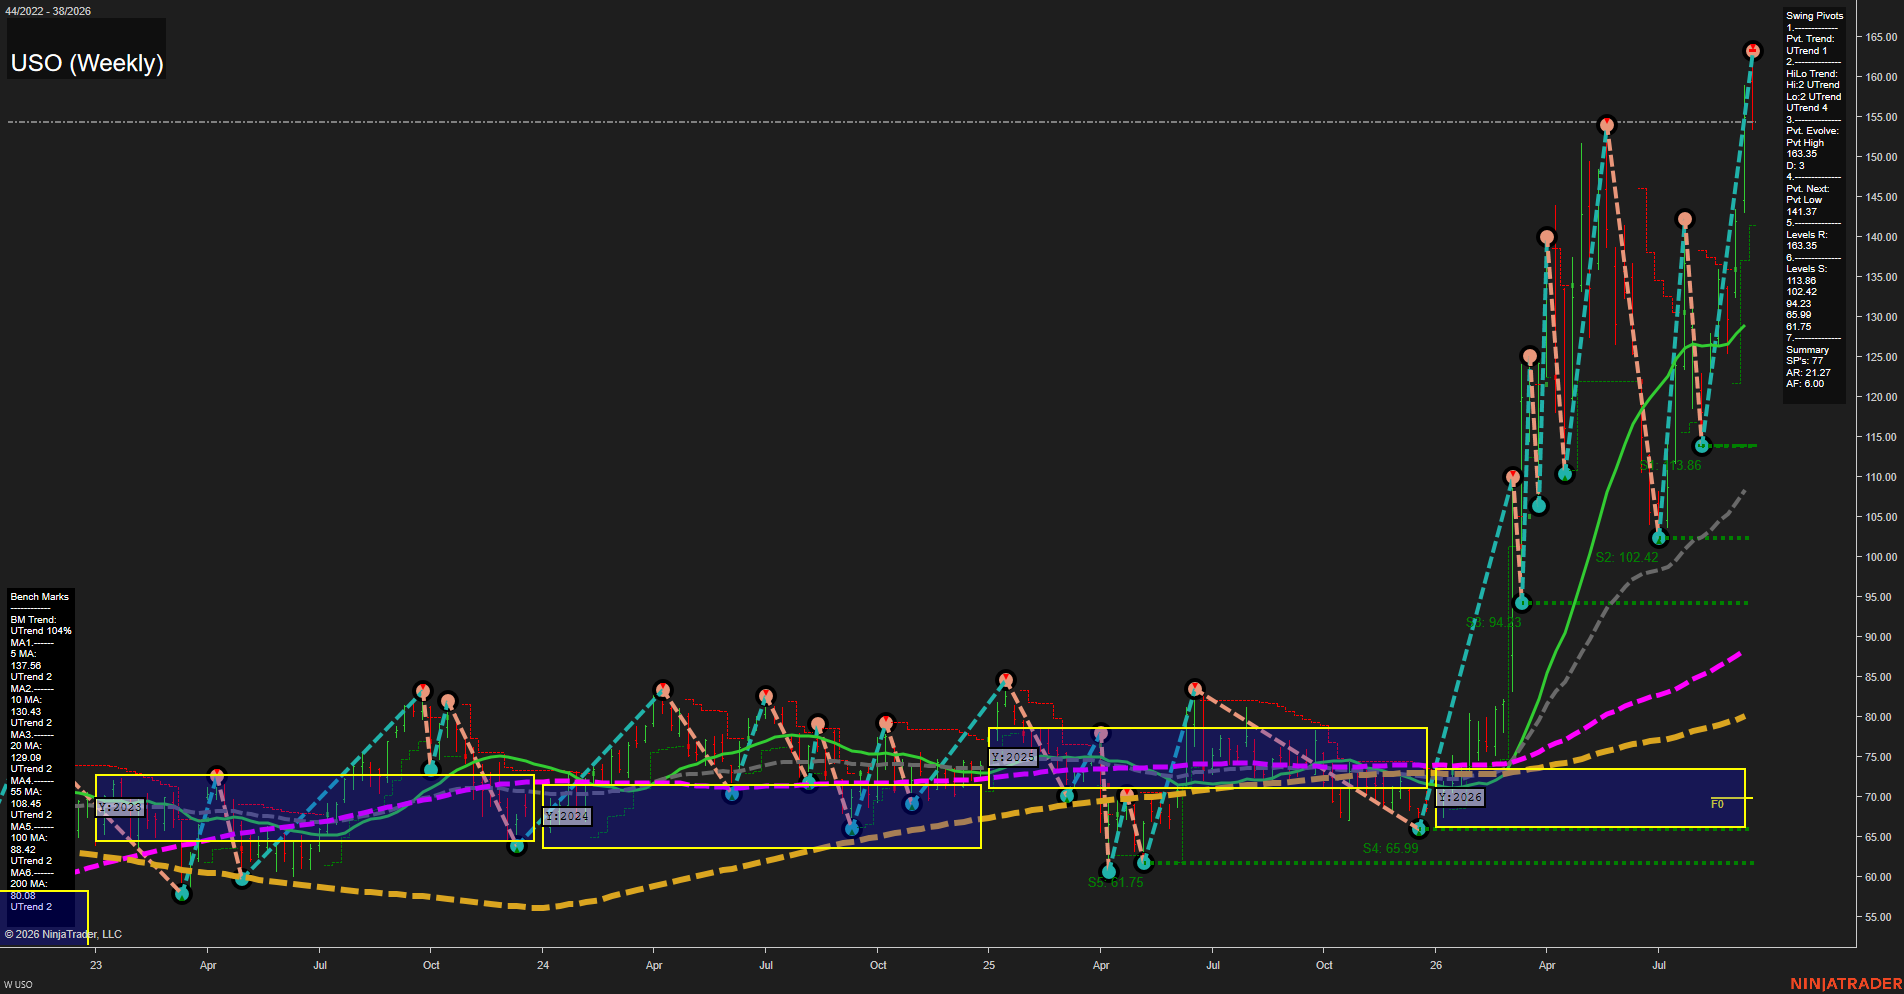
Overall Rating
- Short-Term: Bullish
- Intermediate-Term: Bullish
- Long-Term: Bullish.
Key Insights Summary
USO is in a powerful, high-volatility upside expansion from the 2025-26 base near the yearly F0/NTZ area. Weekly swing structure is decisively bullish: both pivot-trend measures are in UTrend, price has printed a new evolving pivot high at 163.35, and all benchmark averages are rising in bullish alignment. The move is highly extended above the 5-, 10-, and 20-week benchmarks, reflecting fast momentum rather than a balanced consolidation. From a futures swing-trader perspective, 163.35 is the active breakout reference, while 141.37 is the nearest pivot-reversal threshold; 138.86 is the first established structural support beneath that level. The broader pattern remains a sequence of higher highs and higher lows, although the large weekly ranges indicate an increasingly vertical and volatile phase.
View charts on: AlphaWebTrader HTF Charts
GLD Weekly View
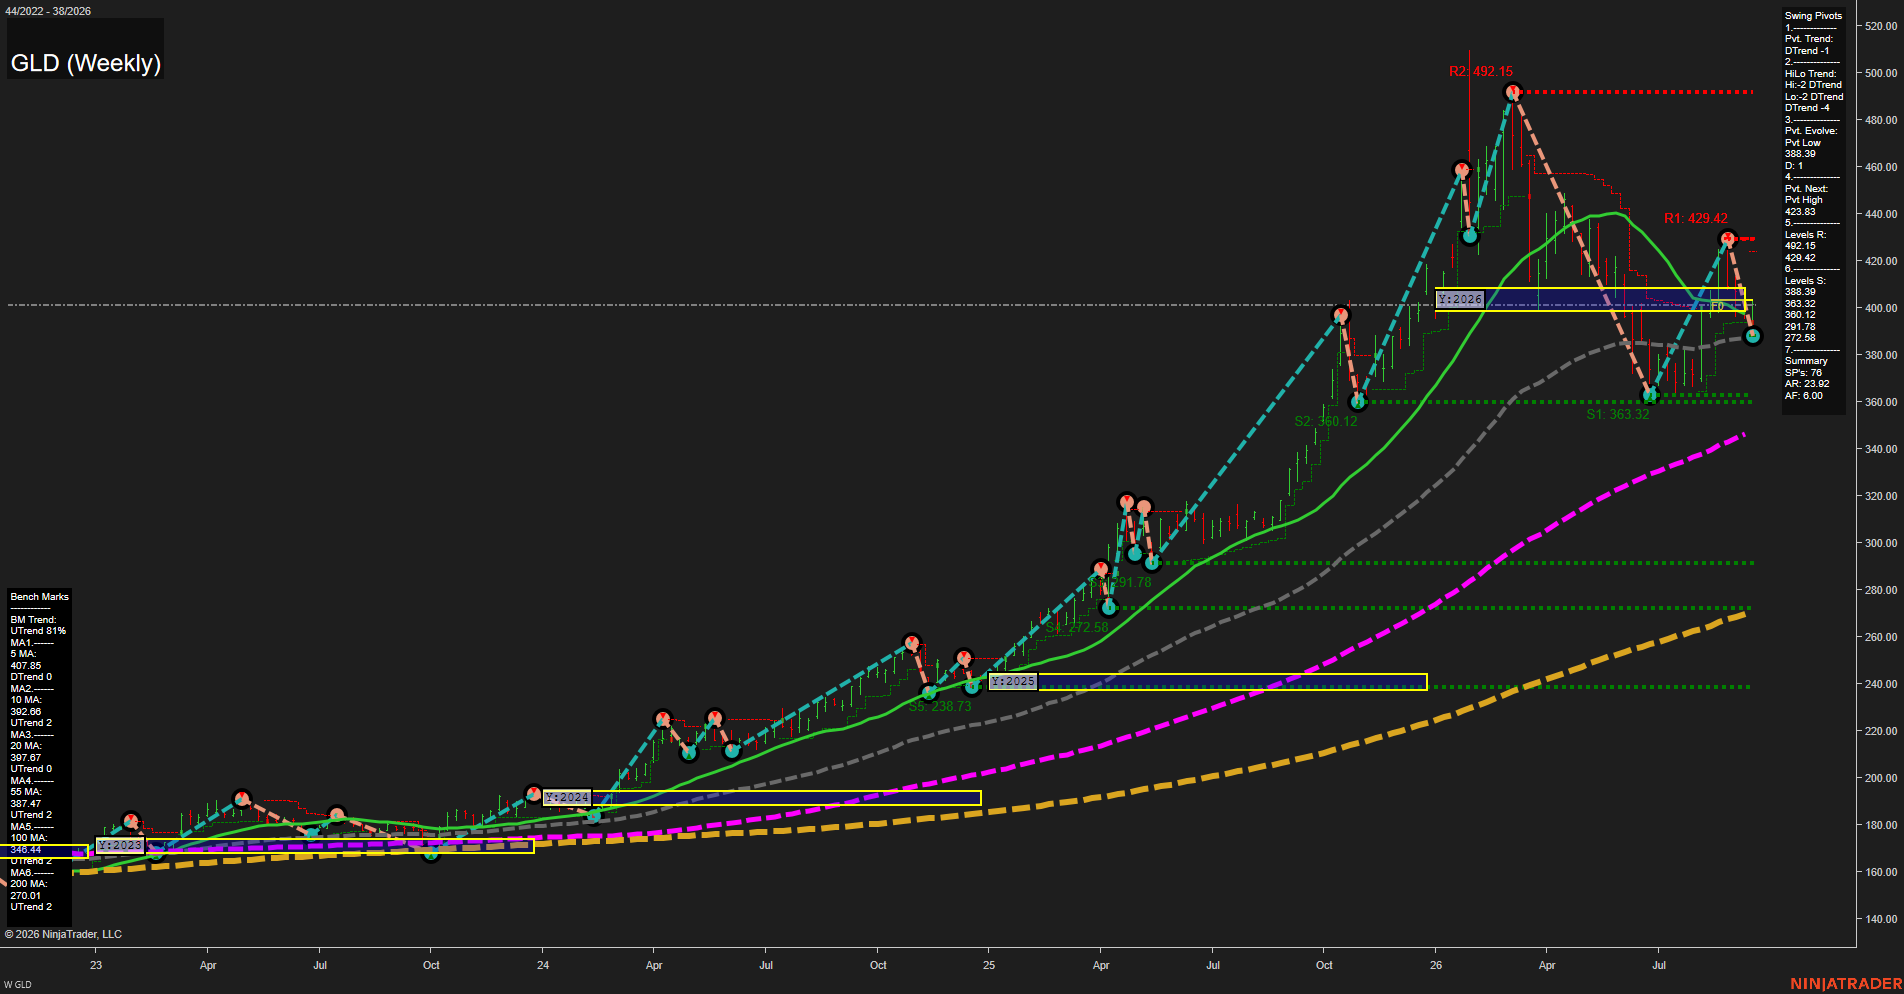
Overall Rating
- Short-Term: Neutral
- Intermediate-Term: Bullish
- Long-Term: Bullish.
Key Insights Summary
GLD is consolidating around the 2026 yearly F0% area near 400 following a sharp retracement from the 492.15 peak. The active short-term pivot structure remains in DTrend, although price has rebounded from the 388.39 pivot low and is holding above the rising 10-, 20-, and 55-week benchmarks. The 423.83 pivot threshold defines the next upside structural transition, while 388.39 and 363.32 remain the principal swing-support references. From a futures swing-trader perspective, this is a medium-volatility corrective phase within a still constructive intermediate- and long-term trend structure, with the rising major moving-average stack reflecting the broader gold bull cycle.
View charts on: AlphaWebTrader HTF Charts
ZB Weekly View
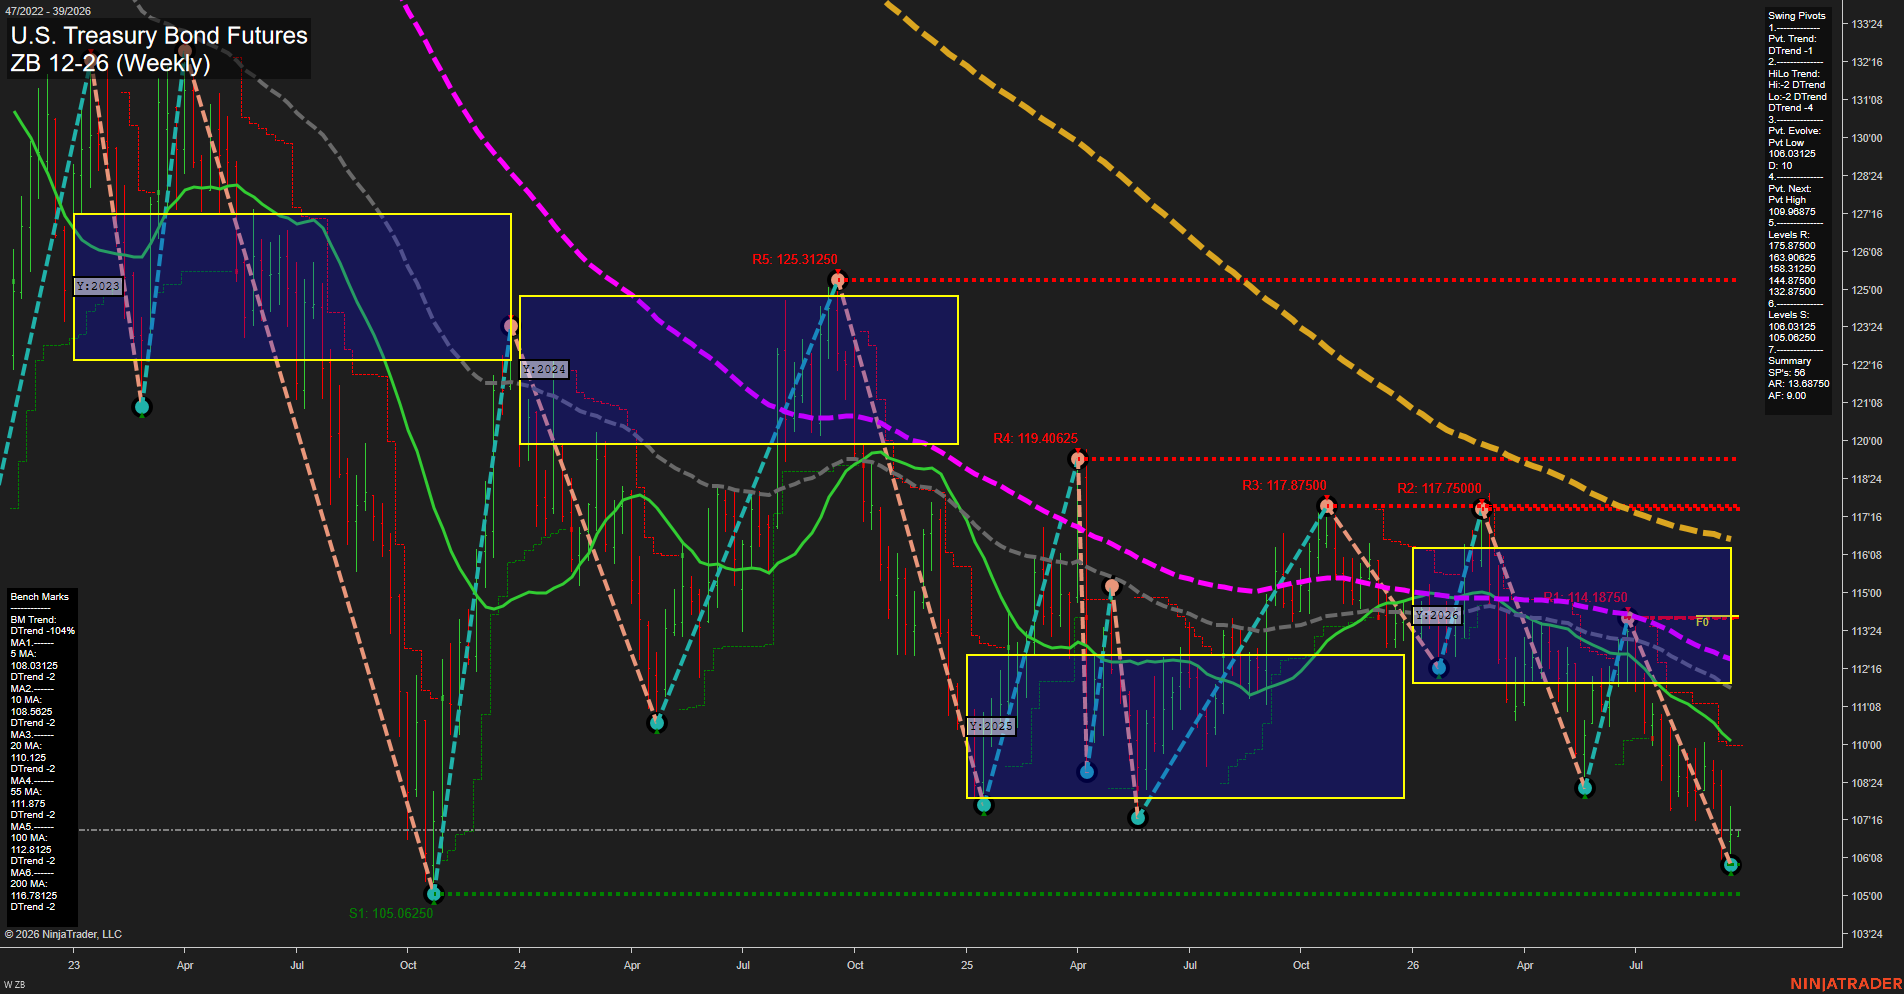
Overall Rating
- Short-Term: Bearish
- Intermediate-Term: Bearish
- Long-Term: Bearish.
Key Insights Summary
ZB remains in a broad weekly decline, with large-range downside bars and fast bearish momentum extending the sequence of lower highs and lower lows. Price is beneath every benchmark average, while the averages are aligned in declining order, confirming persistent multi-timeframe downside pressure. The 106.03125 pivot low is the immediate structural reference, with 105.06250 the next lower support; 109.09875 defines the reversal threshold required for a new short-term pivot high. The yearly grid position below its lower NTZ boundary reinforces the bearish long-term condition.
View charts on: AlphaWebTrader HTF Charts