Pre-market review tracks ETF movers and futures technicals as ES and NQ stay bullish, while Fed policy, crude, yields and Gulf risks shape sentiment.
Fundamentals: U.S. index futures posted modest gains as AI-sector strength, easing crude prices and lower Treasury yields supported risk sentiment. Nasdaq's record run and strong estimated S&P 500 earnings growth remain key equity themes, while data-center infrastructure demand draws attention. Fed tightening expectations, dollar strength, Gulf conflict developments and tight LNG supply remain important market cross-currents.
Technicals: Pre-market technical review shows ES and NQ holding bullish alignment across daily and weekly timeframes as both approach prior pivot resistance. YM, RTY, EMD and FDAX display mixed conditions, combining longer-term constructive structure with varying short- and intermediate-term corrective pressure. Prior-session ETF moves included gains in TSLA, QQQ and NVDA, while GOOG, AMZN and USO declined.
Pre-Market Trading 360° view Market Radar of: holidays, earnings, eco-news, market-news summary, news sentiment, prior session major ETFs, MAG7, Higher Time Frame Analysis Indices Futures Summary, and E-mini S&P500, Nasdaq 100, NYMEX Crude, Gold Futures Daily Chart analysis.
As of: September 23, 2026 07:16 CT
EcoNews Radar U.S. Events
| Day | Time | Impact | Event |
|---|---|---|---|
| Wed | 10:30 | Low | Crude Oil Inventories |
| Thu | 08:30 | Medium | Unemployment Claims |
| Fri | 10:00 | Medium | Revised UoM Consumer Sentiment |
| Fri | 10:00 | Medium | Revised UoM Inflation Expectations |
EcoNews Summary
No qualifying high-impact EcoNews events are listed. The qualifying event is Wednesday’s crude oil inventories release, which tracks changes in U.S. commercial crude stockpiles and provides a direct read on petroleum supply conditions and energy-price pressures.
Event Notes:
- Wednesday 10:30 USD Crude Oil Inventories: Reports the weekly change in U.S. crude oil stockpiles. Traders monitor inventory draws or builds for evidence of tightening or loosening petroleum supply, with implications for crude prices, energy-sector activity, and inflation-sensitive market sentiment.
Conclusion:
The single most important event of the week is Wednesday at 10:30, USD Crude Oil Inventories. As the only qualifying listed event, it focuses attention on petroleum supply and energy-price conditions. High oil prices directly affect markets through inflation and geopolitical concerns.
For full details visit: Forex Factory EcoNews
Market News Summary:
Index futures show slight early gains as AI strength, easing crude prices, and lower Treasury yields offset geopolitical and rate-policy risks.
Primary Drivers & Risks:
- Primary Driver: AI momentum and easing oil
- Primary Risk: Fed tightening and Gulf conflict
Tone:
Cautiously constructive, with elevated macro and geopolitical cross-currents.
Stock Market / ETFs / Indices:
Nasdaq closed at a record for a second consecutive session, while S&P 500 third-quarter earnings growth is estimated at 28.9%. U.S. futures posted slight gains, supported by AI-sector momentum and lower crude prices. Data-center infrastructure demand remained a notable equity theme, including fiber and liquid-cooling equipment.
Geopolitical:
U.S.-Iran discussions at the UN raised hopes for a diplomatic off-ramp in the seven-month conflict. Iran outlined conditions tied to restoring Strait of Hormuz traffic, while reports on reopening the waterway remained conflicting. Investors are also monitoring a Trump-Xi summit for developments involving tariffs, trade, AI, and Taiwan.
Oil / Energy:
Oil declined as Saudi Arabia restored supply on a key Red Sea pipeline and U.S.-Iran talks improved the diplomatic backdrop. Brent fell below $99 and WTI tested $88.68, easing inflation pressure and supporting risk sentiment. Gulf LNG disruption continued to tighten natural-gas markets, with Qatar supply issues supporting gas prices.
Gold / Metals:
Gold and silver remained constrained by Fed rate-hike expectations, firm dollar conditions, and elevated yields despite lower oil prices. Gold held near technical support, while price volatility also weighed on physical gold demand.
Fed / Financials:
Fed officials defended further rate increases, and rate-hike pricing continued to cap precious-metals gains. Treasury yields moved lower across the curve as crude declined, reducing near-term energy-driven inflation pressure. JPMorgan explored partnerships to underwrite rejected co-branded credit-card applications.
Macro / Other:
European equities edged higher ahead of business-activity data as lower oil aided sentiment. Market strength remains concentrated in mega-cap technology and AI hyperscalers, while some reports flagged pressure on smaller businesses from tariffs, fuel costs, and financing expenses. Bitcoin regained a $3 trillion aggregate digital-asset market value, alongside increased leveraged perpetual-futures activity.
Conclusion:
AI-related equity momentum, strong S&P 500 earnings growth, and falling crude prices underpin the firmer futures backdrop. Lower Treasury yields added support to risk sentiment.
Fed tightening expectations, dollar strength, and the Iran conflict remain key cross-currents. Energy supply conditions have eased for crude but remain tight in global LNG markets.
Market News Sentiment
Market News Articles: 39
- Neutral: 51.28%
- Positive: 28.21%
- Negative: 20.51%
Sentiment Summary: Among 39 market news articles, sentiment is predominantly neutral at 51%, with 28% positive and 21% negative.
Conclusion: The news flow presents a neutral overall tone for indices futures, with positive coverage exceeding negative coverage.
GLD,Gold Articles: 12
- Positive: 58.33%
- Negative: 33.33%
- Neutral: 8.33%
Sentiment Summary: GLD/Gold coverage was moderately positive, with 58% positive, 33% negative, and 8% neutral articles across 12 items.
Conclusion: Gold-related news tone was net positive, though one-third of coverage remained negative.
USO,Oil Articles: 15
- Negative: 53.33%
- Neutral: 40.00%
- Positive: 6.67%
Sentiment Summary: USO and oil coverage is predominantly negative at 53%, with 40% neutral and 7% positive articles.
Conclusion: The oil news tone is negative overall, which may be a relevant cross-market sentiment input for indices futures day traders.
Market Data Snapshot
ETF Snapshot of major stock market ETFs, Mag7, and others as of: September 23, 2026 07:16
Top Movers & Losers
- TSLA 378.90 Bullish 0.96% ▲
- QQQ 747.46 Bullish 0.81% ▲
- NVDA 228.87 Bullish 0.66% ▲
- GOOG 347.41 Bearish -0.99% ▼
- AMZN 254.98 Bearish -1.34% ▼
- USO 144.08 Bearish -2.75% ▼
Major Index ETFs: SPY, QQQ, DIA, IWM, IJH
- QQQ 747.46 Bullish 0.81% ▲
- IWM 287.21 Bullish 0.57% ▲
- IJH 73.47 Bullish 0.30% ▲
- SPY 773.38 Bearish -0.02% ▼
- DIA 518.00 Bearish -0.34% ▼
Mixed index ETF snapshot: QQQ is the most bullish mover at +0.81%, followed by IWM at +0.57% and IJH at +0.30%. DIA is the most bearish mover at -0.34%, while SPY is marginally Bearish at -0.02%.
Mag 7 Stocks: AAPL, MSFT, GOOG, AMZN, META, NVDA, TSLA
- TSLA 378.90 Bullish 0.96% ▲
- NVDA 228.87 Bullish 0.66% ▲
- AAPL 339.75 Bullish 0.23% ▲
- META 736.60 Bearish -0.63% ▼
- MSFT 498.00 Bearish -0.72% ▼
- GOOG 347.41 Bearish -0.99% ▼
- AMZN 254.98 Bearish -1.34% ▼
Mixed Mag7 snapshot: TSLA is the most bullish mover at +0.96%, followed by NVDA at +0.66% and AAPL at +0.23%. AMZN is the most bearish mover at -1.34%, with GOOG at -0.99%, MSFT at -0.72%, and META at -0.63%.
Cross-Market ETFs: TLT, GLD, USO, IBIT
- GLD 400.07 Bullish 0.42% ▲
- TLT 81.75 Bearish -0.06% ▼
- IBIT 48.83 Bearish -0.37% ▼
- USO 144.08 Bearish -2.75% ▼
Mixed cross-market tone: GLD is the most bullish mover at +0.42%, while USO is the most bearish mover at -2.75%. IBIT is lower at -0.37%, and TLT is marginally Bearish at -0.06%.
ETF, Mag7, and Cross-Market ETF Insights
Overall Tone
Mixed tone: equity index performance is selective, with growth and small caps Bullish while the Dow is Bearish, and cross-market ETFs are led lower by oil.
Equity ETFs and Mag7:
Major Index ETFs are Mixed: QQQ is Bullish at +0.81%, IWM at +0.57%, and IJH at +0.30%, while SPY is marginally Bearish at -0.02% and DIA is Bearish at -0.34%. Mag7 performance is selective: TSLA is the most bullish mover at +0.96%, followed by NVDA at +0.66% and AAPL at +0.23%, while AMZN is the most bearish Mag7 mover at -1.34%, followed by GOOG at -0.99%, MSFT at -0.72%, and META at -0.63%.
Cross-Market ETFs:
Cross-market ETFs are Mixed, with GLD Bullish at +0.42% while TLT is marginally Bearish at -0.06% and IBIT is Bearish at -0.37%. USO is the most bearish cross-market and overall mover at -2.75%, creating notable commodity weakness against the Bullish move in gold.
Futures Indices – Higher Time Frame Analysis
Summary of the current state of US Indices Futures based on higher time-frame (HTF) technical analysis as of: 2026-09-23: 07:16 CT.
US Indices Futures
- ES YSFG/MSFG/WSFG bullish, benchmarks rising, UTrend pivots, 7848.50-7850.25 resistance, 7906.25 higher resistance, 7556.25 support.
- NQ YSFG/MSFG/WSFG bullish, all benchmarks rising, UTrend pivots, 31094.75-31389.25 resistance, 30230.75 support, 29633.00 deeper support.
- YM YSFG bullish, MSFG bearish, WSFG above F0%, mixed benchmarks, 53963 reversal level, 55316 resistance, 51609-51809 support.
- EMD YSFG/WSFG bullish, MSFG bearish, short-term DTrend, below short benchmarks, 3704.5-3825.3 resistance, 3636.2-3617.1 support.
- RTY YSFG/WSFG bullish, MSFG bearish, mixed pivot structure, below intermediate benchmarks, 2931.2-3005.2 resistance, 2850-2852 support.
- FDAX YSFG/WSFG bullish, MSFG bearish, short-term mixed, below 20/55-day benchmarks, 25990-26027 resistance, 25444-25362 support.
Overall State
- Short-Term: Bullish
- Intermediate-Term: Neutral
- Long-Term: Bullish
Conclusion
ES and NQ retain aligned bullish YSFG, MSFG, WSFG, benchmark, and pivot conditions while testing swing-high resistance. YM, EMD, RTY, and FDAX retain bullish yearly structures but have bearish or neutral intermediate MSFG conditions and mixed short-term pivot sequences. EMD, RTY, and FDAX remain below key short- and intermediate-term benchmarks; their cited supports define active corrective swing structures.
Note: Intra-day counter-trend pullbacks or retracements may occur, HTF is context for informational usage and market structure. Glossary: Session Fib Grids periods of YSFG:’Yearly’, MSFG:’Monthly’, WSFG:’Weekly’
For full details visit: AlphaWebTrader Technicals
ES Daily View
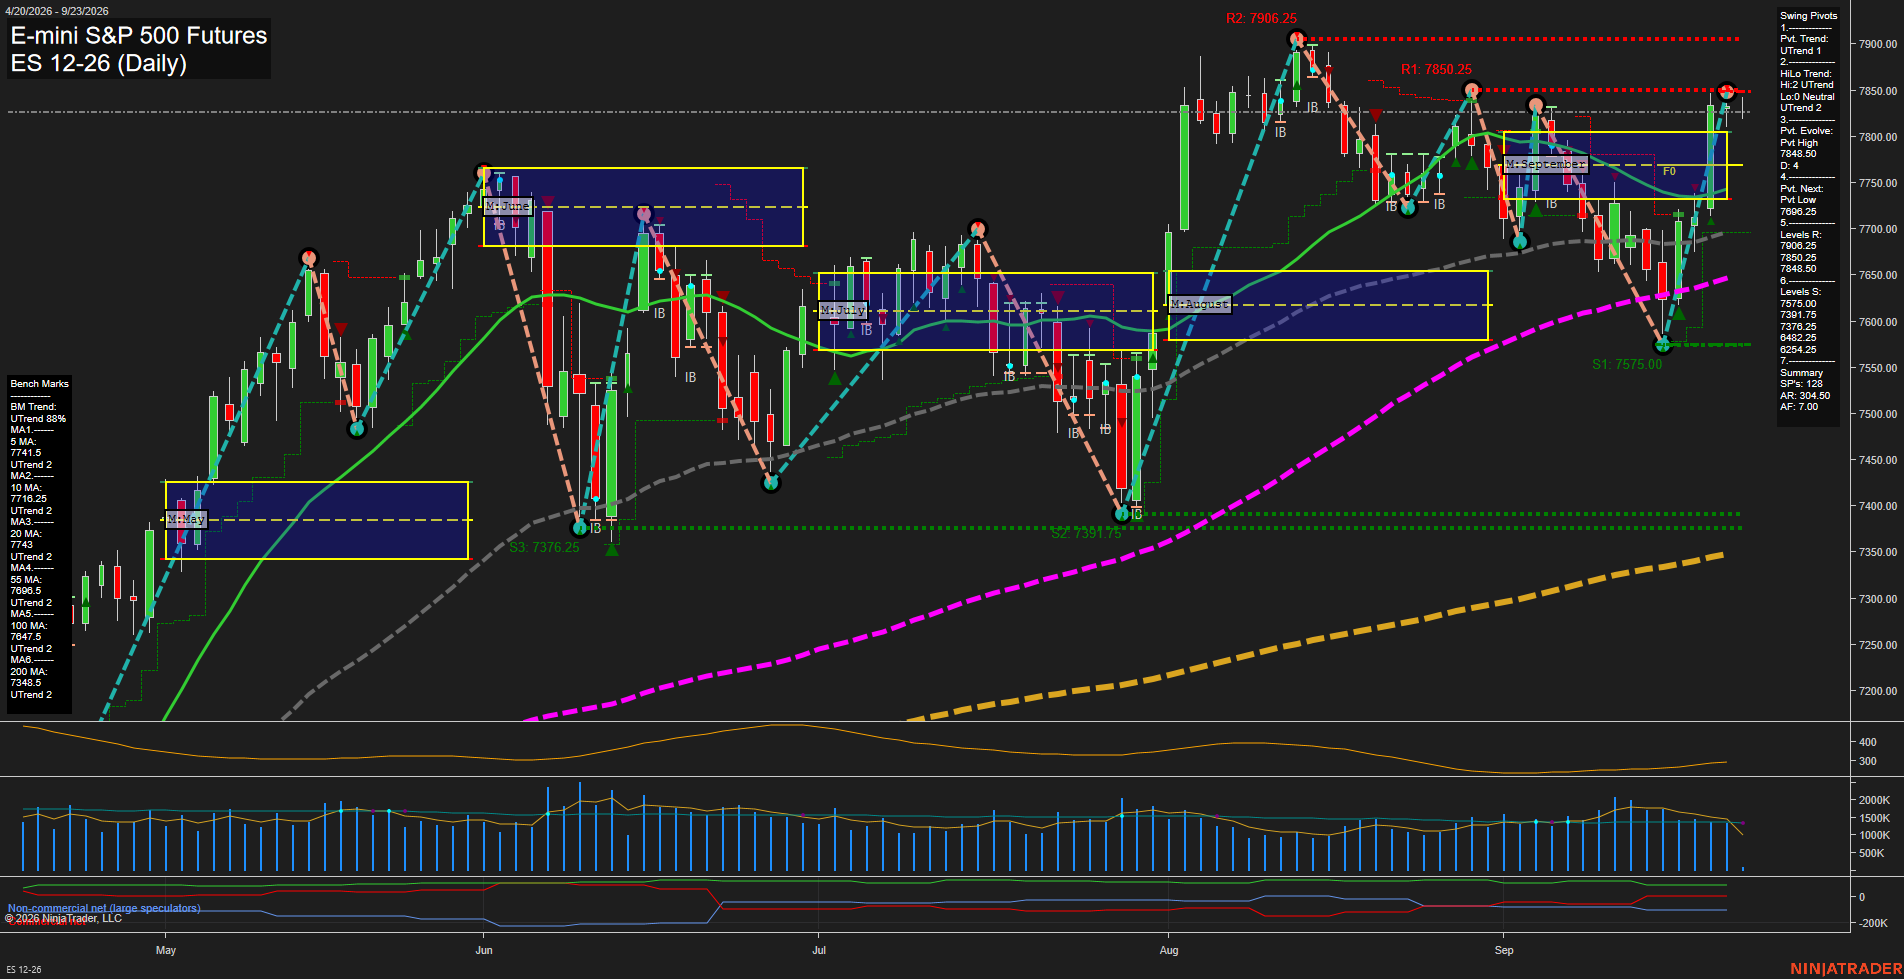
Overall Rating
- Short-Term: Bullish
- Intermediate-Term: Bullish
- Long-Term: Bullish.
Key Insights Summary
ES has staged a sharp V-style recovery from the 7575 swing-low area and is trading above all six rising daily benchmarks. Short-term momentum is fast as price approaches the clustered 7848.50 to 7850.25 pivot-resistance zone; 7906.25 is the next higher resistance reference. Both pivot-trend measures remain in UTrend, while the monthly and yearly Fib-grid structure remains positive. The recent long-direction signals align across short-, intermediate-, and long-term models, with the market structure characterized by higher lows and a renewed test of the prior swing-high region.
View charts on: AlphaWebTrader HTF Charts
NQ Daily View
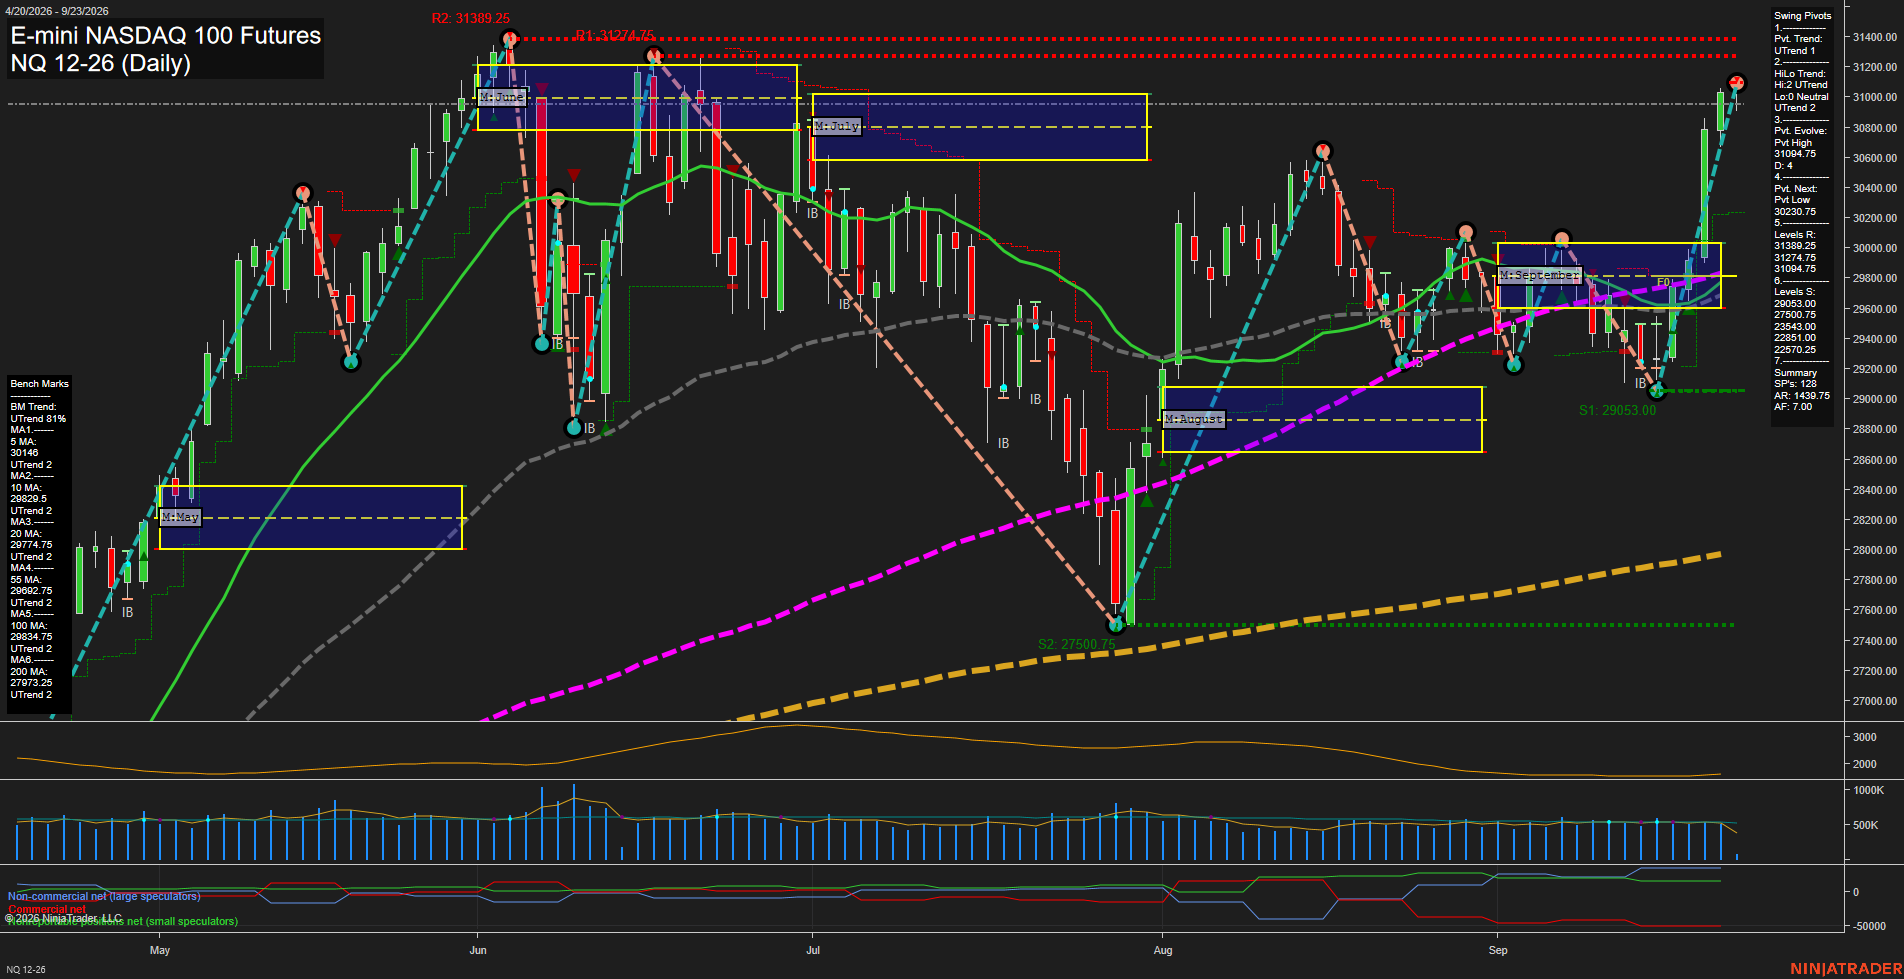
Overall Rating
- Short-Term: Bullish
- Intermediate-Term: Bullish
- Long-Term: Bullish.
Key Insights Summary
Price has produced a sharp V-recovery from the September pivot low and expanded above the monthly F0% area, with large bullish daily bars carrying momentum into the 31094.75 pivot-high area. Short-term and intermediate pivot structures are both in UTrend, while price is above every benchmark average and all six averages are rising. The immediate swing structure is pressing clustered resistance at 31094.75, 31274.75, and 31389.25; 30230.75 is the next pivot-reversal reference, with the 29633.00 area representing deeper structural support. The rally is technically broad-based but fast, reflecting elevated directional range expansion rather than a quiet consolidation.
View charts on: AlphaWebTrader HTF Charts
CL Daily View
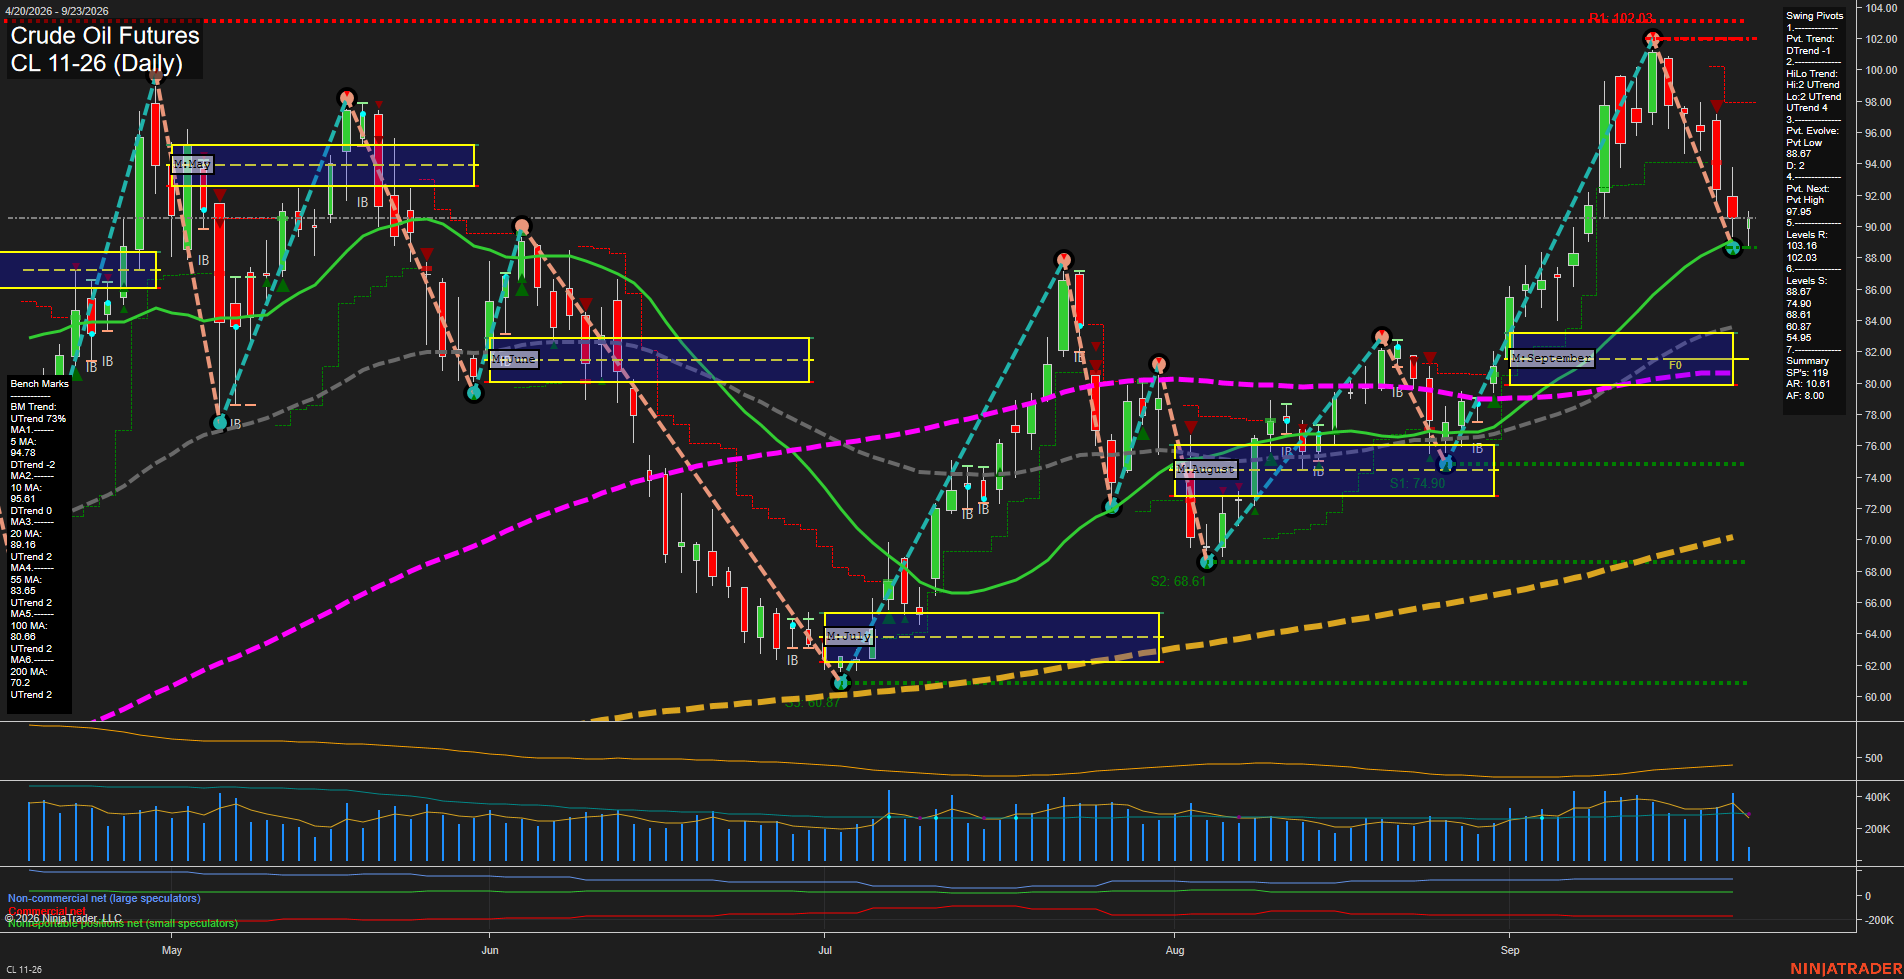
Overall Rating
- Short-Term: Bearish
- Intermediate-Term: Bullish
- Long-Term: Bullish.
Key Insights Summary
Price has undergone a fast, large-bar retracement from the 102.03 pivot-high resistance area, shifting the short-term pivot structure into DTrend and placing price below declining 5- and 10-day benchmarks. The 88.67 pivot-low support and nearly coincident rising 20-day average at 89.16 define the immediate technical inflection area. Intermediate and long-term structure remains constructive: the HiLo trend is UTrend, price remains above the monthly F0% region, and the 20-, 55-, 100-, and 200-day benchmarks retain upward trends. The current pattern is a sharp countertrend pullback within the broader advance, with 91.16 as nearby resistance and 97.95-102.03 marking the upper recovery and prior-high zone.
View charts on: AlphaWebTrader HTF Charts
GC Daily View
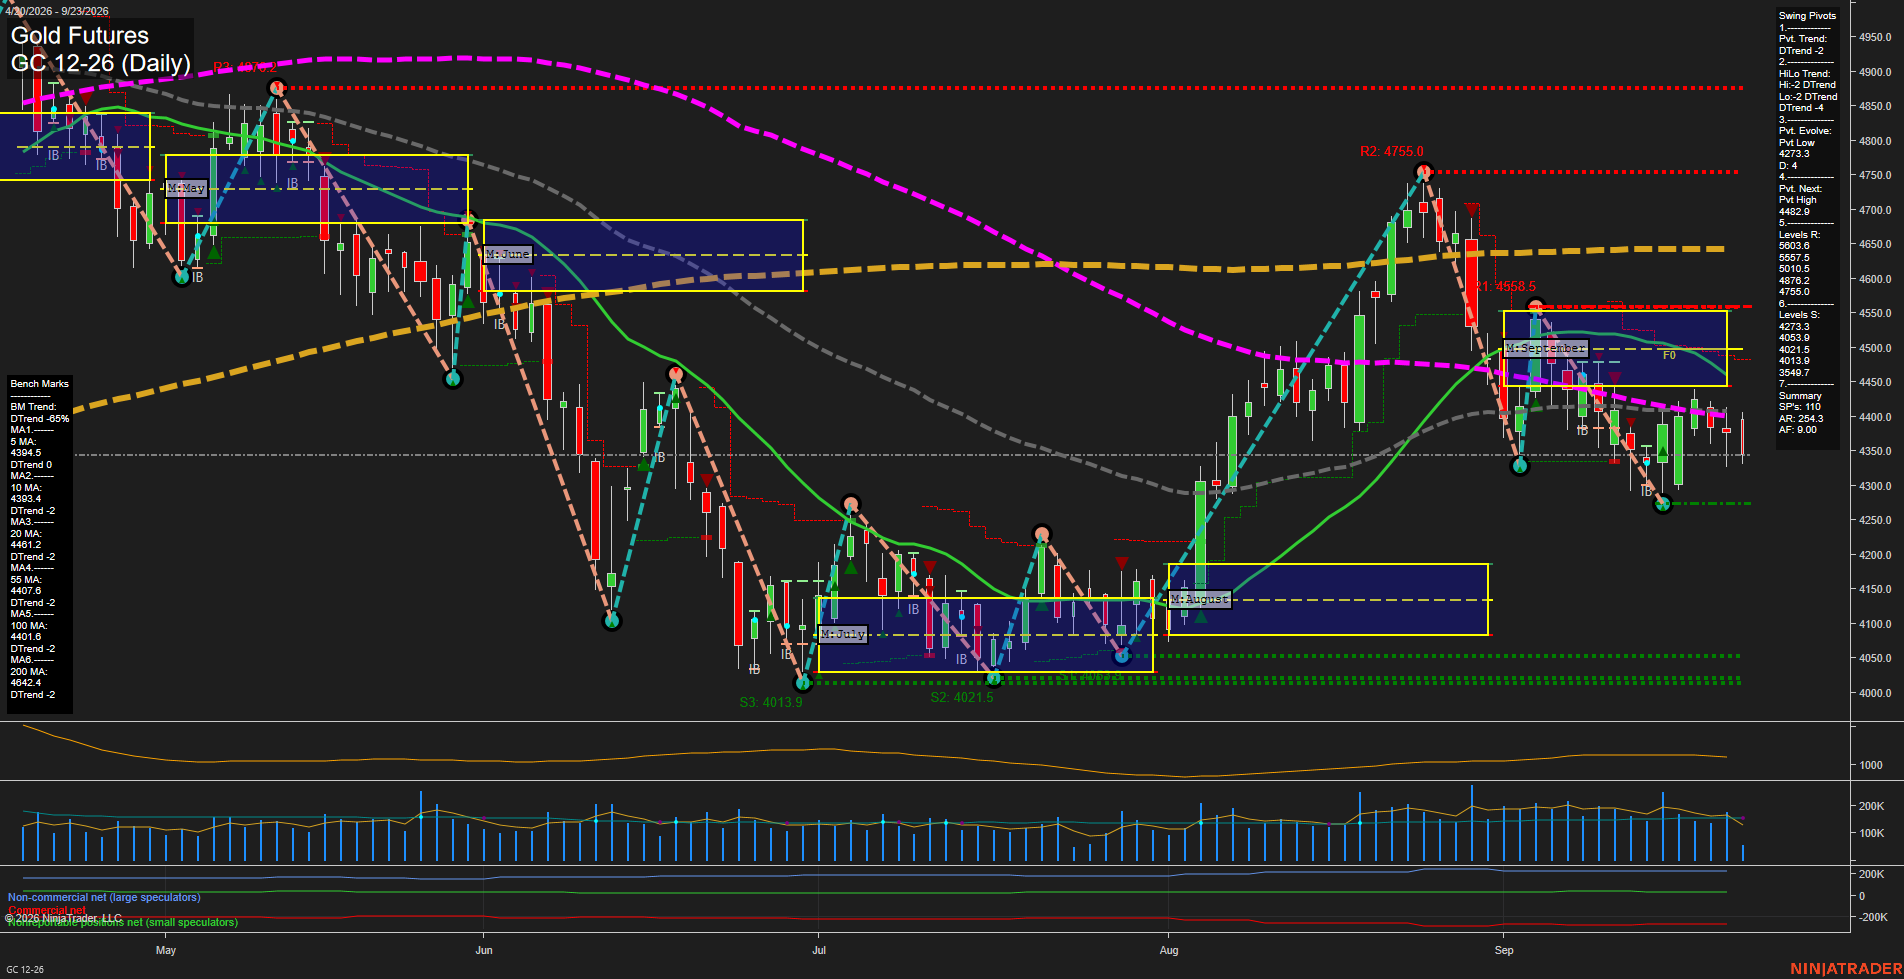
Overall Rating
- Short-Term: Bearish
- Intermediate-Term: Bearish
- Long-Term: Bearish.
Key Insights Summary
Gold remains in a broad bearish swing structure: price is below every benchmark average, both pivot trends are down, and the weekly, monthly, and yearly Fib-grid readings remain below their F0% levels. The late-August rally to 4755.0 was rejected sharply, creating a lower-high sequence followed by a decline toward the 4273.3 pivot-low area. Recent candles show a smaller-range consolidation near 4350 after the selloff, indicating slower downside momentum rather than a confirmed trend reversal. The 4393-4408 moving-average cluster and 4482.9 next-pivot level define the principal overhead resistance zone, while 4273.3 is the nearest swing support within the current declining structure.
View charts on: AlphaWebTrader HTF Charts
ZB Daily View
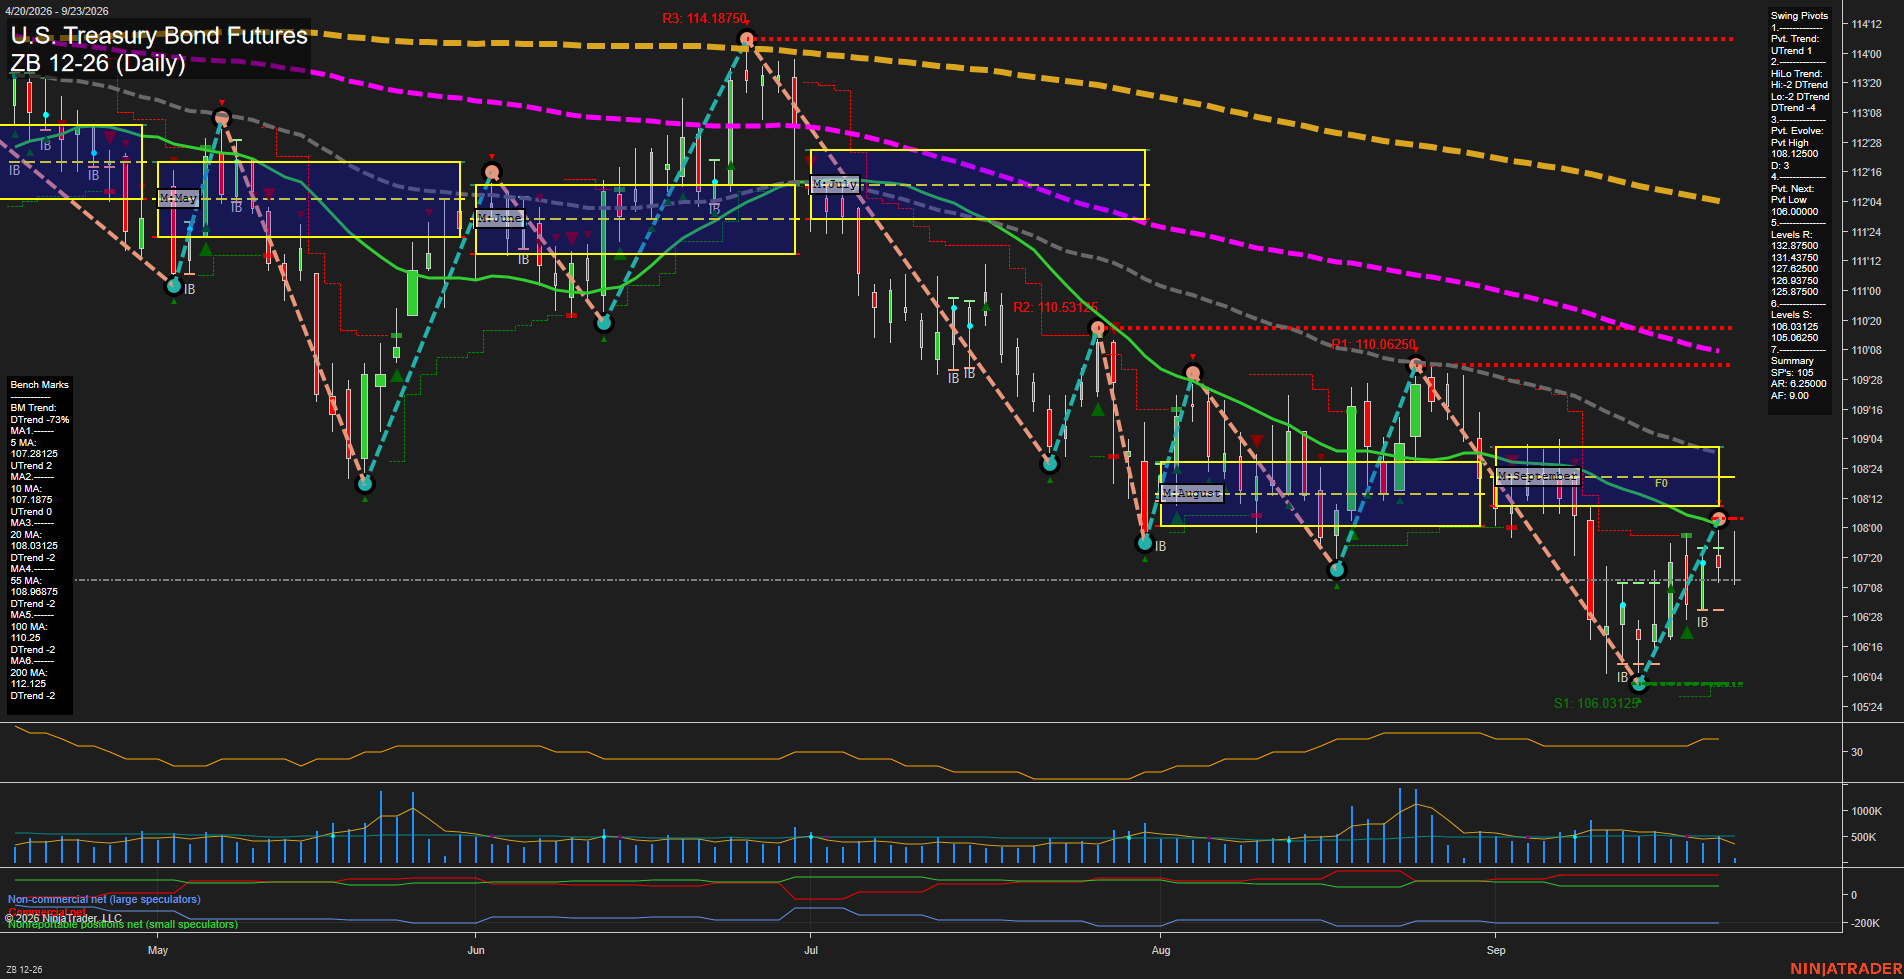
Overall Rating
- Short-Term: Bullish
- Intermediate-Term: Bearish
- Long-Term: Bearish.
Key Insights Summary
The daily structure shows a short-term recovery from the 106.00000 pivot-low area, confirmed by the UTrend pivot state and rising 5-day and 10-day benchmarks. This rebound remains countertrend within a broader intermediate and long-term decline: price is below the September MSFG F0%/NTZ area and below the declining 20-, 55-, 100-, and 200-day benchmarks. The current swing is characterized by a rebound followed by consolidation near 107-08, with 108.03125 and the monthly grid area defining the nearest intermediate-term overhead technical zone, while 106.03125 and 105.06250 remain the principal downside swing-support references.
View charts on: AlphaWebTrader HTF Charts