U.S. stocks closed mixed as AI-led tech gains met pressure from rising Treasury yields, financial weakness, oil volatility and energy inflation risks.
Fundamentals: U.S. equities ended mixed, with AI enthusiasm lifting large technology shares and supporting Nasdaq records while financials weakened. Rising Treasury yields, hawkish Federal Reserve messaging and elevated energy-inflation concerns weighed on broader sentiment. Oil fell on U.S.-Iran talks, though tight refined-fuel supplies and low European gas inventories remained macro risks.
Technicals: Major equity futures showed mixed technical conditions at the NYSE close. ES and NQ retained bullish alignment across daily and weekly timeframes following sharp recoveries, while YM remained weaker in the short and intermediate term. E-mini S&P, Nasdaq, Dow, Russell 2000, DAX and emerging-market futures faced varied resistance, support and corrective-trend signals.
After Market Close daily snapshot: market news summary and sentiment, major ETFs, Magnificent 7 analysis, Indices Futures Higher Time Frame Analysis, and E-mini S&P500, Nasdaq 100, NYMEX Crude, Gold Futures Daily Chart analysis.
As of: September 22, 2026 05:00 CT
Market News Summary:
U.S. equities finished mixed as AI-driven technology strength offset pressure from financials, elevated yields, and persistent energy-inflation concerns.
Primary Drivers & Risks:
- Primary Driver: AI-led large-cap technology strength
- Primary Risk: Rising yields and energy inflation
Tone:
Mixed, with tech leadership countered by macro and energy risks.
Stock Market / ETFs / Indices:
Large technology companies reached further records on AI-product enthusiasm, helping keep U.S. stocks mixed rather than broadly lower. Financial shares weakened amid AI competition concerns and a flattening yield curve, while commentary flagged elevated S&P 500 valuations and concentration in hyperscaler spending.
Geopolitical:
U.S.-Iran discussions in New York coincided with lower oil prices as markets focused on continued negotiations. Separately, Beijing-linked AI activity targeting Tibetan dissidents added to U.S.-China technology-security concerns.
Oil / Energy:
WTI and Brent moved lower following reports of U.S.-Iran engagement, but refined-product supply remains tight: diesel and jet-fuel prices have risen amid Hormuz-related disruptions. Low European natural-gas inventories and energy-inflation concerns remain significant macro cross-currents.
Gold / Metals:
Gold demand remained supported despite high real yields, with rising ETF holdings and fiscal or liquidity concerns cited as factors weakening the traditional inverse relationship with yields. Silver’s U.S. critical-minerals designation introduced a separate policy-related metals theme.
Fed / Financials:
The 10-year Treasury yield rose from roughly 4.0% last October to nearly 4.9% by mid-September, while the latest two-year Treasury auction drew the highest yield since 2024. Hawkish Fed communication after a recent rate increase reinforced rate sensitivity, and bank shares faced added pressure from bond-market signals.
Conclusion:
AI enthusiasm supported major technology shares and Nasdaq records, while broad U.S. equity performance remained mixed. Higher Treasury yields and a hawkish policy backdrop remained central index-futures inputs.
Oil declined on Iran-talk headlines, but tight fuel supplies and low European gas inventories sustained inflation concerns. Financial-sector weakness, energy volatility, and concentration concerns around hyperscaler investment tempered the technology-led strength.
Market News Sentiment
Market News Articles: 46
- Neutral: 58.70%
- Positive: 23.91%
- Negative: 17.39%
Sentiment Summary: Market news sentiment is predominantly neutral (59%), with positive coverage (24%) exceeding negative coverage (17%).
Conclusion: Indices futures headlines reflect a largely balanced information environment with a modest positive skew.
GLD,Gold Articles: 11
- Positive: 72.73%
- Negative: 27.27%
Sentiment Summary: Gold-related coverage was 73% positive and 27% negative across 11 articles.
Conclusion: The gold news tone was predominantly positive, indicating a generally supportive safe-haven sentiment relevant to indices futures day traders.
USO,Oil Articles: 17
- Neutral: 41.18%
- Negative: 29.41%
- Positive: 29.41%
Sentiment Summary: USO/Oil coverage is neutral overall, with 41% neutral articles and evenly split positive and negative sentiment at 29% each.
Conclusion: Oil-related news presents balanced sentiment with no clear directional bias for indices futures.
Market Data Snapshot
ETF Snapshot of major stock market ETFs, Mag7, and others as of: September 22, 2026 05:00
Top Movers & Losers
- TSLA 378.90 Bullish 0.96% ▲
- QQQ 747.46 Bullish 0.81% ▲
- NVDA 228.87 Bullish 0.66% ▲
- GOOG 347.41 Bearish -0.99% ▼
- AMZN 254.98 Bearish -1.34% ▼
- USO 144.08 Bearish -2.75% ▼
Major Index ETFs: SPY, QQQ, DIA, IWM, IJH
- QQQ 747.46 Bullish 0.81% ▲
- IWM 287.21 Bullish 0.57% ▲
- IJH 73.47 Bullish 0.30% ▲
- SPY 773.38 Bearish -0.02% ▼
- DIA 518.00 Bearish -0.34% ▼
Mixed index ETF snapshot: QQQ is the most bullish mover at +0.81%, followed by IWM at +0.57% and IJH at +0.30%. SPY is marginally Bearish at -0.02%, while DIA is the most bearish mover at -0.34%.
Mag 7 Stocks: AAPL, MSFT, GOOG, AMZN, META, NVDA, TSLA
- TSLA 378.90 Bullish 0.96% ▲
- NVDA 228.87 Bullish 0.66% ▲
- AAPL 339.75 Bullish 0.23% ▲
- META 736.60 Bearish -0.63% ▼
- MSFT 498.00 Bearish -0.72% ▼
- GOOG 347.41 Bearish -0.99% ▼
- AMZN 254.98 Bearish -1.34% ▼
Mag7 action is Mixed: TSLA is the most bullish mover at +0.96%, followed by NVDA at +0.66% and AAPL at +0.23%. AMZN is the most bearish mover at -1.34%, with GOOG at -0.99%, MSFT at -0.72%, and META at -0.63%.
Cross-Market ETFs: TLT, GLD, USO, IBIT
- GLD 400.07 Bullish 0.42% ▲
- TLT 81.75 Bearish -0.06% ▼
- IBIT 48.83 Bearish -0.37% ▼
- USO 144.08 Bearish -2.75% ▼
Mixed: GLD is the most bullish mover at +0.42%, while USO is the most bearish mover at -2.75%. IBIT is Bearish at -0.37%, and TLT is marginally Bearish at -0.06%.
ETF, Mag7, and Cross-Market ETF Insights
Overall Tone
Mixed, with Bullish participation in QQQ and small caps offset by Bearish pressure in several Mag7 names and USO.
Equity ETFs and Mag7:
Major Index ETFs were Mixed: QQQ led +0.81%, followed by IWM at +0.57% and IJH at +0.30%, while SPY was marginally Bearish at -0.02% and DIA declined -0.34%. Mag7 performance was selective, led by TSLA—the most Bullish equity mover—at +0.96%, with NVDA up +0.66%, while AMZN was the most Bearish equity mover at -1.34% amid declines in GOOG, MSFT, and META.
Cross-Market ETFs:
Cross-market ETFs were Mixed, with GLD the most Bullish mover at +0.42% while TLT was marginally Bearish at -0.06% and IBIT fell -0.37%. USO was the most Bearish cross-market mover at -2.75%, showing pronounced Bearish commodity weakness versus the modest Bullish move in gold.
Futures Indices – Higher Time Frame Analysis
Summary of the current state of US Indices Futures based on higher time-frame (HTF) technical analysis as of: 2026-09-22: 17:00 CT.
US Indices Futures
- ES YSFG/MSFG/WSFG up, above 20/55/100/200 benchmarks, UTrend pivots; 7556.25 support/reversal, 7847.25-7850.25 then 7906.25 resistance.
- NQ YSFG/MSFG/WSFG up, above all benchmarks, UTrend pivots; 30079.50 support, 30916.50 pivot, 31274.75-31389.25 resistance.
- YM YSFG/WSFG up, MSFG down; below short benchmarks and DTrend daily pivots, above long benchmarks; 51689 support, 52747-53215 recovery zone, 53957 resistance.
- EMD YSFG/WSFG up, MSFG down; below 10/20/55/100 benchmarks, DTrend pivots; 3617.1-3638.2 support, 3725.2 pivot, 3834.0-3896.8 resistance.
- RTY YSFG/WSFG up, MSFG down; below 10/20/55/100 benchmarks, down pivots; 2851.9 support, 2927.1 pivot, 2958.6-3005.2 resistance.
- FDAX YSFG up, MSFG mixed/down, WSFG downswing; above daily benchmarks, weekly DTrend; 25362 support, 25990-26083 resistance, 26847 pivot high.
Overall State
- Short-Term: Neutral
- Intermediate-Term: Bearish
- Long-Term: Bullish
Conclusion
ES and NQ retain aligned YSFG, MSFG, WSFG, benchmark, and pivot structure, leading the index complex higher. YM, EMD, and RTY remain in monthly-grid retracements beneath intermediate benchmarks, while FDAX shows a daily recovery within its weekly corrective swing. Long-term yearly-grid and 55/100/200-period benchmark alignment remains upward across the group, with defined pivot support and overhead resistance levels framing current consolidation and retracement ranges.
Note: Intra-day counter-trend pullbacks or retracements may occur, HTF is context for informational usage and market structure. Glossary: Session Fib Grids periods of YSFG:’Yearly’, MSFG:’Monthly’, WSFG:’Weekly’
For full details visit: AlphaWebTrader Technicals
ES Daily View
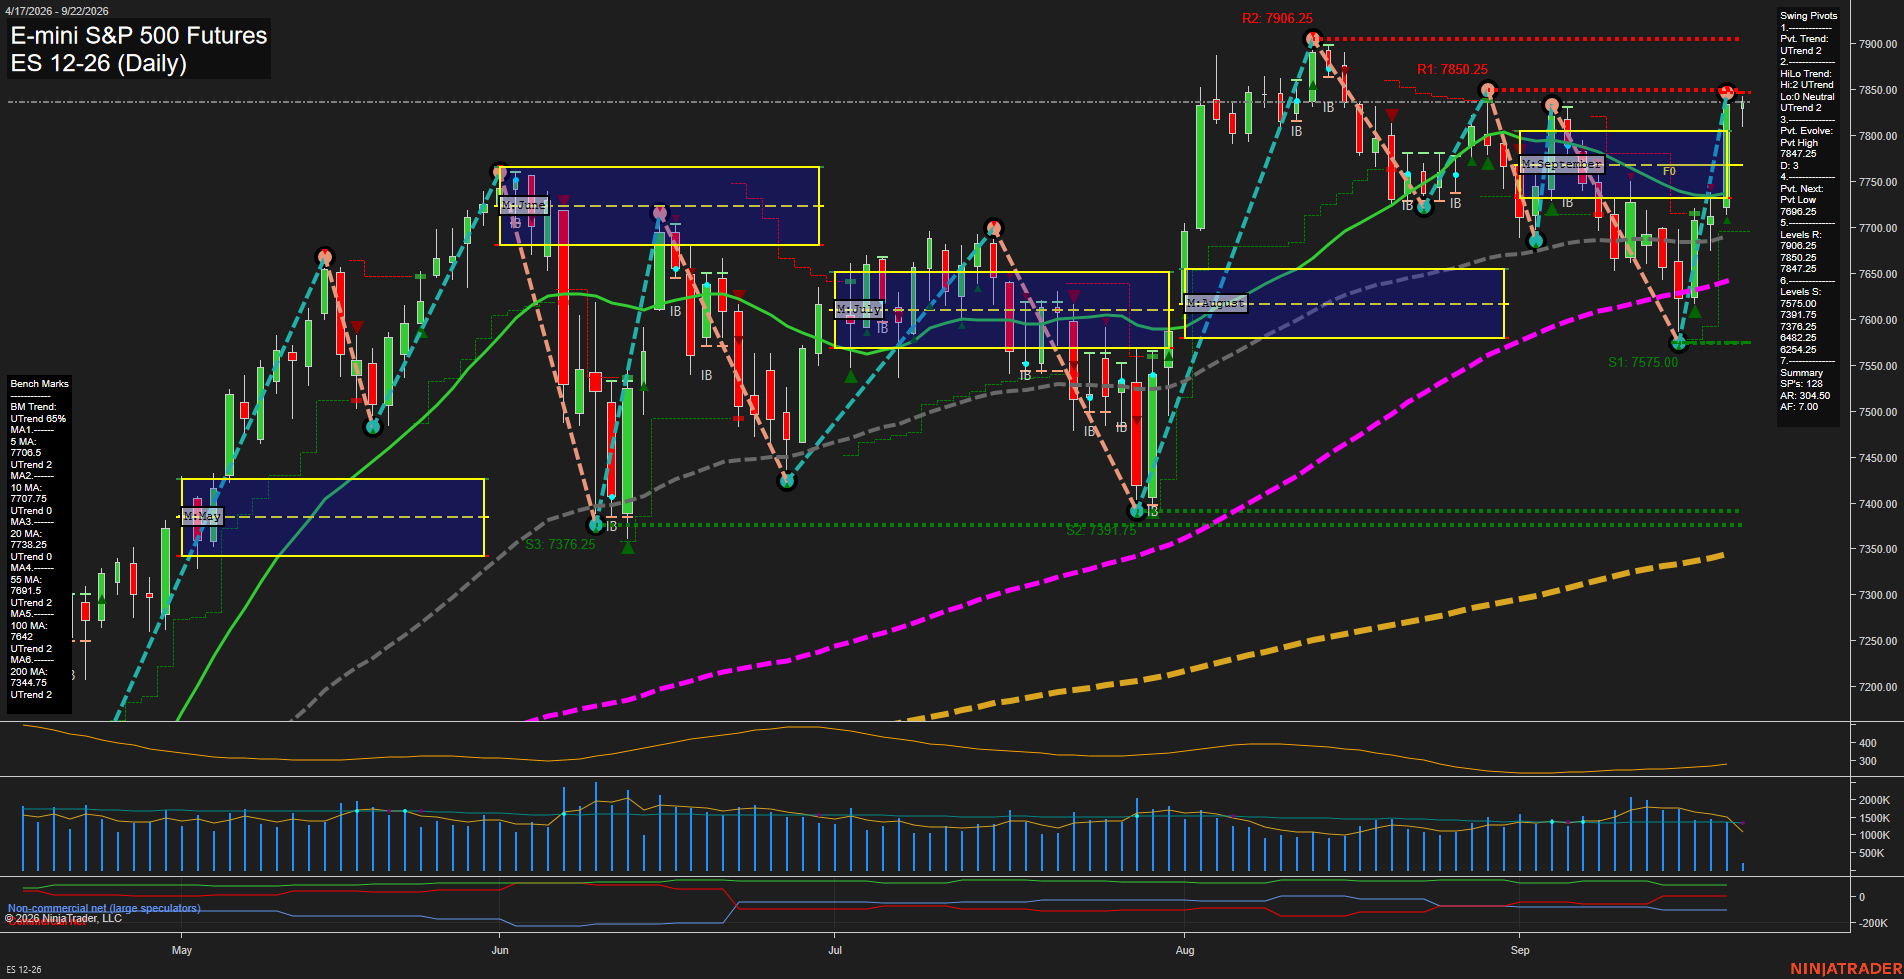
Overall Rating
- Short-Term: Bullish
- Intermediate-Term: Bullish
- Long-Term: Bullish.
Key Insights Summary
The daily structure reflects a sharp V-shaped recovery from the 7391.75-7376.25 support cluster, with large-range upside bars carrying ES back above all benchmark averages and above both weekly and monthly F0% levels. Short-term momentum is fast and the active pivot sequence remains upward, although price is testing the 7847.25-7850.25 resistance area beneath the 7906.25 swing-high level. Intermediate and long-term conditions remain aligned higher through rising pivot structure, positive MSFG and YSFG positioning, and broad moving-average separation.
View charts on: AlphaWebTrader HTF Charts
NQ Daily View
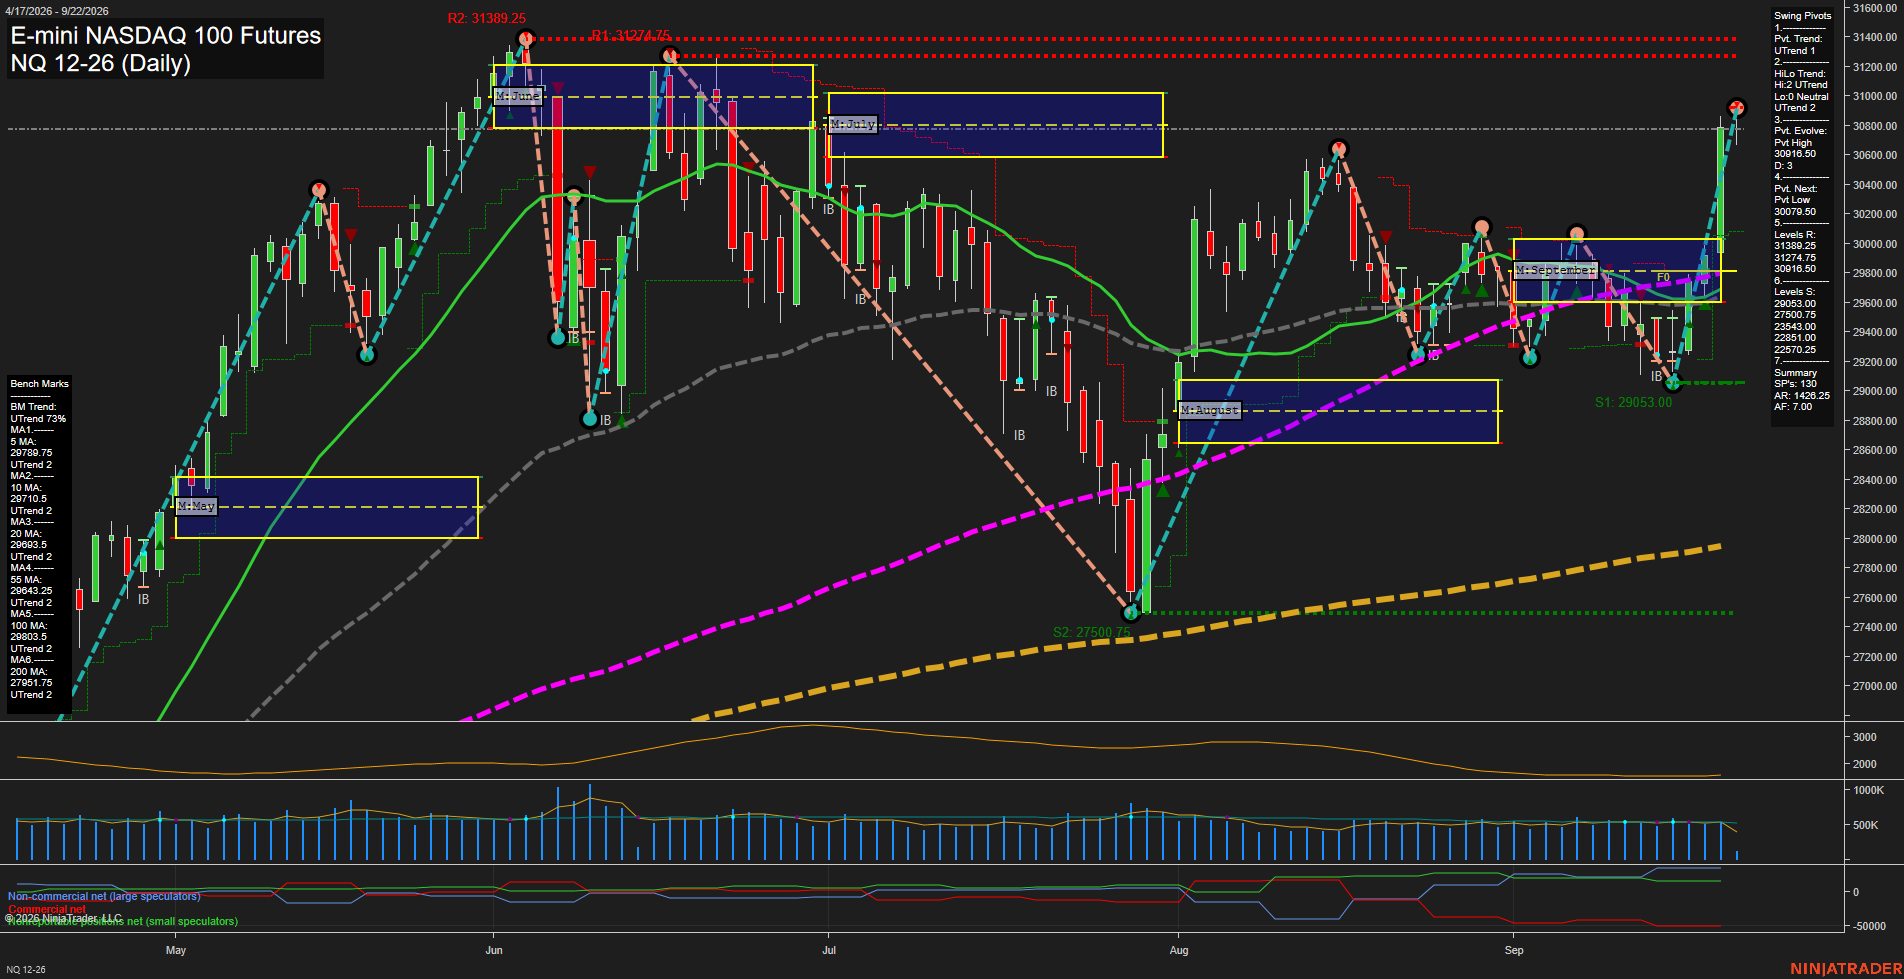
Overall Rating
- Short-Term: Bullish
- Intermediate-Term: Bullish
- Long-Term: Bullish.
Key Insights Summary
Price action has produced a sharp upside continuation from the September pullback, with large-range bars and fast momentum lifting NQ above the weekly and monthly fib-grid centers. The pivot structure remains aligned upward across short- and intermediate-term horizons, while price is positioned above all benchmark averages. The 30916.50 pivot high is the immediate reference point beneath the higher resistance cluster at 31274.75 to 31389.25; 30079.50 is the active opposite-pivot level, with 29053.00 the larger swing-support reference. Elevated ATR reflects a high-volatility advance rather than a quiet consolidation, and recent long signals remain aligned across short-, intermediate-, and long-term systems.
View charts on: AlphaWebTrader HTF Charts
CL Daily View
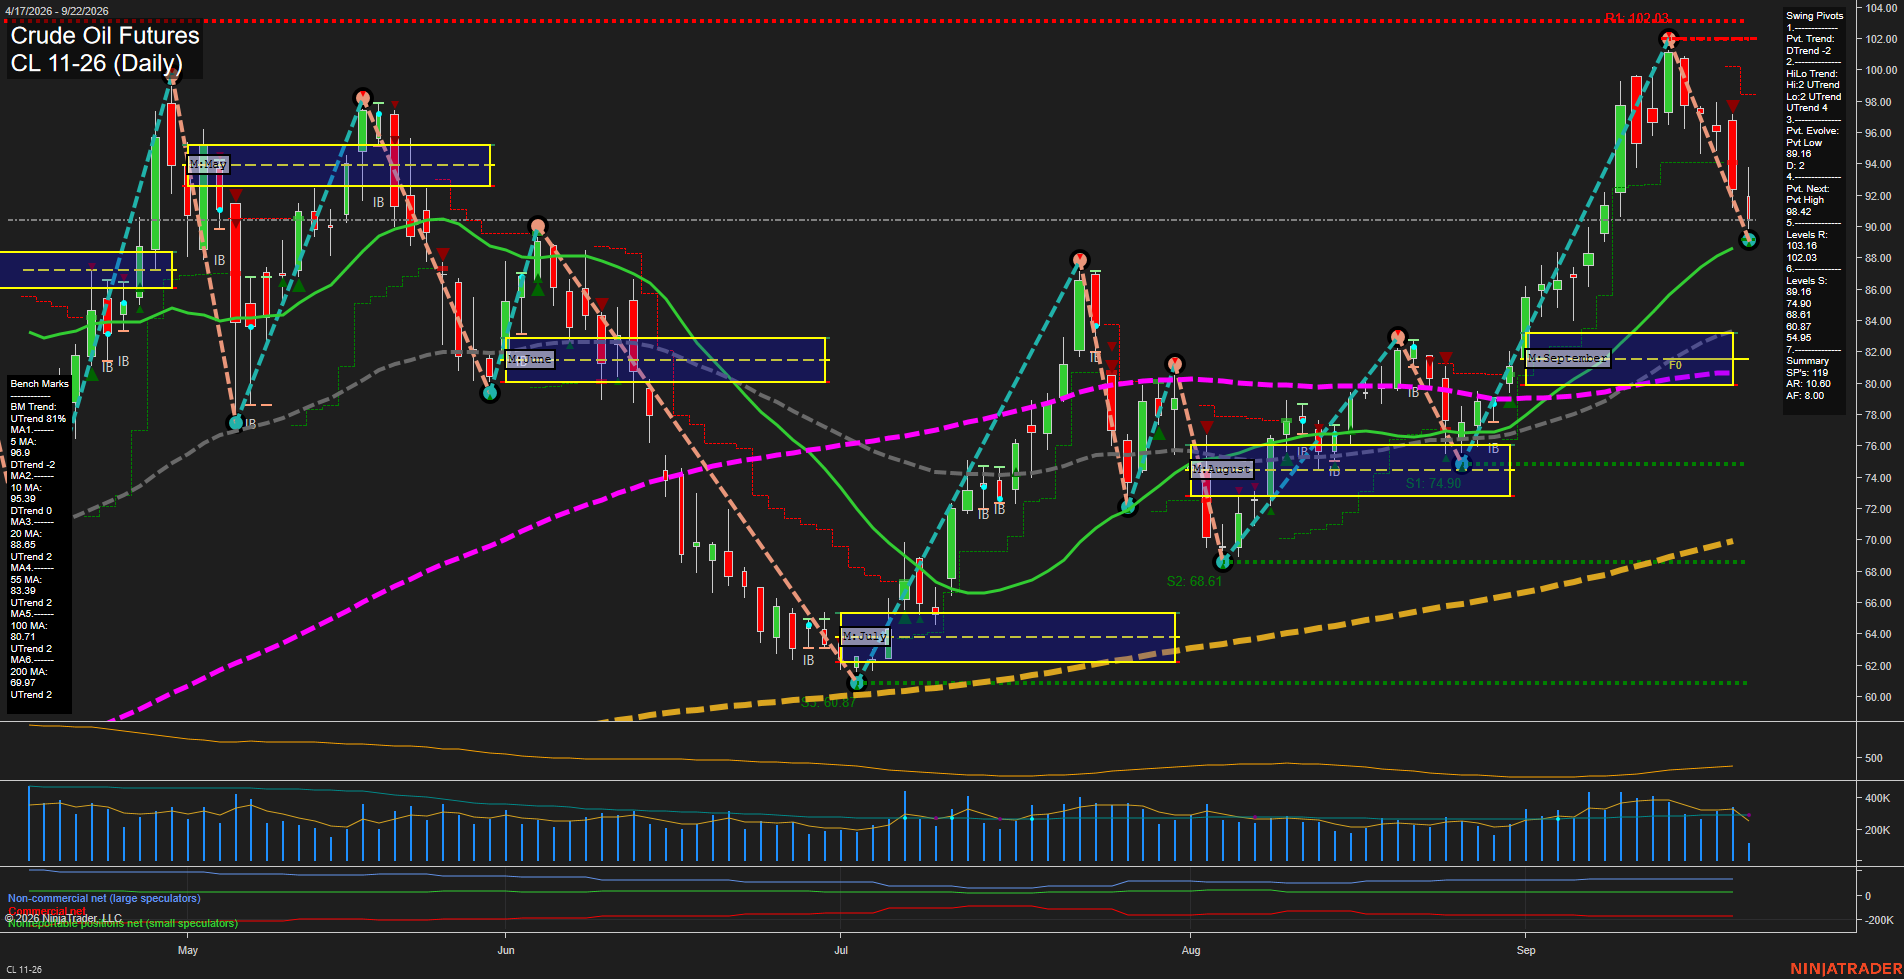
Overall Rating
- Short-Term: Bearish
- Intermediate-Term: Bullish
- Long-Term: Bullish.
Key Insights Summary
Price has undergone a fast, large-range pullback from the 102.03 swing-high resistance area and has shifted the short-term pivot structure into DTrend. The decline has reached the 89.16 pivot-low area, while price remains above the rising 20, 55, 100, and 200-day benchmarks. This creates a bearish short-term countertrend within a still constructive intermediate- and long-term higher-low structure. The weekly grid remains below F0% and down, while the September monthly grid remains above F0% and up. Resistance is layered at 101.03 and 102.03; 89.16 is the immediate pivot support, followed by 74.90. Elevated momentum and the sharp retreat from the recent high indicate an active volatility phase rather than a mature low-volatility consolidation.
View charts on: AlphaWebTrader HTF Charts
GC Daily View
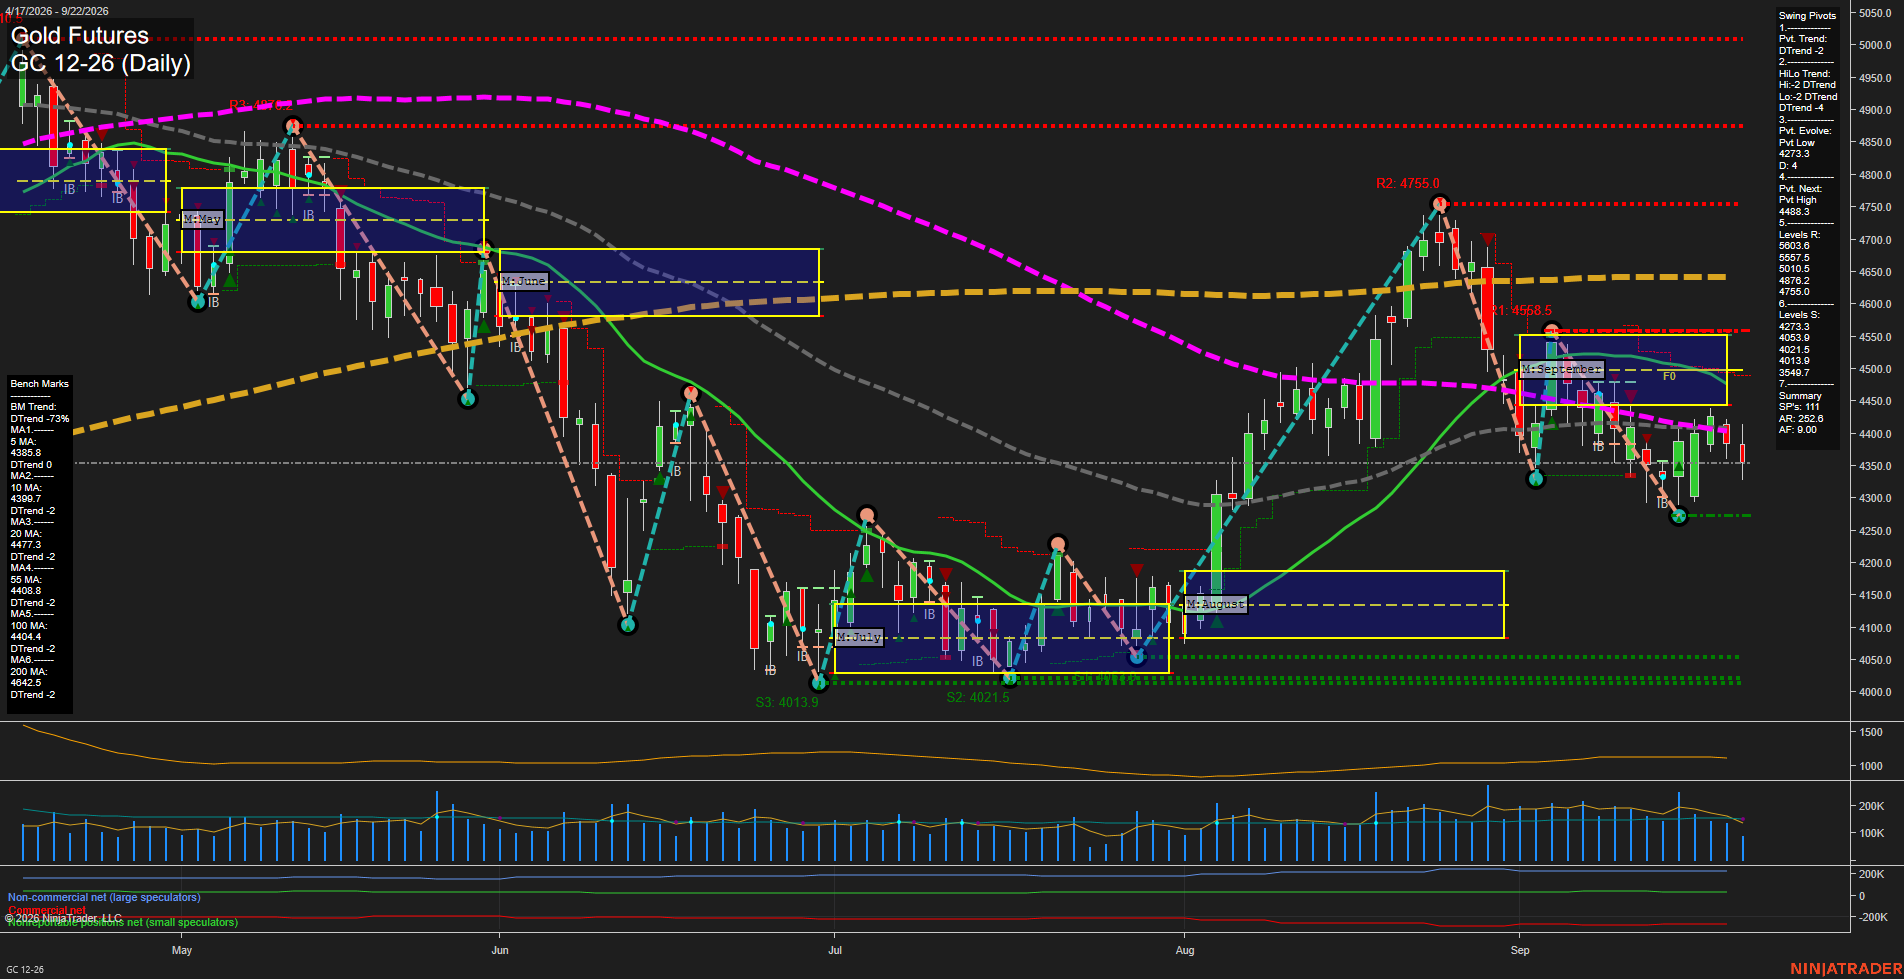
Overall Rating
- Short-Term: Bearish
- Intermediate-Term: Bearish
- Long-Term: Bearish.
Key Insights Summary
Gold remains in a broad bearish swing structure: price is below every benchmark average, below the weekly and monthly F0% levels, and both pivot-trend measures remain in DTrend. The rebound from the 4273.3 pivot low has not altered the lower-high sequence, with 4488.3 defining the next pivot-reversal threshold and the 4477.3 20-day average reinforcing overhead resistance. Price action is consolidating beneath clustered 5-, 10-, 55-, and 100-day averages near 4386 to 4408, while the recent short signals align with the prevailing downside cycle. Volatility remains elevated relative to the daily range structure, supporting medium-sized bars and choppy countertrend bounces within the broader decline.
View charts on: AlphaWebTrader HTF Charts
ZB Daily View
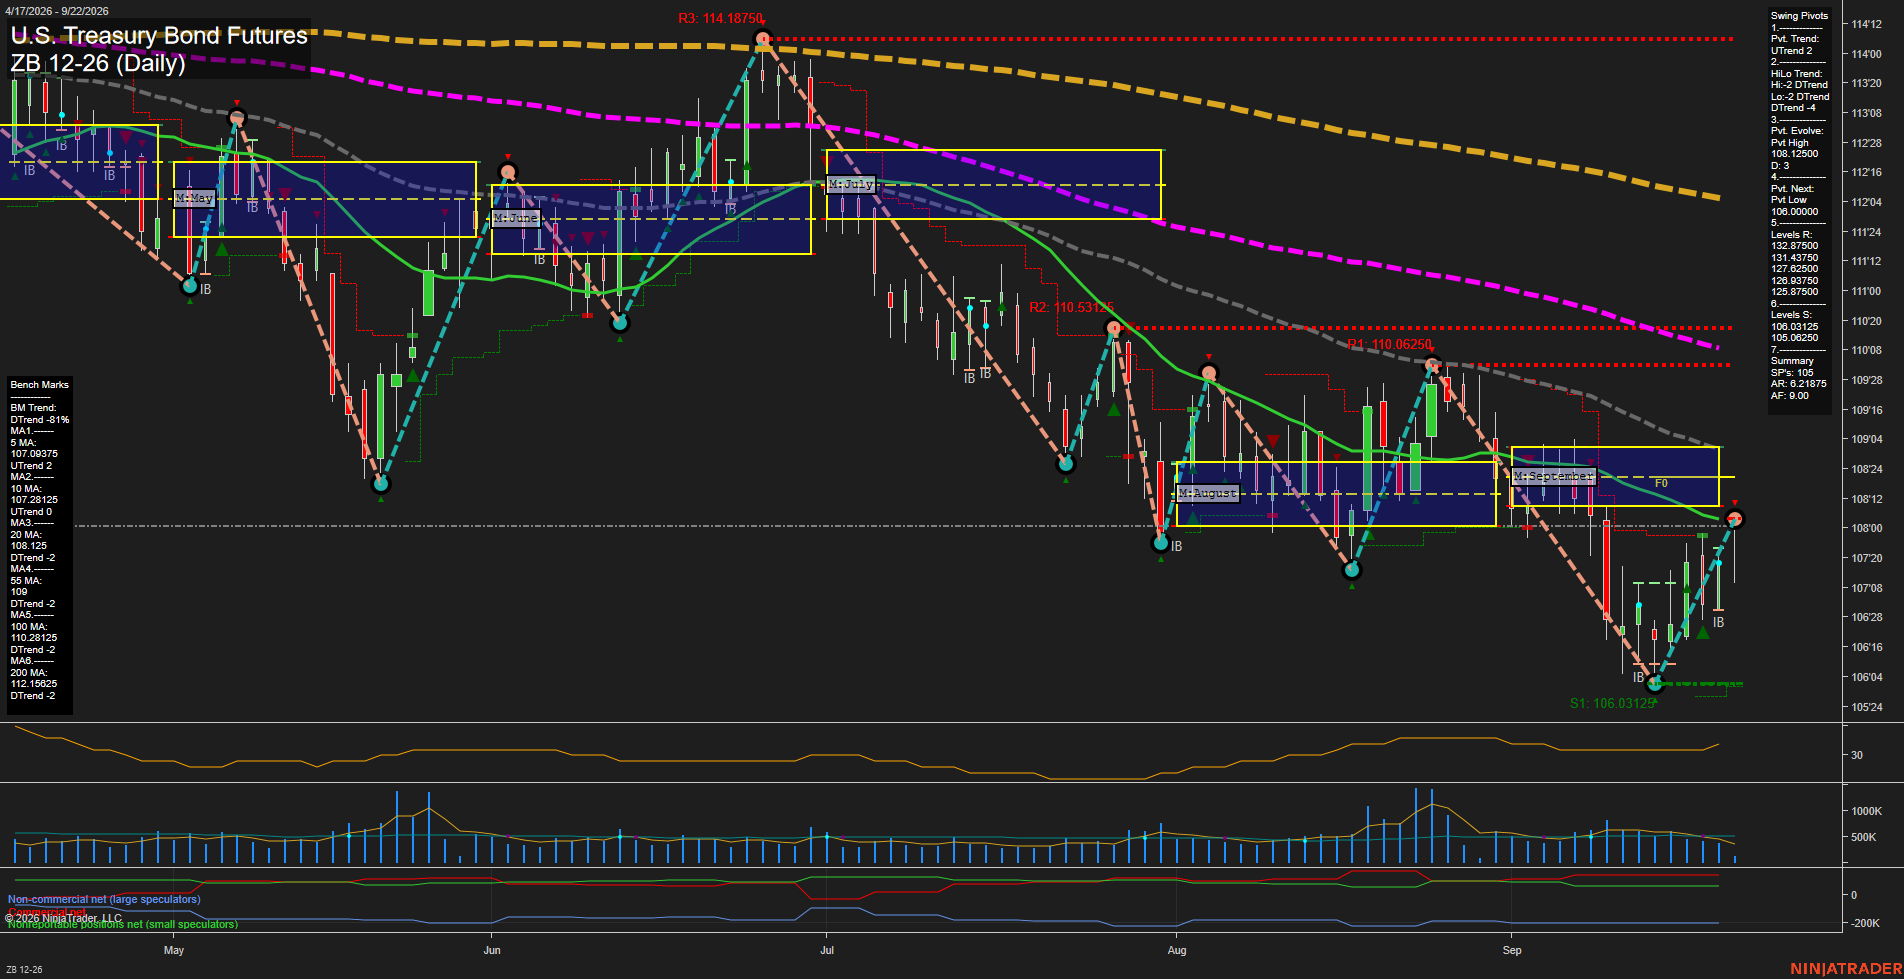
Overall Rating
- Short-Term: Bullish
- Intermediate-Term: Bearish
- Long-Term: Bearish.
Key Insights Summary
The daily chart shows a sharp short-term V-style rebound from the 106.03125 swing-support area, with price recovering above the rising 5-day and 10-day benchmarks and the pivot trend turning UTrend. The rebound remains countertrend within the broader structure: the HiLo trend is DTrend, price remains beneath the declining 20-day through 200-day benchmarks, and September MSFG positioning is below its F0/NTZ area. The 108.12500 20-day average is the immediate overhead technical pivot; the 106.03125 support remains the defining lower swing level. Rising momentum and medium-sized bars reflect an active recovery phase, while the descending intermediate- and long-term average alignment continues to characterize the larger daily cycle as bearish.
View charts on: AlphaWebTrader HTF Charts