U.S. index futures rise on AI optimism and easing Treasury pressure as ES and NQ hold bullish trends, while broader risks and corrective signals persist.
Fundamentals: U.S. index futures moved higher ahead of the NYSE open, led by AI optimism as Treasury selling eased and oil pulled back on reports of Iran diplomacy. The market remained constrained by yields above 5%, persistent energy-logistics disruptions, tighter-for-longer Fed pricing and weak internal breadth. Revised UoM consumer sentiment and inflation expectations are due at 10:00 a.m. ET.
Technicals: The pre-market technical picture is split across major futures. ES and NQ retain bullish alignment on daily and weekly charts, though both are consolidating near pivot resistance after sharp rebounds. YM, EMD, RTY and FDAX remain under short-term corrective pressure, with prices testing or approaching key pivot-support areas. In prior-session ETFs, META, USO and GOOG gained, while MSFT, TSLA and TLT declined.
Pre-Market Trading 360° view Market Radar of: holidays, earnings, eco-news, market-news summary, news sentiment, prior session major ETFs, MAG7, Higher Time Frame Analysis Indices Futures Summary, and E-mini S&P500, Nasdaq 100, NYMEX Crude, Gold Futures Daily Chart analysis.
As of: September 25, 2026 07:16 CT
Earnings Radar
Monitoring for earnings releases by the Magnificent 7, AI-tech-related firms, and major financial institutions.
- MU Release: 2026-09-30 T:AMC
Conclusion: Micron (MU) reports after the close on September 30, placing a major semiconductor and AI-memory earnings event on the near-term calendar for index futures. Market momentum and volume can slow ahead of major earnings releases, especially MAG7, AI, semiconductors, and related tech names.
For full details visit: Yahoo Earnings Calendar
EcoNews Radar U.S. Events
| Day | Time | Impact | Event |
|---|---|---|---|
| Fri | 10:00 | Medium | Revised UoM Consumer Sentiment |
| Fri | 10:00 | Medium | Revised UoM Inflation Expectations |
EcoNews Summary
No qualifying high-impact EcoNews events are listed. The listed medium-impact consumer sentiment and inflation-expectations releases are not directly related to oil, crude inventories, energy prices, or petroleum supply, so they are excluded.
Event Notes:
- No qualifying events listed.
Conclusion:
No qualifying high-impact EcoNews events are listed for the week. Friday is the only listed event day, but neither listed release qualifies under the energy-related medium-impact criteria.
For full details visit: Forex Factory EcoNews
Market News Summary:
Index futures advanced as AI optimism and easing bond-market pressure offset persistent energy, inflation, and geopolitical concerns.
Primary Drivers & Risks:
- Primary Driver: AI optimism and firmer futures
- Primary Risk: Elevated yields and oil disruption
Tone:
Cautiously constructive, with significant cross-currents.
Stock Market / ETFs / Indices:
Nasdaq 100 futures rose about 0.4%, while S&P 500 and Dow futures added roughly 0.3%, led by renewed AI optimism. Japanese equities gained 0.5% with bank stocks supported by higher long-term U.S. Treasury yields. Beneath resilient headline indices, breadth remained weak, with a high share of S&P 500 constituents trading below the index trend and more NYSE new lows than highs.
Geopolitical:
U.S.-Iran negotiators were reported to be exploring a phased arrangement tied to reopening the Strait of Hormuz. Conflict-related disruption remains substantial, with roughly one-quarter of globally seaborne oil through the strait affected and attacks on Saudi Arabia reinforcing regional supply-security concerns.
Oil / Energy:
Oil retreated as diplomatic headlines raised hopes of restored Hormuz navigation, though prices remained elevated after sharp gains. Saudi export diversions and Gulf of Oman transfer constraints point to stressed regional logistics. Discussion of a U.S. diesel export ban widened the discount of U.S. crude futures to Brent and raised concerns about refinery activity, domestic diesel pricing, and inflation pressure.
Gold / Metals:
Gold and silver remained pressured by a strong dollar, Treasury yields above 5%, and Fed rate-hike expectations. Silver rebounded as yields, the dollar, and crude eased, but the rate backdrop remained the central constraint.
Fed / Financials:
Treasury yields reached new highs before the bond selloff faded. Resilient U.S. activity, higher oil prices, and inflation concerns reinforced tighter-for-longer Fed pricing, while the yield move supported Japanese financial stocks. AI-driven growth has remained resilient despite higher borrowing costs, adding pressure to bond markets.
Macro / Other:
Stagflation risk remained in focus despite no significant economic slowdown. Diesel-price pressures and a depleted Strategic Petroleum Reserve were cited as vulnerabilities during a future energy supply shock.
Conclusion:
Equity futures were supported by AI-related optimism and stabilization in Treasuries after a sharp yield rise. Oil’s pullback on Iran diplomacy also eased immediate pressure on risk assets.
High yields, energy-market disruption, diesel export-ban discussion, and weak underlying equity breadth remain key cross-currents. Persistent oil-related inflation pressure continues to reinforce tighter Fed expectations.
Market News Sentiment
Market News Articles: 37
- Neutral: 43.24%
- Negative: 37.84%
- Positive: 18.92%
Sentiment Summary: Among 37 market news articles, sentiment was 43% neutral, 38% negative, and 19% positive, indicating neutral-to-negative news tone.
Conclusion: Indices futures day traders face a news backdrop with limited positive coverage and a modest negative tilt.
GLD,Gold Articles: 11
- Negative: 72.73%
- Neutral: 18.18%
- Positive: 9.09%
Sentiment Summary: GLD/Gold coverage is predominantly negative, with 73% negative, 18% neutral, and 9% positive articles across 11 articles.
Conclusion: The gold-news tone is negative, indicating limited positive sentiment in this snapshot for indices futures day traders.
USO,Oil Articles: 11
- Negative: 45.45%
- Neutral: 36.36%
- Positive: 18.18%
Sentiment Summary: USO and oil coverage is predominantly negative at 45%, with 36% neutral and 18% positive across 11 articles.
Conclusion: The news tone for oil-related markets is negative overall, with limited positive coverage.
Market Data Snapshot
ETF Snapshot of major stock market ETFs, Mag7, and others as of: September 25, 2026 07:16
Top Movers & Losers
- META 777.59 Bullish 4.50% ▲
- USO 153.09 Bullish 2.86% ▲
- GOOG 339.01 Bullish 1.20% ▲
- MSFT 497.93 Bearish -0.53% ▼
- TSLA 377.94 Bearish -0.57% ▼
- TLT 79.42 Bearish -1.29% ▼
Major Index ETFs: SPY, QQQ, DIA, IWM, IJH
- QQQ 741.10 Bearish -0.01% ▼
- SPY 767.18 Bearish -0.08% ▼
- IWM 281.66 Bearish -0.09% ▼
- DIA 512.68 Bearish -0.32% ▼
- IJH 72.73 Bearish -0.41% ▼
Major index ETFs are Bearish, with IJH the most bearish mover at -0.41% and DIA down -0.32%. IWM was marginally lower at -0.09%, SPY declined -0.08%, and QQQ was the least negative mover, near-flat at -0.01%.
Mag 7 Stocks: AAPL, MSFT, GOOG, AMZN, META, NVDA, TSLA
- META 777.59 Bullish 4.50% ▲
- GOOG 339.01 Bullish 1.20% ▲
- AMZN 249.38 Bullish 0.04% ▲
- AAPL 335.92 Bearish -0.33% ▼
- NVDA 224.58 Bearish -0.41% ▼
- MSFT 497.93 Bearish -0.53% ▼
- TSLA 377.94 Bearish -0.57% ▼
Mixed Mag7 snapshot: META is the most bullish mover at +4.50%, followed by GOOG at +1.20%; AMZN is marginally Bullish at +0.04%. TSLA is the most bearish mover at -0.57%, with MSFT at -0.53%, NVDA at -0.41%, and AAPL at -0.33%.
Cross-Market ETFs: TLT, GLD, USO, IBIT
- USO 153.09 Bullish 2.86% ▲
- IBIT 47.81 Bearish -0.15% ▼
- GLD 391.69 Bearish -0.30% ▼
- TLT 79.42 Bearish -1.29% ▼
Other ETFs are Mixed: USO is the most bullish mover at +2.86%, while TLT is the most bearish mover at -1.29%. GLD is Bearish at -0.30%, and IBIT is marginally Bearish at -0.15%.
ETF, Mag7, and Cross-Market ETF Insights
Overall Tone
Mixed tone: equity benchmarks were marginally Bearish while META and GOOG were Bullish, and USO strength contrasted with pronounced Bearish pressure in TLT.
Equity ETFs and Mag7:
Major Index ETFs were broadly but modestly Bearish: QQQ was near-flat at -0.01%, followed by SPY at -0.08%, IWM at -0.09%, DIA at -0.32%, and IJH at -0.41%. Mag7 performance was selective, led by META, the most bullish mover, at +4.50%, with GOOG up +1.20% and AMZN near-flat at +0.04%; TSLA was the most bearish Mag7 mover at -0.57%, followed by MSFT at -0.53%. Equity performance was selective rather than broadly aligned, with Mega-cap leadership offsetting mild Bearish index ETF moves.
Cross-Market ETFs:
Cross-market ETFs were Mixed: USO was the most bullish mover at +2.86%, while IBIT was marginally Bearish at -0.15% and GLD declined -0.30%. TLT was the most bearish cross-market mover and the broad snapshot’s most bearish mover at -1.29%, creating divergence against USO strength and modestly Bearish equity ETFs.
Futures Indices – Higher Time Frame Analysis
Summary of the current state of US Indices Futures based on higher time-frame (HTF) technical analysis as of: 2026-09-25: 07:16 CT.
US Indices Futures
- ES: Bullish YSFG/MSFG/WSFG, above rising benchmarks; 7906.25 resistance, 7550.25 pivot support; higher-high/higher-low pivots.
- NQ: Bullish YSFG/MSFG/WSFG, above benchmarks; 31094.75–31389.25 resistance, 30223.00 pivot support; higher-low structure.
- YM: Bearish WSFG/MSFG, bullish YSFG; below 5–100 benchmarks, 51479 support, 52849 resistance; DTrend correction.
- EMD: Bearish MSFG and daily benchmarks, bullish YSFG; 3635.2/3617.1 support, 3725.2 reversal pivot; DTrend.
- RTY: Bearish WSFG/MSFG and short benchmarks, bullish YSFG; 2829.9 support, 2997.7 reversal pivot, 3101.8 resistance.
- FDAX: Bearish MSFG and short benchmarks, bullish YSFG; 25337 support, 25943/25990 resistance, 24897 deeper support.
Overall State
- Short-Term: Bearish
- Intermediate-Term: Bearish
- Long-Term: Bullish
Conclusion
ES and NQ retain aligned bullish YSFG, MSFG, WSFG, benchmark, and pivot structures while consolidating beneath pivot resistance. YM, EMD, RTY, and FDAX are in bearish short- and intermediate-term corrective swings, with price below short benchmarks and monthly Fib references. Yearly Fib-grid positioning and longer-term benchmark slopes remain broadly bullish across most contracts, framing the divergence between ES/NQ strength and corrective pressure in YM, EMD, RTY, and FDAX.
Note: Intra-day counter-trend pullbacks or retracements may occur, HTF is context for informational usage and market structure. Glossary: Session Fib Grids periods of YSFG:’Yearly’, MSFG:’Monthly’, WSFG:’Weekly’
For full details visit: AlphaWebTrader Technicals
ES Daily View
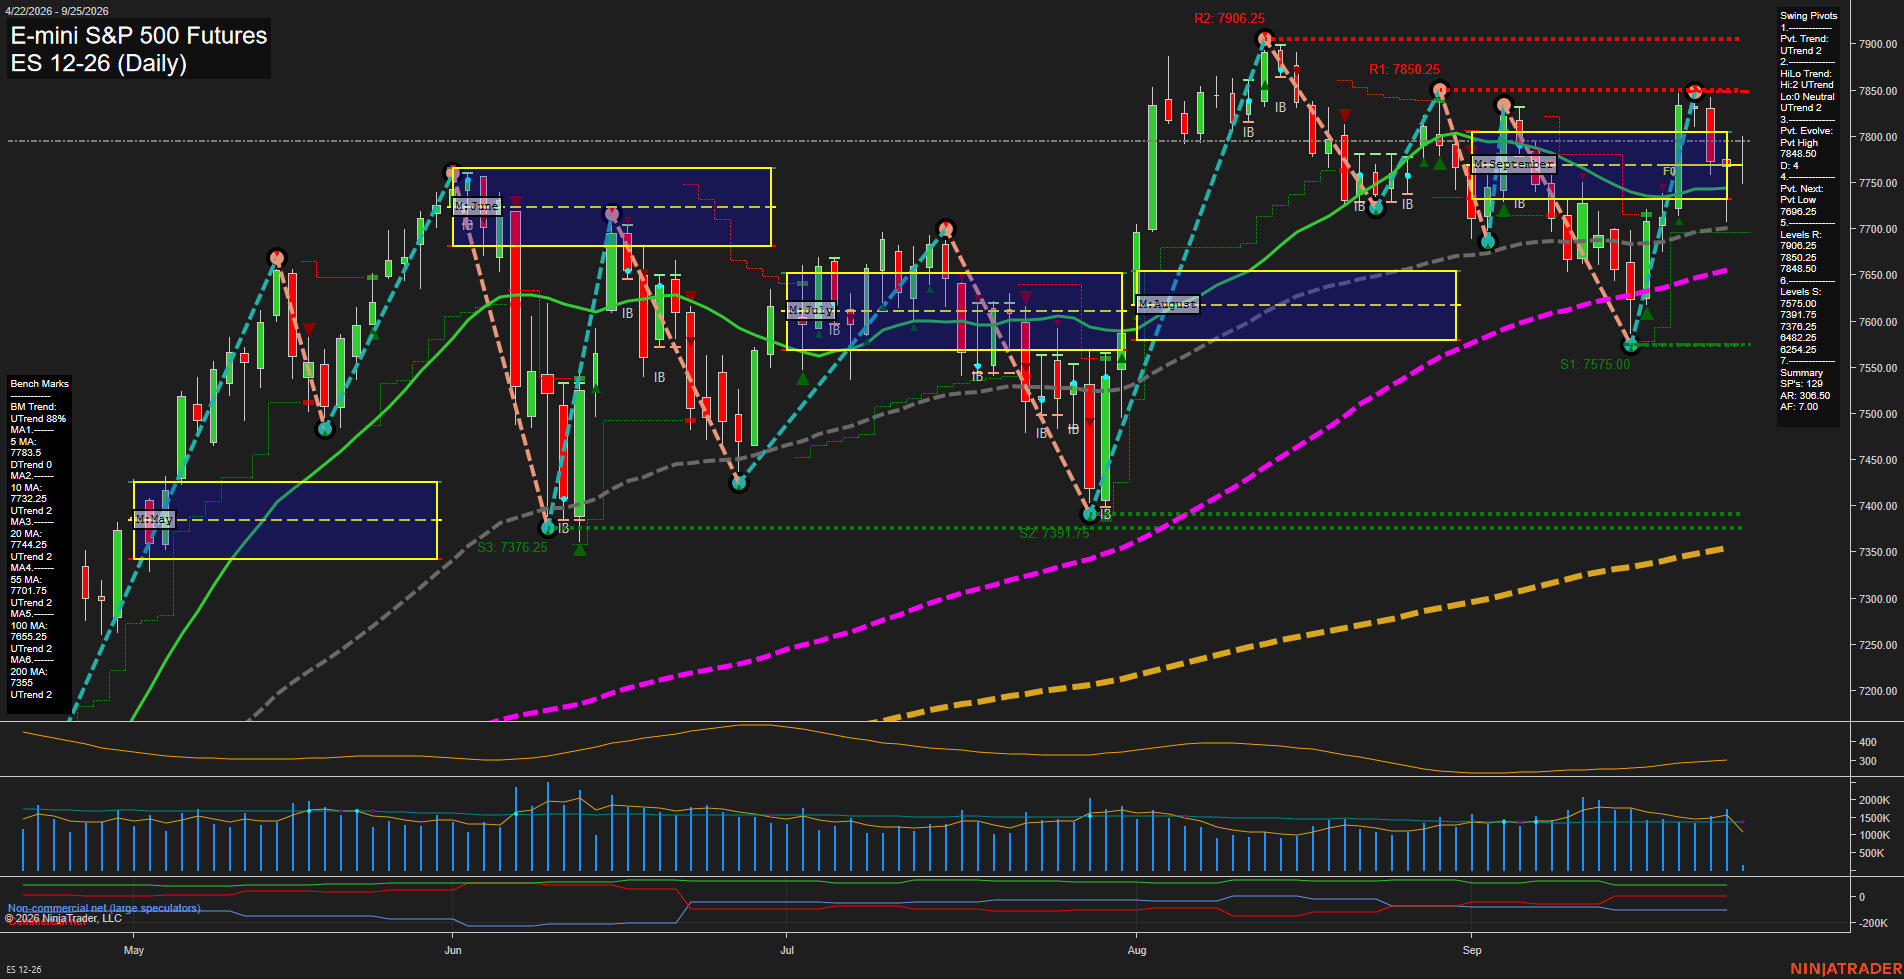
Overall Rating
- Short-Term: Bullish
- Intermediate-Term: Bullish
- Long-Term: Bullish.
Key Insights Summary
Price remains in a broad daily uptrend, supported by the positive weekly, monthly, yearly Fib-grid structures and the aligned 10, 20, 55, 100, and 200-day benchmark trends. The short-term structure is consolidating beneath the 7848.50 to 7850.25 pivot-resistance cluster after a sharp rebound from the 7575.00 support area. The 5-day average is flattening/down while price holds above the 10-day and 20-day averages, describing a near-term pause within a still constructive intermediate and long-term trend. Daily ATR near 306.50 reflects elevated swing range conditions, while recent long signals across the short, intermediate, and long-term systems confirm the prevailing upside directional regime.
View charts on: AlphaWebTrader HTF Charts
NQ Daily View
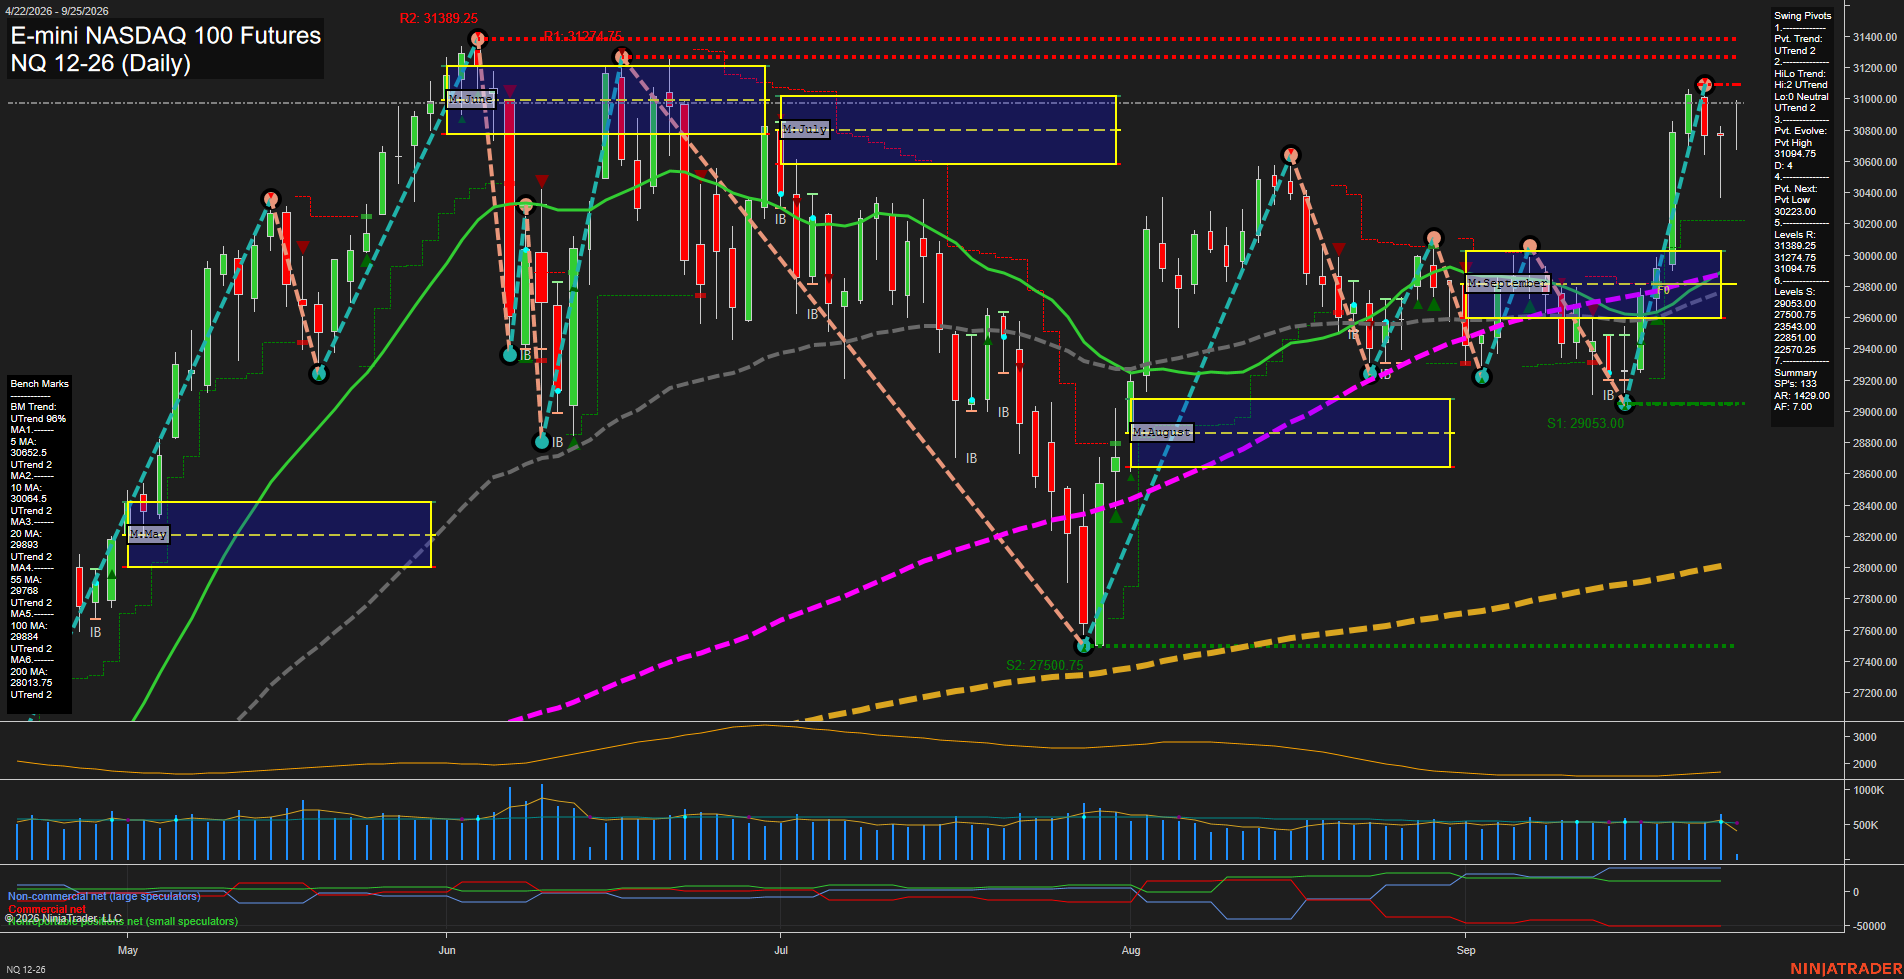
Overall Rating
- Short-Term: Bullish
- Intermediate-Term: Bullish
- Long-Term: Bullish.
Key Insights Summary
NQ has resumed a strong upside swing from the September pivot low, reclaiming all major daily benchmarks and advancing above the weekly and monthly fib-grid equilibrium areas. The pivot structure is aligned upward across short- and intermediate-term measures, with the current evolving pivot high at 31074.5 pressing into the 31094.75 to 31389.25 resistance band. Momentum is fast after the sharp V-shaped recovery, while the most recent smaller candles beneath resistance indicate a pause or consolidation following the breakout impulse. The 30223.00 pivot-next level is the defining short-term structural reference, with the 5-day and 10-day averages providing nearby rising trend support. Longer-term structure remains constructive as price holds materially above the rising 55-day, 100-day, and 200-day benchmarks.
View charts on: AlphaWebTrader HTF Charts
CL Daily View
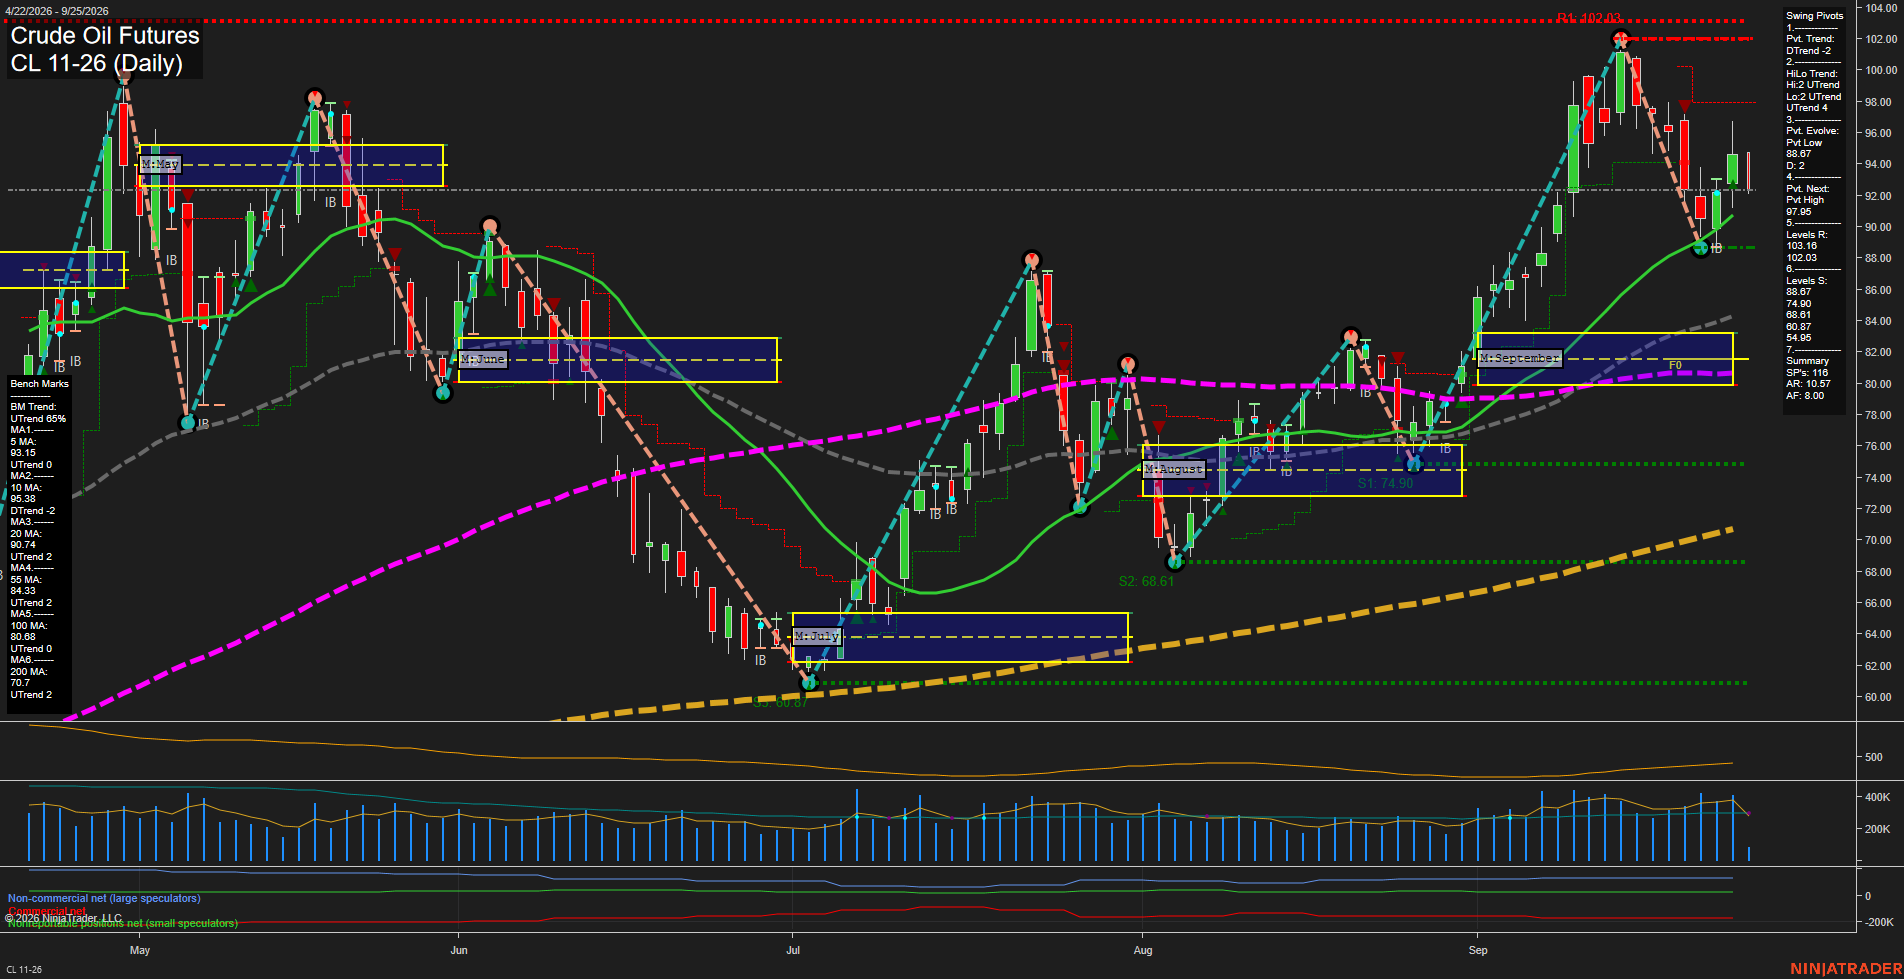
Overall Rating
- Short-Term: Bearish
- Intermediate-Term: Bullish
- Long-Term: Bullish.
Key Insights Summary
Crude is rebounding from the 88.67 swing-low area after a sharp pullback from the 102.03 high, but the short-term pivot structure remains in DTrend and price remains below the declining 10-day benchmark. The medium-term structure remains constructive, with price above rising 20-, 55-, 100-, and 200-day benchmarks, a bullish HiLo trend, and September MSFG holding above F0%. The 97.95 pivot-next level defines the nearby upside swing threshold, while 88.67 is the key pullback support; the broader structure remains a higher-low recovery within an established long-term uptrend.
View charts on: AlphaWebTrader HTF Charts
GC Daily View
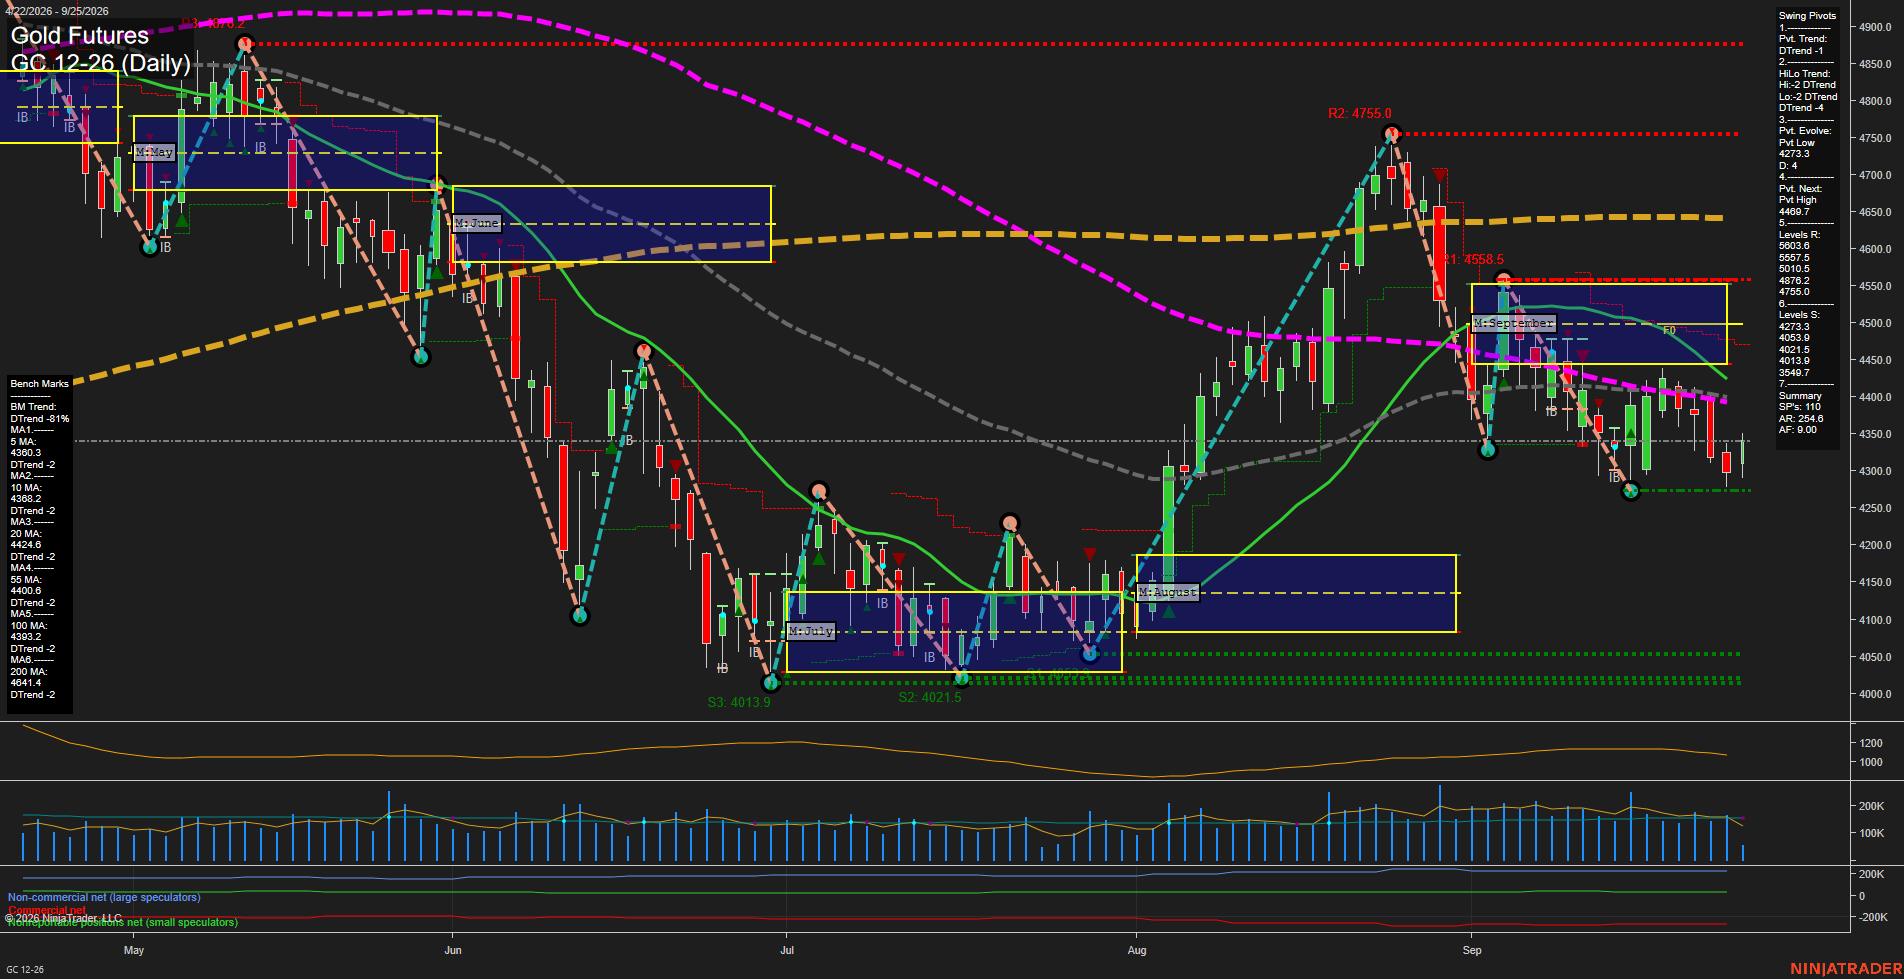
Overall Rating
- Short-Term: Bearish
- Intermediate-Term: Bearish
- Long-Term: Bearish.
Key Insights Summary
Price remains below the weekly, monthly, and yearly Fib-grid reference levels, while all six benchmark averages are declining and positioned above or near the market. The pivot structure remains DTrend across both short- and intermediate-term measures following the rejection from 4755.0. The recent decline has slowed into smaller, choppier bars around 4350, but price remains beneath the nearby 5-day, 10-day, 55-day, and 100-day benchmarks. The 4273.3 pivot low is the nearest defined downside structure, while 4489.7 is the next pivot-reversal threshold and aligns with a broader overhead resistance zone.
View charts on: AlphaWebTrader HTF Charts
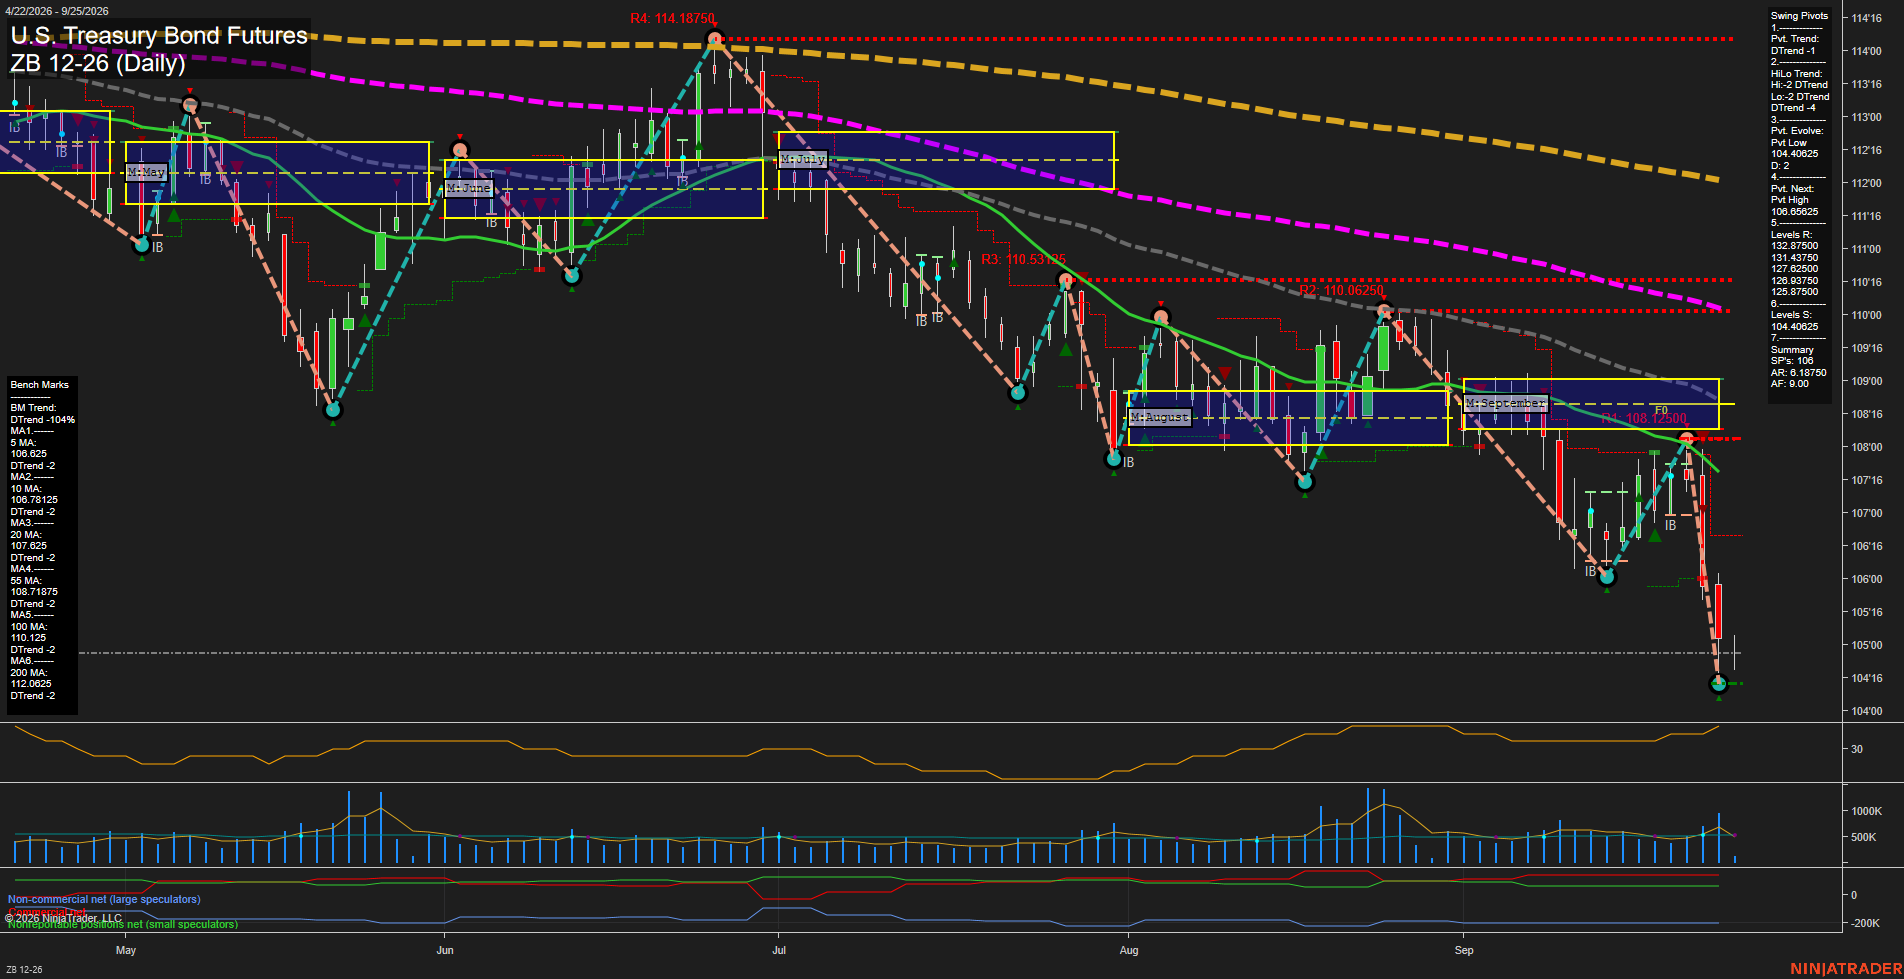
ZB Daily View
Overall Rating
- Short-Term: Bearish
- Intermediate-Term: Bearish
- Long-Term: Bearish.
Key Insights Summary
Price action is in a sharp downside continuation, with large-range bars accelerating beneath the September MSFG lower NTZ and its 108:12500 F0% reference. Both pivot structures are in DTrend, and price is materially below every daily benchmark; the declining 5-, 10-, 20-, 55-, 100-, and 200-day averages confirm broad multi-timeframe downside alignment. The latest pivot low near 104:18 is testing the 104.40625 support area after a steep selloff, while 106.05625 defines the nearest pivot-reversal threshold. Elevated directional momentum and expanding recent range behavior characterize the current move as impulsive rather than consolidative.
View charts on: AlphaWebTrader HTF Charts