U.S. stocks closed mixed as Iran deal headlines offset rising Treasury yields, oil gains and weak breadth, keeping rate-sensitive risks in focus.
Fundamentals: U.S. equity indexes ended mixed after reports of potential U.S.-Iran discussions on reopening the Strait of Hormuz supported an intraday rebound. The S&P 500 edged lower, the Nasdaq rose slightly and the Dow declined as the 10-year Treasury yield moved above 5%. Higher oil prices, weak market breadth, semiconductor valuations and rising mortgage rates remained key pressures.
Technicals: META, USO and GOOG led the featured ETF movers, while MSFT, TSLA and TLT declined. Futures analysis showed ES and NQ maintaining broadly bullish multi-timeframe structures near resistance, while YM, EMD, RTY and FDAX remained in short- and intermediate-term corrective downswings. Rising longer-term averages continued to support the broader trend backdrop.
After Market Close daily snapshot: market news summary and sentiment, major ETFs, Magnificent 7 analysis, Indices Futures Higher Time Frame Analysis, and E-mini S&P500, Nasdaq 100, NYMEX Crude, Gold Futures Daily Chart analysis.
As of: September 24, 2026 05:00 CT
Market News Summary:
Equity indexes finished mixed as easing geopolitical headlines offset pressure from surging Treasury yields, elevated oil prices, and weakening market breadth.
Primary Drivers & Risks:
- Primary Driver: U.S.-Iran deal headlines lift sentiment
- Primary Risk: Soaring yields and energy disruption
Tone:
Mixed and rate-sensitive, with geopolitical volatility.
Stock Market / ETFs / Indices:
Major indexes recovered from an early decline after reports of U.S.-Iran discussions on a phased deal to reopen the Strait of Hormuz, then closed near flat: the S&P 500 edged lower, the Nasdaq rose slightly, and the Dow lost 0.3%. Weak S&P 500 breadth, bearish technical commentary near record highs, and stretched semiconductor valuations remained equity headwinds. Everpure led S&P 500 gainers, while AI commentary emphasized diversification beyond hardware.
Geopolitical:
Reports of U.S.-Iran talks and a potential phased Hormuz reopening supported intraday risk sentiment, although separate coverage described stalled Hormuz talks. The Iran conflict continued to raise U.S. fuel-price concerns, while Saudi Red Sea tanker insurance costs tripled. U.S.-China discussions also focused on security and technology.
Oil / Energy:
Oil rallied after Houthi attacks on Saudi Arabia, while Iran indicated the Strait of Hormuz remained blocked pending changes to U.S. sanctions and the naval blockade. Saudi export logistics faced higher Red Sea insurance costs, adding supply-route strain. WTI technical commentary cited a bullish reversal following a move from $92.25.
Gold / Metals:
Gold, silver, and platinum faced pressure from multi-decade-high Treasury yields, a firmer dollar, and stronger oil prices. Gold lost its 50-day average and tested the $4,235–$4,241 support area, with $4,203 identified as the next cited downside level upon a break.
Fed / Financials:
The 10-year Treasury yield moved above 5%, reaching 5.15% in one report, while long-dated yields reached their highest levels in more than two decades. The Fed raised rates by 25 basis points, and market commentary highlighted increased pricing of further tightening, including discussion of a 50-basis-point hike risk. Mortgage rates rose to 7.03%, their highest reading since early 2025.
Macro / Other:
Upcoming PCE, manufacturing PMI, and employment data were identified as key early-October macro releases. Commentary linked rising short-term yields to robust GDP growth, low unemployment, and persistent fiscal deficits. AAII bullish sentiment rose to 32.7%, while neutral sentiment increased to 19.2%.
Conclusion:
Geopolitical headlines around Iran and Hormuz drove the intraday equity rebound. Treasury yields above 5% remained the dominant cross-asset constraint.
Oil strength and disrupted Saudi export routes added inflation and supply concerns. Narrowing equity breadth, elevated semiconductor valuations, and higher mortgage rates reinforced rate-sensitive market pressure.
Market News Sentiment
Market News Articles: 42
- Neutral: 50.00%
- Negative: 28.57%
- Positive: 21.43%
Sentiment Summary: Of 42 market news articles, 50% were neutral, 29% negative, and 21% positive, indicating predominantly neutral coverage with a negative tilt over positive items.
Conclusion: Indices futures day traders are facing a mixed news environment in which neutral reporting dominates and negative sentiment exceeds positive sentiment.
GLD,Gold Articles: 11
- Negative: 90.91%
- Positive: 9.09%
Sentiment Summary: Gold-related coverage is predominantly negative, with 91% negative and 9% positive articles across 11 items.
Conclusion: The gold news tone is strongly negative, indicating a risk-sensitive backdrop relevant to indices futures monitoring.
USO,Oil Articles: 7
- Negative: 71.43%
- Positive: 28.57%
Sentiment Summary: Oil-related coverage was predominantly negative, with 71% negative and 29% positive articles across seven reports.
Conclusion: The oil news tone was negative, which may be relevant to energy-sector and inflation-sensitive index futures sentiment.
Market Data Snapshot
ETF Snapshot of major stock market ETFs, Mag7, and others as of: September 24, 2026 05:00
Top Movers & Losers
- META 777.59 Bullish 4.50% ▲
- USO 153.09 Bullish 2.86% ▲
- GOOG 339.01 Bullish 1.20% ▲
- MSFT 497.93 Bearish -0.53% ▼
- TSLA 377.94 Bearish -0.57% ▼
- TLT 79.42 Bearish -1.29% ▼
Major Index ETFs: SPY, QQQ, DIA, IWM, IJH
- QQQ 741.10 Bearish -0.01% ▼
- SPY 767.18 Bearish -0.08% ▼
- IWM 281.66 Bearish -0.09% ▼
- DIA 512.68 Bearish -0.32% ▼
- IJH 72.73 Bearish -0.41% ▼
Major index ETFs were Bearish, with broad but modest declines. IJH led losses at -0.41%, followed by DIA at -0.32%. IWM was marginally Bearish at -0.09% and SPY near-flat Bearish at -0.08%. QQQ was the least negative mover, near-flat at -0.01%.
Mag 7 Stocks: AAPL, MSFT, GOOG, AMZN, META, NVDA, TSLA
- META 777.59 Bullish 4.50% ▲
- GOOG 339.01 Bullish 1.20% ▲
- AMZN 249.38 Bullish 0.04% ▲
- AAPL 335.92 Bearish -0.33% ▼
- NVDA 224.58 Bearish -0.41% ▼
- MSFT 497.93 Bearish -0.53% ▼
- TSLA 377.94 Bearish -0.57% ▼
Mixed Mag7 snapshot: META is the most bullish mover at +4.50%, followed by GOOG at +1.20%; AMZN is marginally Bullish at +0.04%. TSLA is the most bearish mover at -0.57%, with MSFT at -0.53%, NVDA at -0.41%, and AAPL at -0.33%.
Cross-Market ETFs: TLT, GLD, USO, IBIT
- USO 153.09 Bullish 2.86% ▲
- IBIT 47.81 Bearish -0.15% ▼
- GLD 391.69 Bearish -0.30% ▼
- TLT 79.42 Bearish -1.29% ▼
Mixed cross-market snapshot: USO is the most bullish mover at +2.86%. TLT is the most bearish mover at -1.29%, while GLD is lower at -0.30% and IBIT is marginally lower at -0.15%.
ETF, Mag7, and Cross-Market ETF Insights
Overall Tone
Mixed, with narrow equity ETF weakness alongside concentrated Bullish leadership in META and USO, while TLT showed notable Bearish pressure.
Equity ETFs and Mag7:
Major Index ETFs were broadly but modestly Bearish: QQQ was near-flat at -0.01%, SPY fell -0.08%, IWM declined -0.09%, DIA lost -0.32%, and IJH was down -0.41%. Mag7 performance was selective, led by META as the most bullish mover at +4.50%, followed by GOOG at +1.20%, while AMZN was near-flat at +0.04%. AAPL fell -0.33%, NVDA -0.41%, MSFT -0.53%, and TSLA was the most bearish mover at -0.57%.
Cross-Market ETFs:
Cross-market action was Mixed, with USO the most bullish mover at +2.86%, diverging positively from the modestly Bearish equity ETFs. IBIT declined -0.15% and GLD fell -0.30%, while TLT was the most bearish mover at -1.29%. The combination of USO strength and weakness in TLT, GLD, and IBIT reflected uneven cross-market participation.
Futures Indices – Higher Time Frame Analysis
Summary of the current state of US Indices Futures based on higher time-frame (HTF) technical analysis as of: 2026-09-24: 17:00 CT.
US Indices Futures
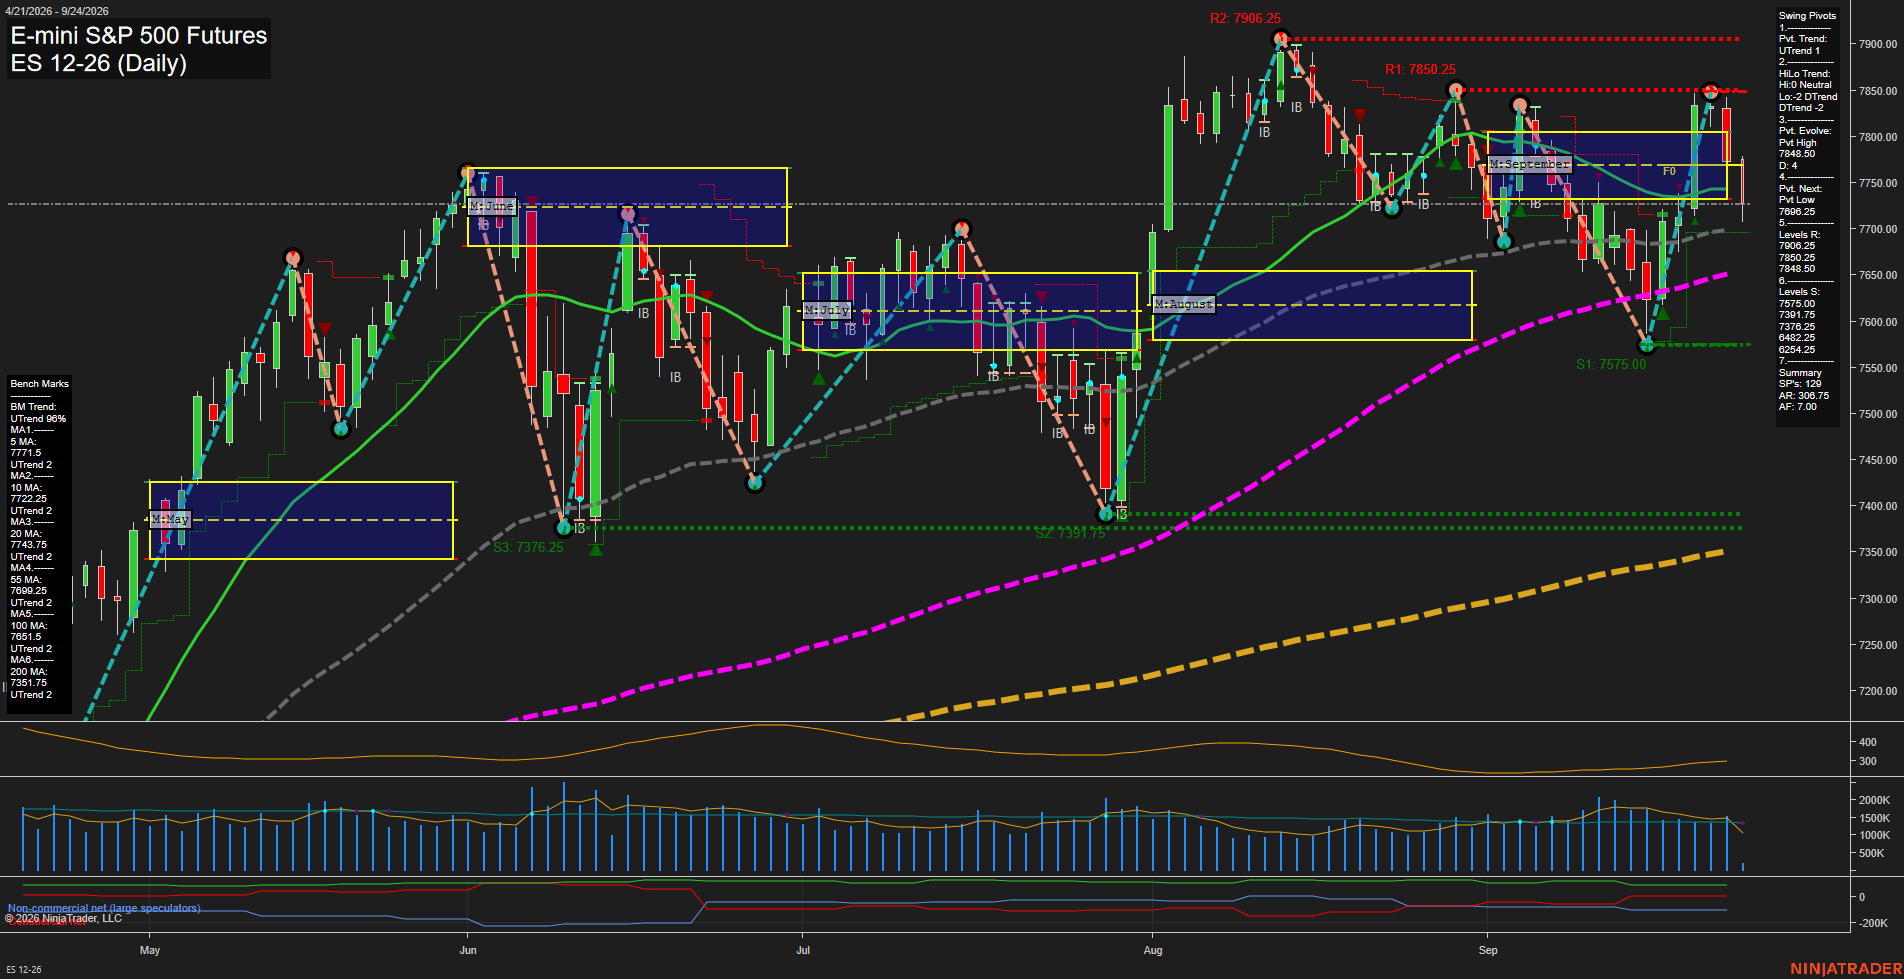
- ES: YSFG/MSFG/WSFG above F0%, above rising benchmarks, UTrend, support 7556.25, resistance 7906.25; weekly consolidation.
- NQ: YSFG/MSFG/WSFG above F0%, above rising benchmarks, higher lows from 28630.75, resistance 31094.75-31389.25; TR120 short signal.
- YM: YSFG structure bullish, MSFG/WSFG below F0%, below 5-20 benchmarks; support 51602, reversal 53974, resistance 55316.
- EMD: YSFG above F0%, MSFG/WSFG below F0%, DTrend, below 5-20 benchmarks; support 3636.2, then 3332.6, resistance 3834.6-3896.8.
- RTY: YSFG long-term structure intact, MSFG/WSFG below F0%, bearish pivots; support 2843.9 then 2770.7, resistance 2925.3-2931.2.
- FDAX: YSFG above F0%, MSFG below F0%, DTrend below 5-20 benchmarks; support 25337 then 24897, resistance 25941-25990 and 26715-26847.
Overall State
- Short-Term: Bearish
- Intermediate-Term: Bearish
- Long-Term: Bullish
Conclusion
NQ and ES retain the strongest HTF alignment, with NQ near upper pivot resistance and ES consolidating below 7906.25. YM, EMD, RTY, and FDAX remain in short-term corrective structures below MSFG/WSFG and short-term benchmarks. Across all contracts, YSFG conditions and rising long-term benchmarks retain a bullish longer-cycle correlation; key pivot supports define the current retracement structure.
Note: Intra-day counter-trend pullbacks or retracements may occur, HTF is context for informational usage and market structure. Glossary: Session Fib Grids periods of YSFG:’Yearly’, MSFG:’Monthly’, WSFG:’Weekly’
For full details visit: AlphaWebTrader Technicals
ES Daily View
View charts on: AlphaWebTrader HTF Charts
NQ Daily View
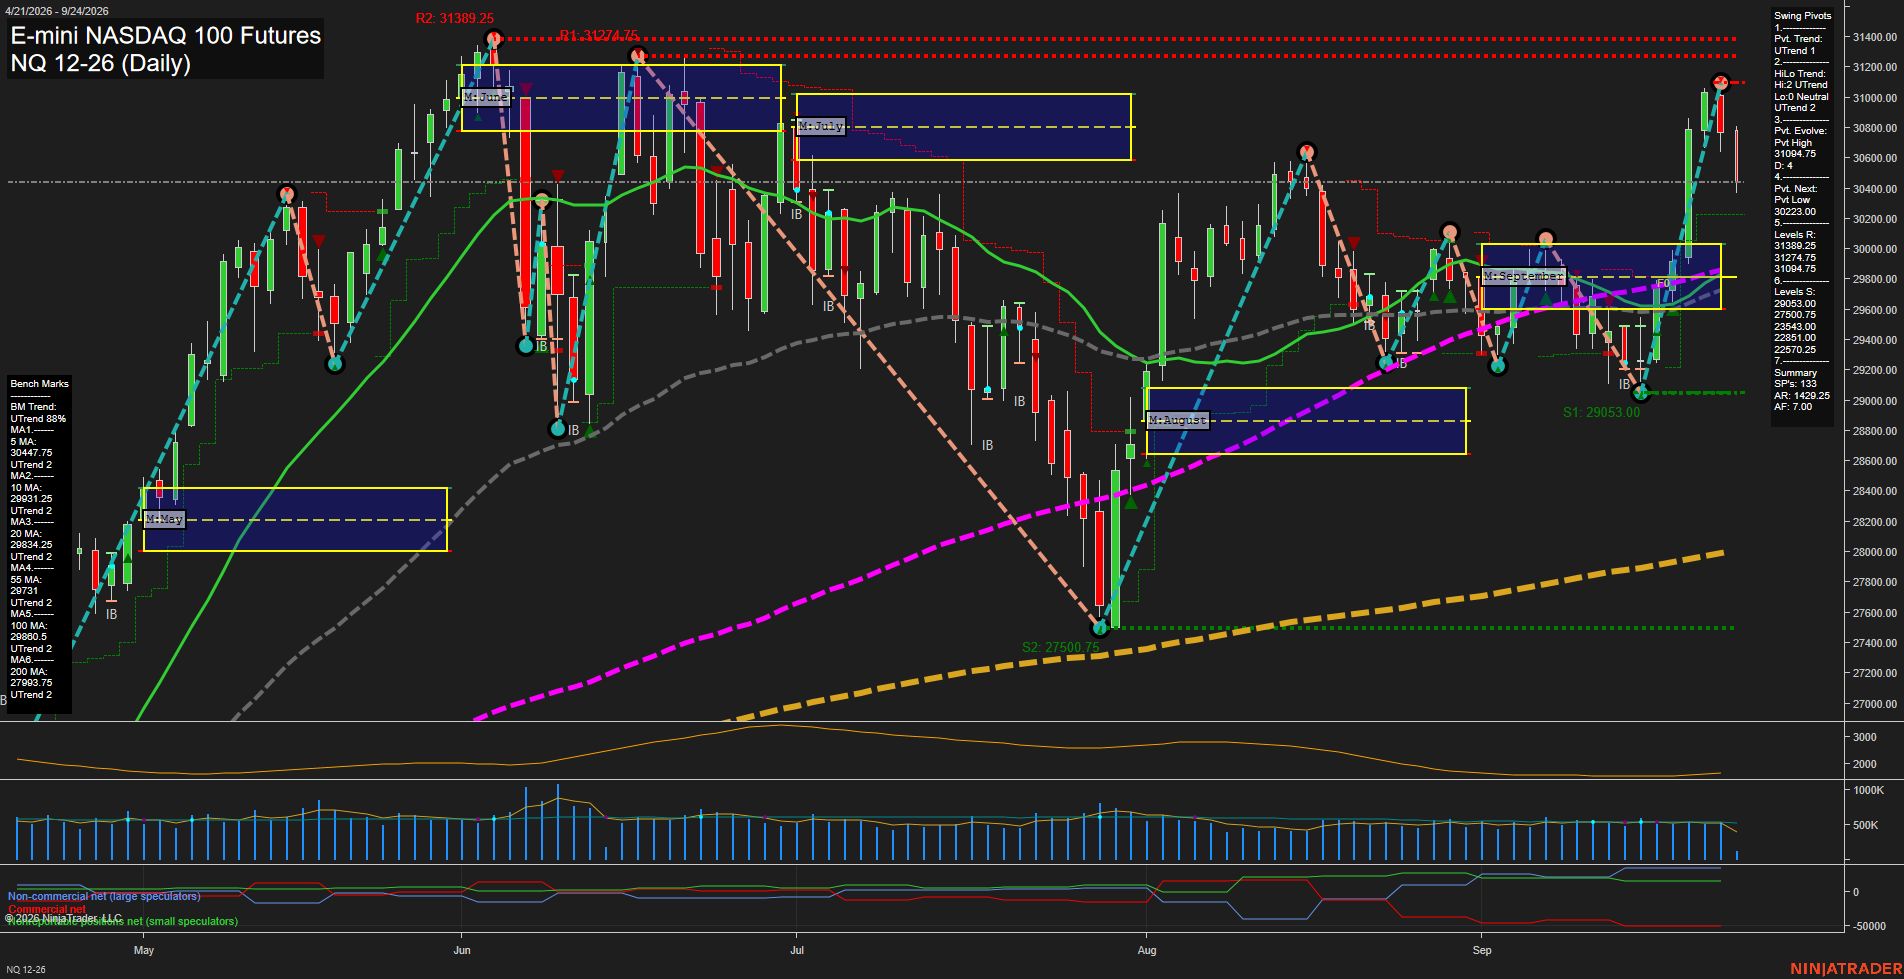
Overall Rating
- Short-Term: Bullish
- Intermediate-Term: Bullish
- Long-Term: Bullish.
Key Insights Summary
Price remains in a broad bullish swing structure, holding above the weekly, monthly, and yearly F0% levels while all benchmark averages retain upward trends. The advance into 31094.75 produced a short-term pivot high and a medium-sized pullback bar, reflecting rejection and consolidation beneath nearby resistance at 31094.75 through 31389.25. The 30223.00 pivot-next level defines the immediate short-term swing threshold, while the clustered 55-, 100-, and 20-day averages near 29731 to 29860 provide an important intermediate support zone. The recent structure remains characterized by higher lows from the August low, although fast momentum and elevated ATR conditions show that the current rally phase has become more volatile and two-sided near the upper range.
View charts on: AlphaWebTrader HTF Charts
CL Daily View
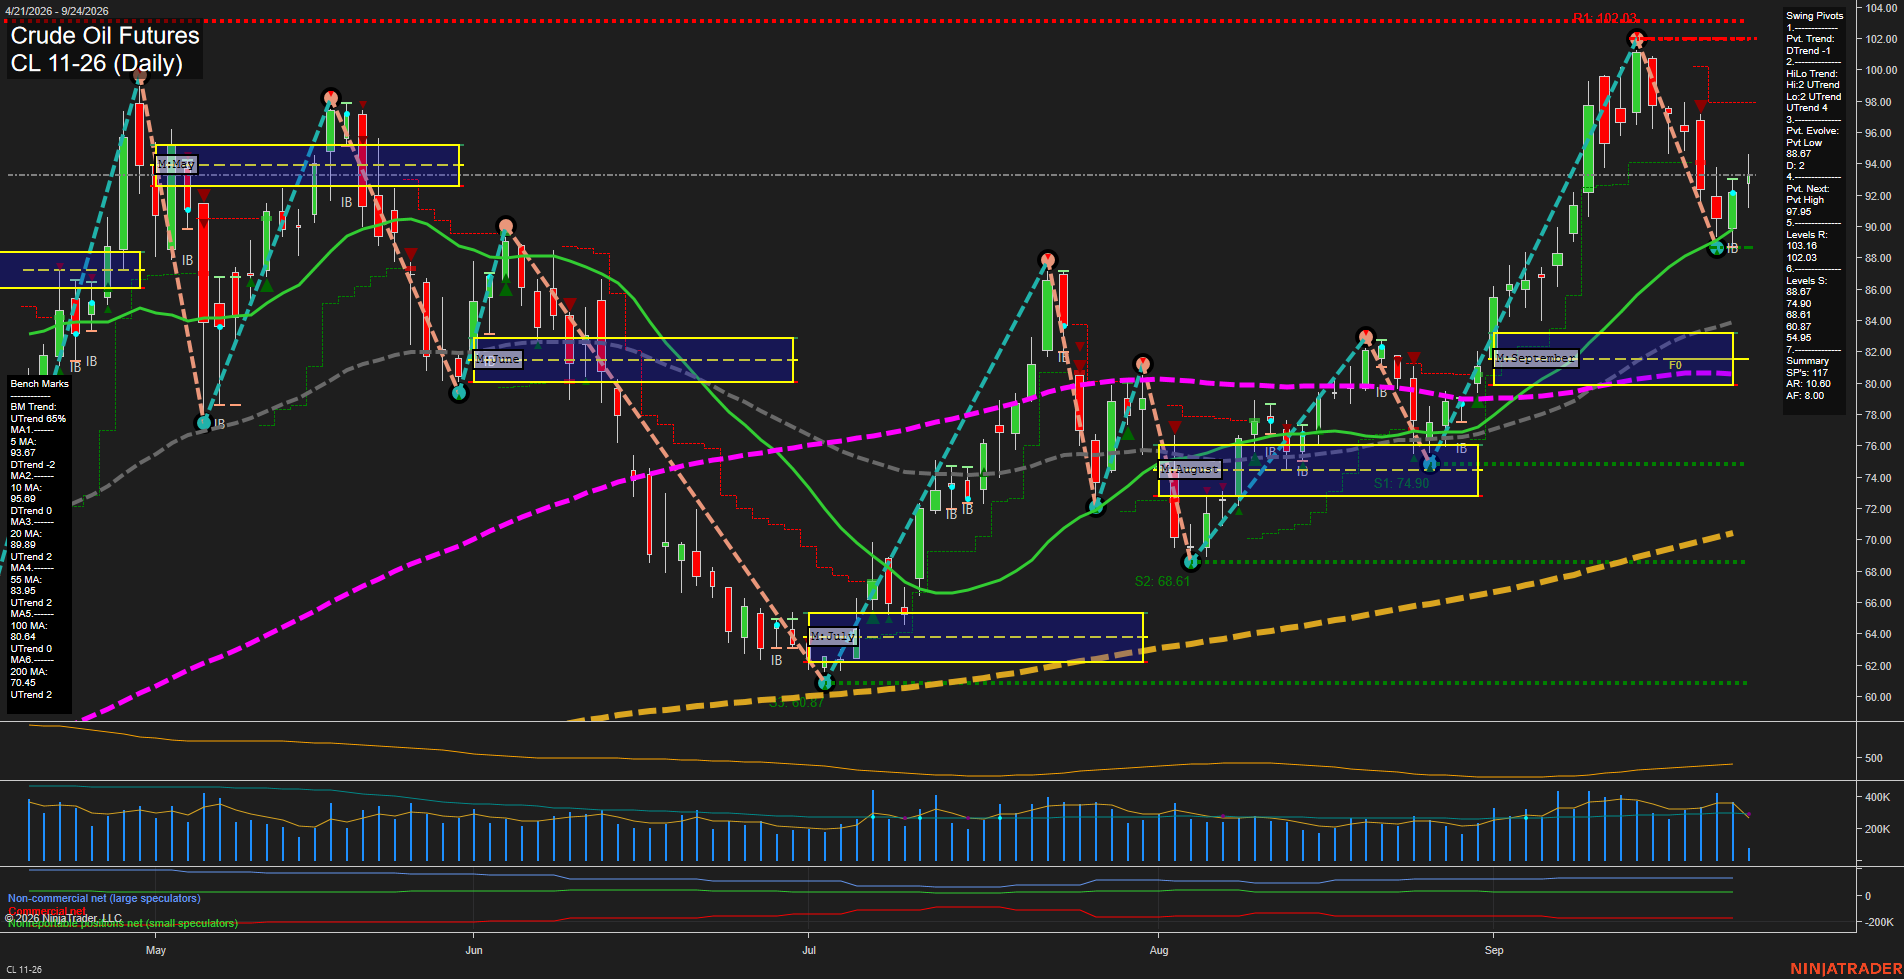
Overall Rating
- Short-Term: Bearish
- Intermediate-Term: Bullish
- Long-Term: Bullish.
Key Insights Summary
Price has produced a sharp rebound from the 88.67 pivot low, but the short-term pivot structure remains in DTrend and both the 5-day and 10-day benchmarks remain down. The recovery is occurring above the rising 20-day average and within an intact intermediate higher-low structure, while the monthly and yearly Fib-grid positions remain above their F0% levels. The 97.95 pivot threshold is the defining upside reversal level within the current pullback sequence, with 102.03 the major visible swing resistance. The recent selloff from the 102 area and fast rebound from 88.67 reflect elevated volatility and a broad consolidation within a still-positive intermediate and long-term trend framework.
View charts on: AlphaWebTrader HTF Charts
GC Daily View
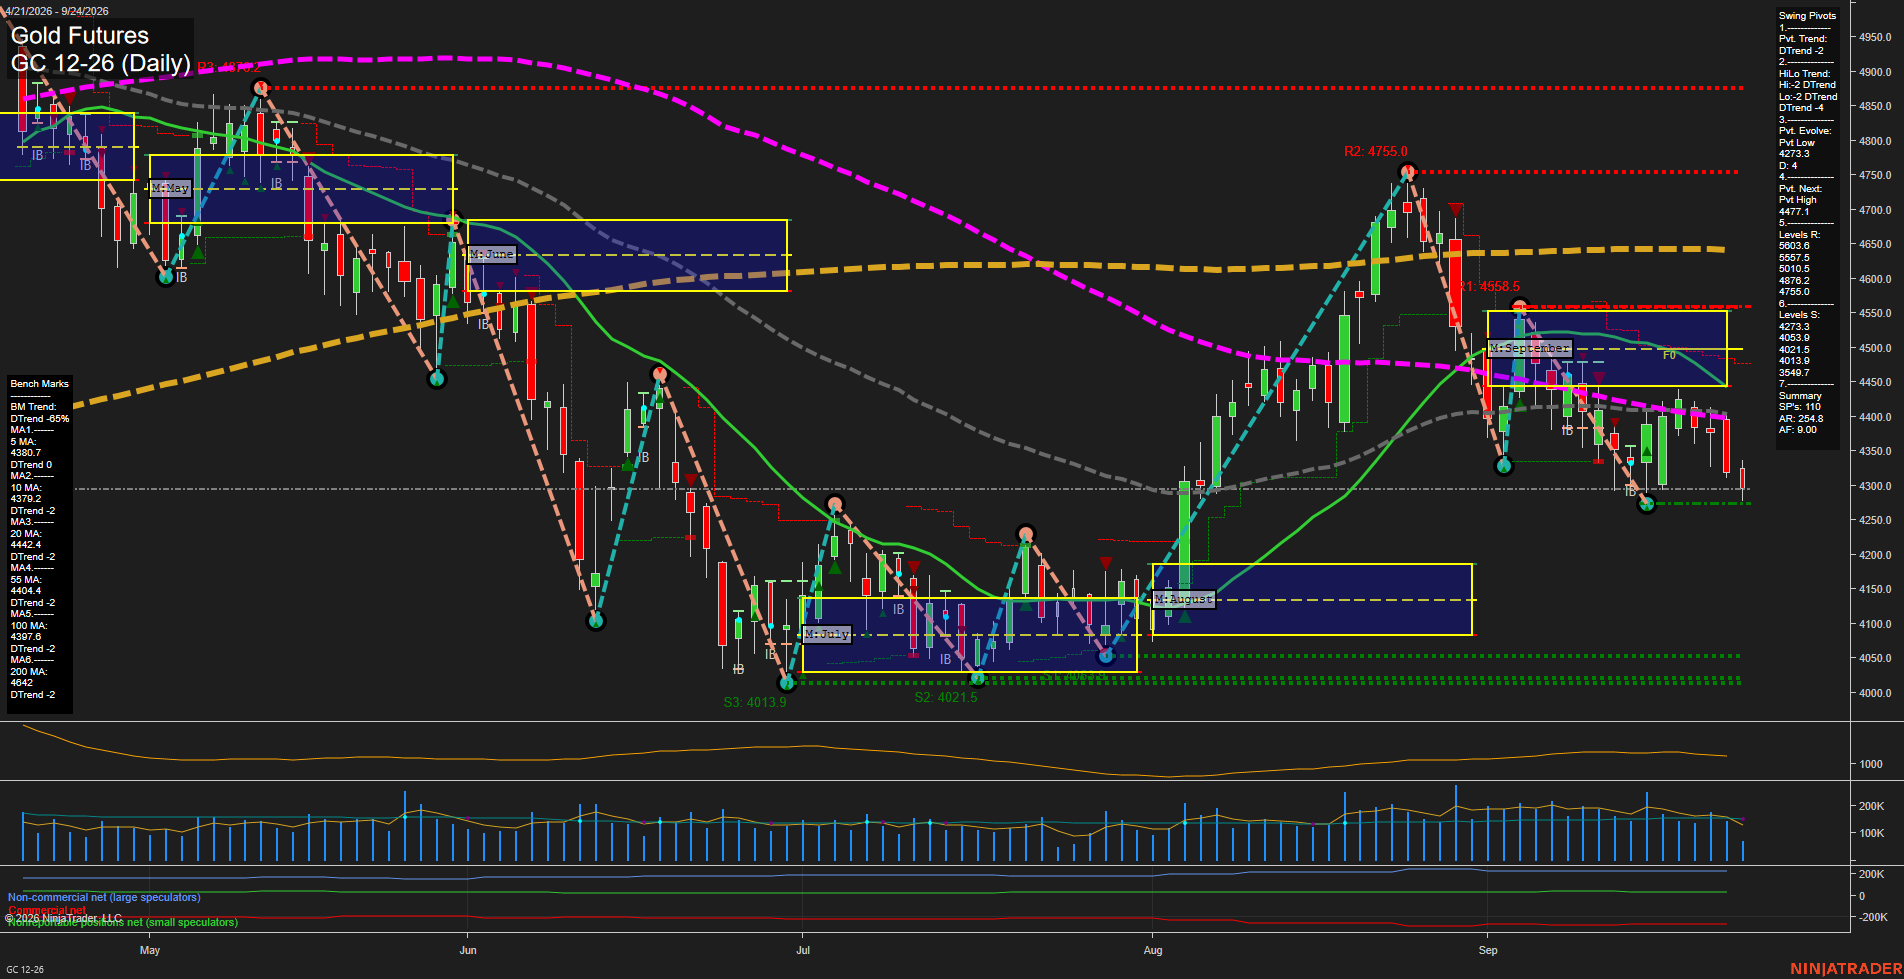
Overall Rating
- Short-Term: Bearish
- Intermediate-Term: Bearish
- Long-Term: Bearish.
Key Insights Summary
Gold futures remain in a broad corrective downswing, with price below the weekly, monthly, and yearly Fib-grid centers and beneath all six declining daily benchmarks. The short-term pivot trend and intermediate HiLo structure are both down, defined by lower highs from the 4755.0 swing resistance and a fresh pivot low near 4274.4. The recent decline has accelerated below the 5-day and 10-day averages, while 4442.4 to 4477.1 represents the nearest overhead retracement and pivot-reversal zone. The 4273.3 support area is the immediate structural test; lower supports cluster near 4053.9 through 4013.9. Elevated range conditions and declining momentum structure characterize the current swing cycle.
View charts on: AlphaWebTrader HTF Charts
ZB Daily View
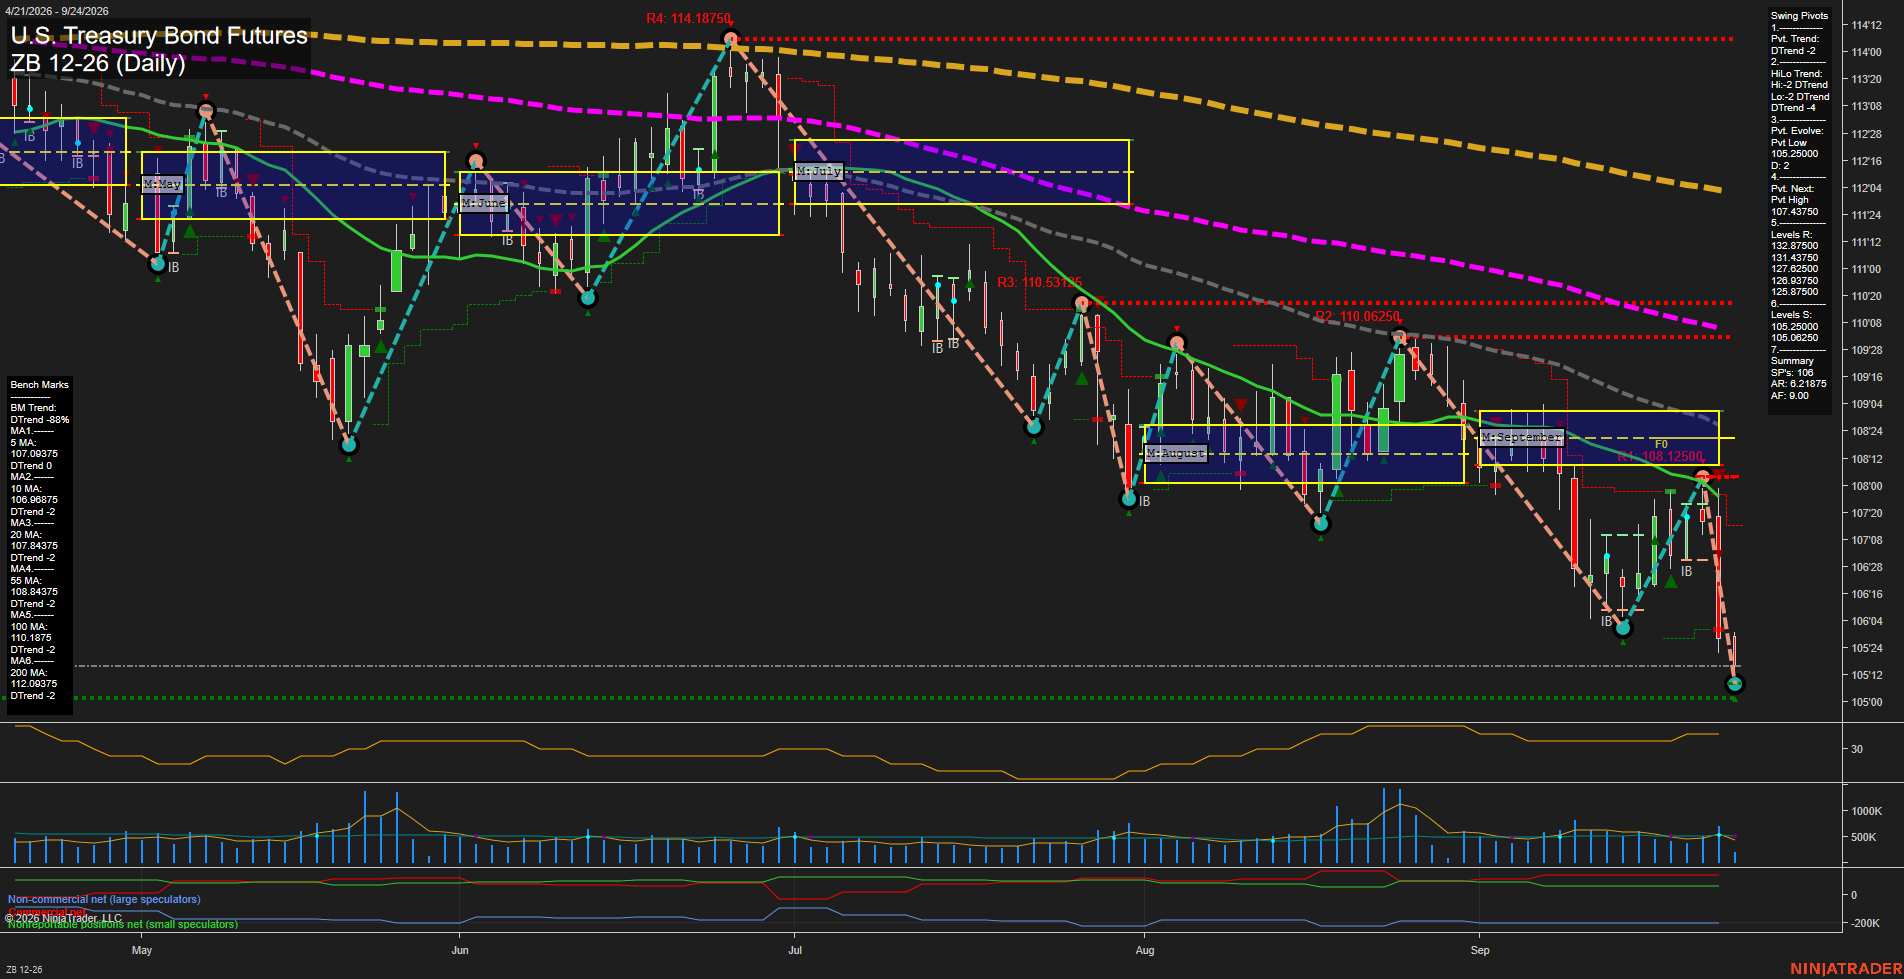
Overall Rating
- Short-Term: Bearish
- Intermediate-Term: Bearish
- Long-Term: Bearish.
Key Insights Summary
Price is in a broad daily decline marked by lower swing highs and lower swing lows, with the current pivot structure, monthly grid position, and all six declining benchmarks aligned negatively. The latest large-range selloff has pushed ZB beneath the September NTZ and through the 105.25000 support area, leaving 105.06250 as the immediate swing-low reference. Momentum is fast and downside volatility remains elevated. The nearest structural countertrend reference is the 107.43750 pivot-high reversal level, while the overhead moving-average cluster from 106.96875 through 108.34375 defines a substantial rebound-and-rejection zone. Longer-term price remains materially below the declining 100-day and 200-day averages, preserving the dominant bearish trend cycle.
View charts on: AlphaWebTrader HTF Charts