Pre-market ETF movers and futures trends: ES and NQ hold broad strength, while yields above 5% pressure U.S. futures and oil remains volatile.
Fundamentals: U.S. index futures moved lower before the open as a renewed bond sell-off pushed the 10-year Treasury yield above 5% and increased expectations for further Fed tightening. Nasdaq futures led declines, while semiconductor shares remained relatively firm. Oil eased following a sharp rally, with Iran diplomacy, inventory data and supply concerns keeping energy markets volatile.
Technicals: NYSE pre-market context includes prior-session gains in USO, Meta and Microsoft, while IBIT, Amazon and Google declined. Futures analysis shows ES and NQ retaining bullish intermediate- and long-term structures near resistance, whereas YM, EMD, RTY and FDAX remain in short-term corrective phases despite broader long-term bullish backdrops. Key pivot and moving-average levels frame current conditions.
Pre-Market Trading 360° view Market Radar of: holidays, earnings, eco-news, market-news summary, news sentiment, prior session major ETFs, MAG7, Higher Time Frame Analysis Indices Futures Summary, and E-mini S&P500, Nasdaq 100, NYMEX Crude, Gold Futures Daily Chart analysis.
As of: September 24, 2026 07:16 CT
EcoNews Radar U.S. Events
| Day | Time | Impact | Event |
|---|---|---|---|
| Thu | 08:30 | Medium | Unemployment Claims |
| Fri | 10:00 | Medium | Revised UoM Consumer Sentiment |
| Fri | 10:00 | Medium | Revised UoM Inflation Expectations |
EcoNews Summary
No qualifying high-impact EcoNews events are listed. The listed medium-impact U.S. events are not directly related to oil, crude inventories, energy prices, or petroleum supply and are excluded.
Event Notes:
- No qualifying events listed.
Conclusion:
No single qualifying most important event or day is identified for the week.
For full details visit: Forex Factory EcoNews
Market News Summary:
U.S. index futures weakened as a renewed bond sell-off, higher Treasury yields, and elevated oil prices outweighed support from semiconductor strength and an extended U.S.-China trade truce.
Primary Drivers & Risks:
- Primary Driver: Surging Treasury yields pressure futures
- Primary Risk: Hawkish Fed and bond sell-off
Tone:
Risk-off, with rates and energy driving volatility.
Stock Market / ETFs / Indices:
Nasdaq 100 futures fell more than 1%, S&P 500 futures lost 0.6%, and Dow futures declined 0.3% before the open. Semiconductor shares remained a relative area of strength, with Japanese chip-related stocks lifting the Nikkei 1.8% and the semiconductor ETF reaching its highest level since June.
Geopolitical:
The U.S.-China trade truce was extended through January 10 as President Xi arrived in Washington for discussions with President Trump that include trade and AI. Iran stated openness to diplomacy to end the U.S.-Iran war, while tensions remained unresolved.
Oil / Energy:
Oil retreated after a prior-session rally as Iran kept diplomatic channels open and U.S. crude inventories posted a larger-than-anticipated build. Brent had moved above $100 per barrel, while rising Asian crude imports and conflict-related supply concerns remained cross-currents.
Gold / Metals:
Gold and silver stayed under pressure after stronger U.S. PMI data lifted Treasury yields and the dollar, increasing pricing for another Fed rate hike. Gold traded below $4,300 per ounce as higher yields and a rebound in oil weighed on the metal.
Fed / Financials:
The 10-year Treasury yield moved above 5% for the first time since 2007 following strong PMI data and increased Fed-hike pricing. Higher U.S. yields also weakened Asian currencies and coincided with Japan’s 10-year yield reaching a 30-year high.
Macro / Other:
AI investment remains a major economic theme, with data-center spending supporting jobs and equity wealth while contributing to inflation and housing-market crowding-out concerns. China’s DeepSeek reportedly reached a $1 billion annualized revenue run rate amid intensifying U.S.-China AI competition.
Conclusion:
Higher Treasury yields and renewed Fed tightening expectations were the main pressure on U.S. equity futures. The bond sell-off weighed most heavily on technology-sensitive Nasdaq futures.
Oil remained volatile amid Iran diplomacy, inventory data, and elevated crude-import demand. The extended U.S.-China trade truce and semiconductor strength provided offsetting market context.
Market News Sentiment
Market News Articles: 35
- Neutral: 54.29%
- Positive: 25.71%
- Negative: 20.00%
Sentiment Summary: Market news sentiment is predominantly neutral at 54%, with positive coverage at 26% and negative coverage at 20%.
Conclusion: The news mix is neutral overall, with positive articles modestly outnumbering negative articles.
GLD,Gold Articles: 10
- Negative: 50.00%
- Positive: 50.00%
Sentiment Summary: Gold-related coverage is evenly split, with 50% positive and 50% negative sentiment across 10 articles.
Conclusion: The balanced sentiment provides no clear directional tone from gold news for indices futures day traders.
USO,Oil Articles: 10
- Negative: 60.00%
- Positive: 20.00%
- Neutral: 20.00%
Sentiment Summary: USO/Oil coverage is predominantly negative, with 60% negative, 20% positive, and 20% neutral articles.
Conclusion: Oil-related news sentiment is negative overall, which may be relevant context for indices futures monitoring.
Market Data Snapshot
ETF Snapshot of major stock market ETFs, Mag7, and others as of: September 24, 2026 07:16
Top Movers & Losers
- USO 148.83 Bullish 3.30% ▲
- META 744.10 Bullish 1.02% ▲
- MSFT 500.59 Bullish 0.52% ▲
- IBIT 47.88 Bearish -1.95% ▼
- AMZN 249.27 Bearish -2.24% ▼
- GOOG 334.98 Bearish -3.58% ▼
Major Index ETFs: SPY, QQQ, DIA, IWM, IJH
- IJH 73.03 Bearish -0.60% ▼
- DIA 514.30 Bearish -0.71% ▼
- SPY 767.81 Bearish -0.72% ▼
- QQQ 741.21 Bearish -0.84% ▼
- IWM 281.92 Bearish -1.84% ▼
Major Index ETFs are Bearish across the group. IWM is the most bearish mover at -1.84%, while QQQ fell -0.84%, SPY declined -0.72%, DIA lost -0.71%, and IJH was the least negative mover at -0.60%.
Mag 7 Stocks: AAPL, MSFT, GOOG, AMZN, META, NVDA, TSLA
- META 744.10 Bullish 1.02% ▲
- MSFT 500.59 Bullish 0.52% ▲
- TSLA 380.12 Bullish 0.32% ▲
- AAPL 337.02 Bearish -0.80% ▼
- NVDA 225.51 Bearish -1.47% ▼
- AMZN 249.27 Bearish -2.24% ▼
- GOOG 334.98 Bearish -3.58% ▼
Mixed Mag7 snapshot: META is the most bullish mover at +1.02%, followed by MSFT at +0.52% and TSLA at +0.32%. GOOG is the most bearish mover at -3.58%, with AMZN at -2.24% and NVDA at -1.47%; AAPL is bearish at -0.80%.
Cross-Market ETFs: TLT, GLD, USO, IBIT
- USO 148.83 Bullish 3.30% ▲
- TLT 80.46 Bearish -1.58% ▼
- GLD 392.88 Bearish -1.80% ▼
- IBIT 47.88 Bearish -1.95% ▼
Other ETFs are Mixed: USO is the most bullish mover at +3.30%, while IBIT is the most bearish mover at -1.95%. GLD is Bearish at -1.80%, and TLT is Bearish at -1.58%.
ETF, Mag7, and Cross-Market ETF Insights
Overall Tone
Mixed with a Risk Off equity tone: broad index ETFs declined while selective Mag7 strength and a +3.30% USO gain created divergence.
Equity ETFs and Mag7:
Major Index ETFs were broadly Bearish, led lower by IWM at -1.84%, followed by QQQ at -0.84%, SPY at -0.72%, DIA at -0.71%, and IJH at -0.60%. Mag7 action was selective: META was the most bullish mover at +1.02%, with MSFT at +0.52% and TSLA at +0.32%, while AAPL fell -0.80%, NVDA -1.47%, AMZN -2.24%, and GOOG was the most bearish mover at -3.58%. Equity performance was therefore Mixed rather than broadly aligned.
Cross-Market ETFs:
Cross-market ETFs were Mixed, with USO the most bullish mover at +3.30% while TLT declined -1.58%, GLD fell -1.80%, and IBIT was the most bearish mover at -1.95%. Oil strength diverged from Bearish bonds, gold, and bitcoin-related exposure, alongside the broader equity weakness.
Futures Indices – Higher Time Frame Analysis
Summary of the current state of US Indices Futures based on higher time-frame (HTF) technical analysis as of: 2026-09-24: 07:16 CT.
US Indices Futures
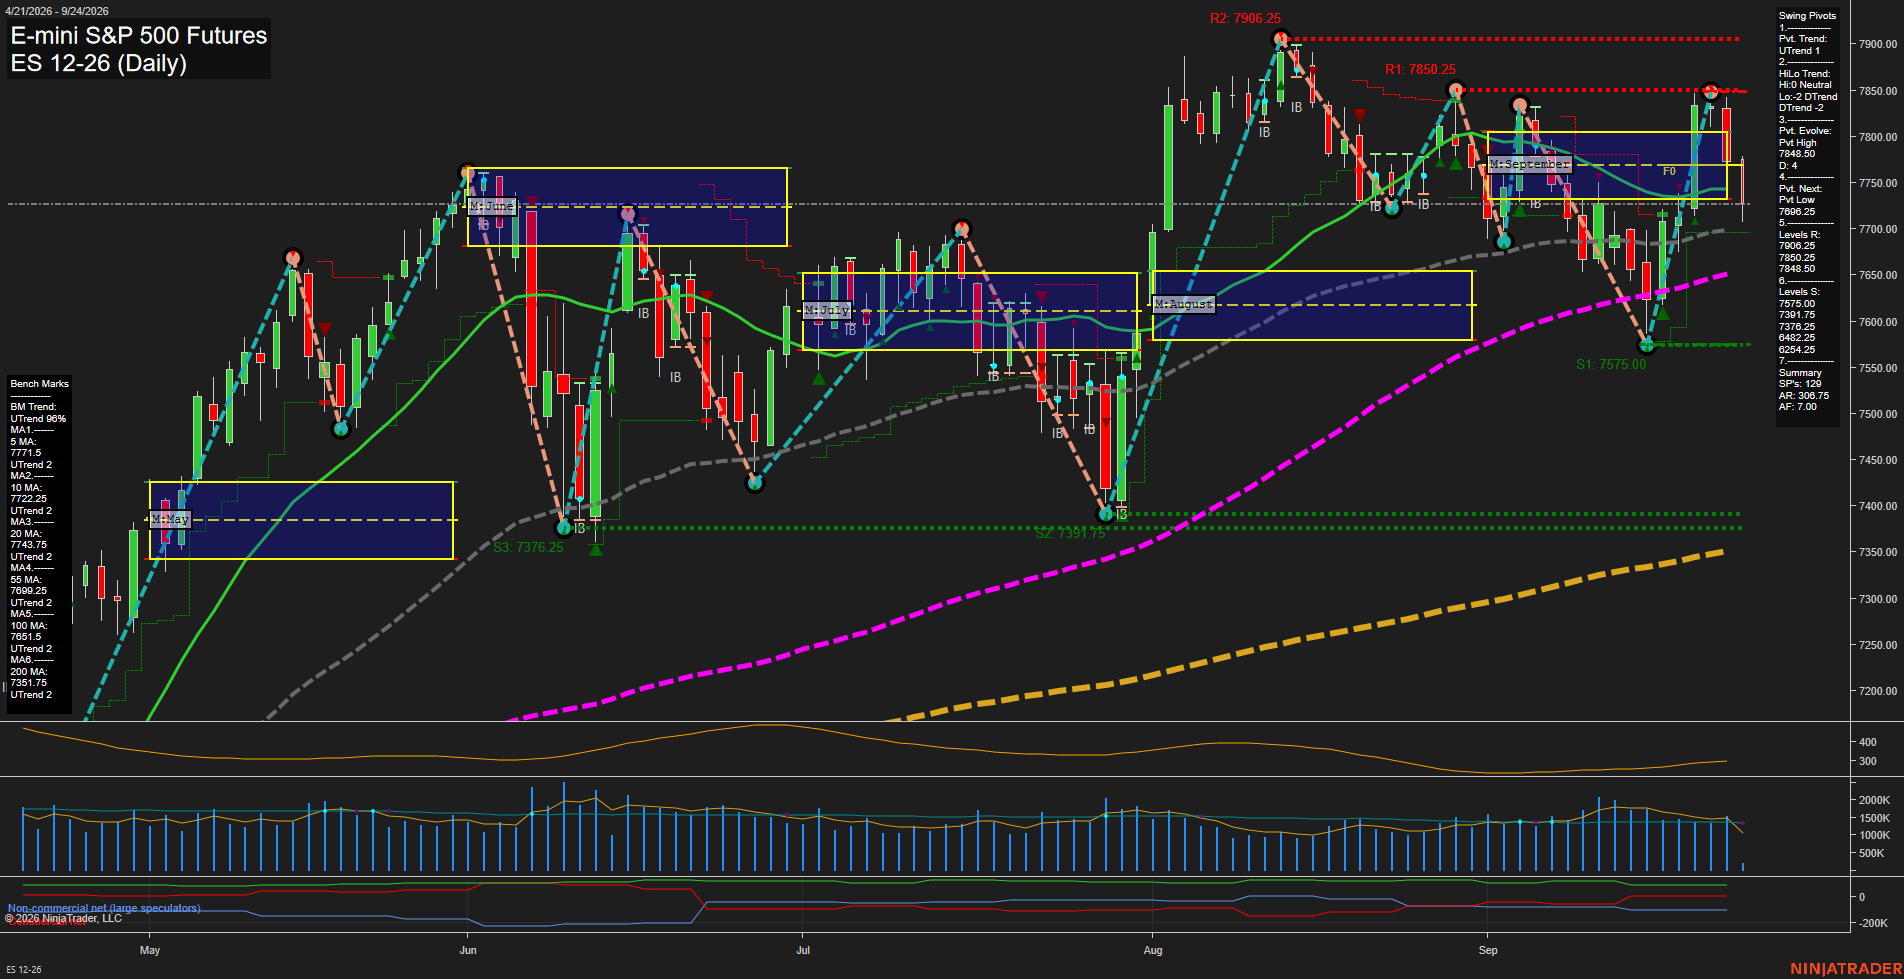
- ES YSFG/MSFG/WSFG structure remains above rising benchmarks, UTrend pivots intact, consolidation below 7906.25 resistance, 7556.25 pivot support.
- NQ Above YSFG/MSFG/WSFG F0% and rising benchmarks, higher-low pivots, TR120 short signal below 31094.75–31389.25 resistance, 28630.75 support.
- YM Below WSFG/MSFG F0% and short benchmarks, down pivot structure, 51602 support, 53974 reversal level, longer-term benchmarks remain rising.
- EMD Below WSFG/MSFG F0% and declining short benchmarks, DTrend pivots, 3636.2 support, 3834.6–3896.8 resistance, YSFG and long benchmarks remain higher.
- RTY Below WSFG/MSFG and 5–20 benchmarks, bearish pivots, 2843.9 support, 3011.1 reversal level, 3101.8 resistance, long benchmarks rising.
- FDAX Below MSFG and 5–20 benchmarks, DTrend pivots, 25337 support then 24897, 26715–26847 resistance, rising long-term benchmarks.
Overall State
- Short-Term: Bearish
- Intermediate-Term: Bearish
- Long-Term: Bullish
Conclusion
NQ retains the strongest HTF alignment, holding above all Fib-grid F0% areas and benchmark averages. ES remains in a broader UTrend but is consolidating beneath resistance. YM, EMD, RTY, and FDAX display correlated short-term corrective structures below weekly and monthly grids and short benchmarks. Across all instruments, rising yearly structures and 200-period benchmarks maintain long-term bullish context; pivot supports and reversal thresholds define current swing structure.
Note: Intra-day counter-trend pullbacks or retracements may occur, HTF is context for informational usage and market structure. Glossary: Session Fib Grids periods of YSFG:’Yearly’, MSFG:’Monthly’, WSFG:’Weekly’
For full details visit: AlphaWebTrader Technicals
ES Daily View
View charts on: AlphaWebTrader HTF Charts
NQ Daily View
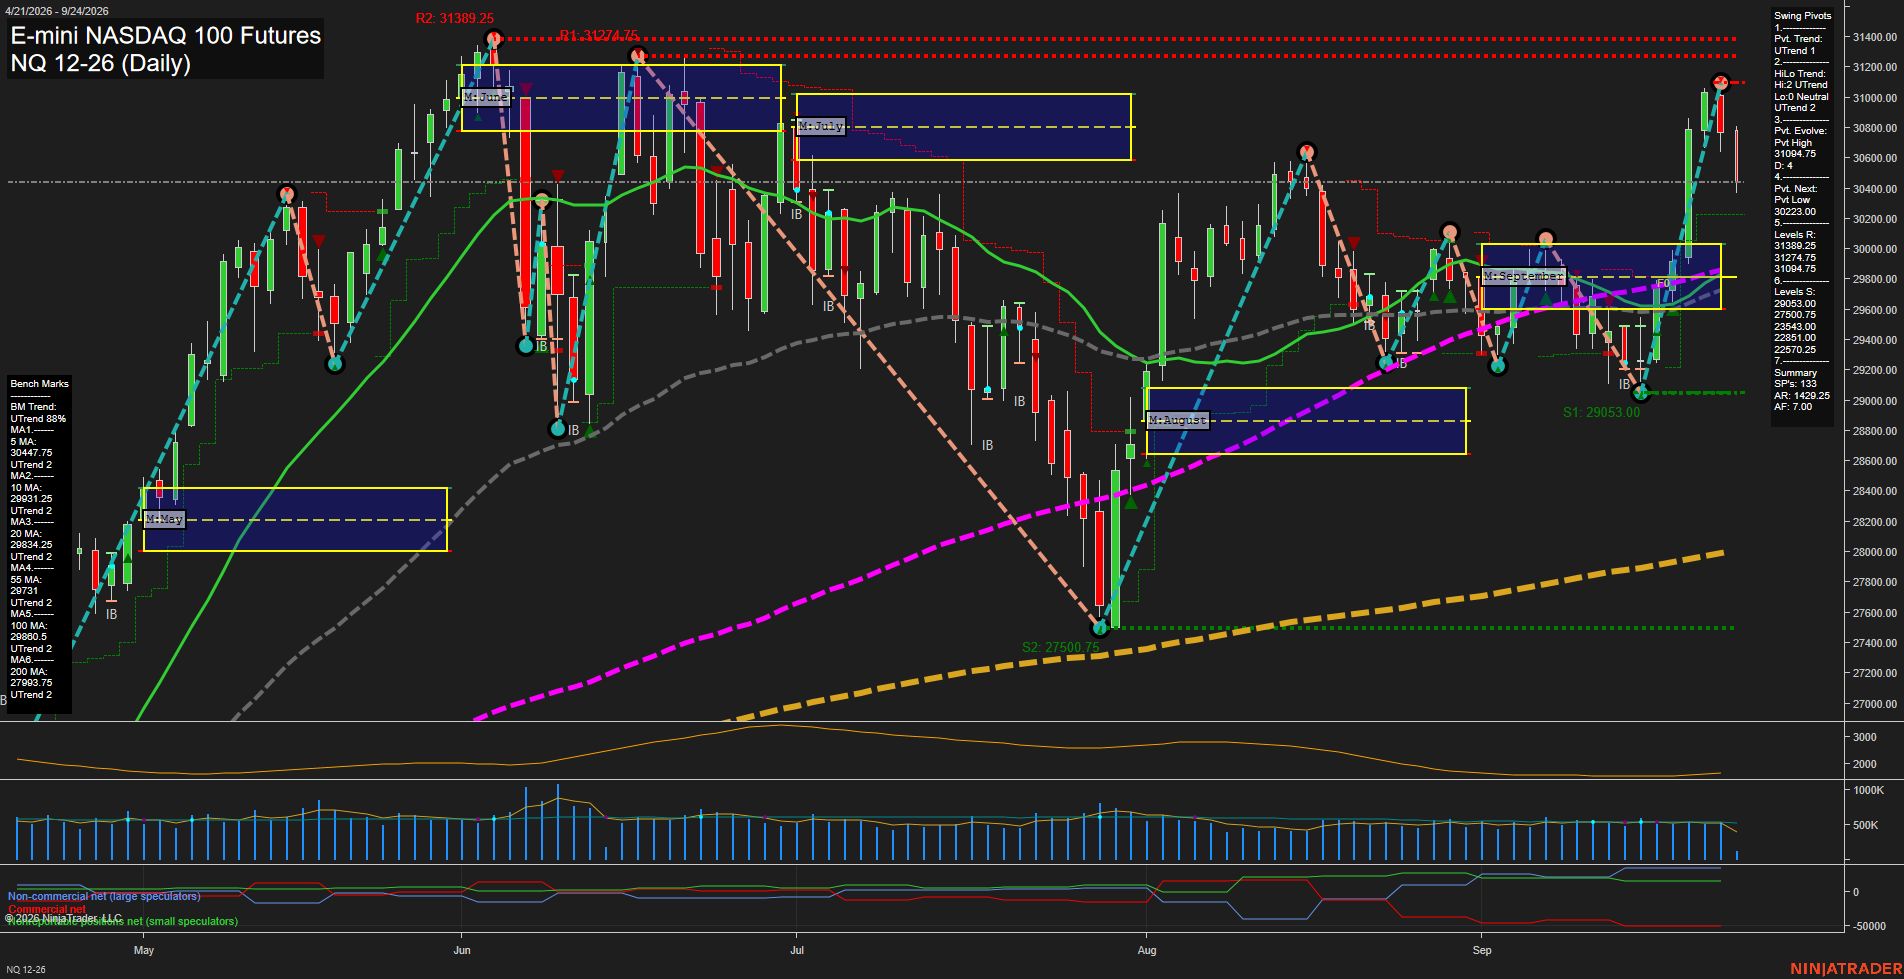
Overall Rating
- Short-Term: Bullish
- Intermediate-Term: Bullish
- Long-Term: Bullish.
Key Insights Summary
Price remains in a broad bullish swing structure, holding above the weekly, monthly, and yearly F0% levels while all benchmark averages retain upward trends. The advance into 31094.75 produced a short-term pivot high and a medium-sized pullback bar, reflecting rejection and consolidation beneath nearby resistance at 31094.75 through 31389.25. The 30223.00 pivot-next level defines the immediate short-term swing threshold, while the clustered 55-, 100-, and 20-day averages near 29731 to 29860 provide an important intermediate support zone. The recent structure remains characterized by higher lows from the August low, although fast momentum and elevated ATR conditions show that the current rally phase has become more volatile and two-sided near the upper range.
View charts on: AlphaWebTrader HTF Charts
CL Daily View
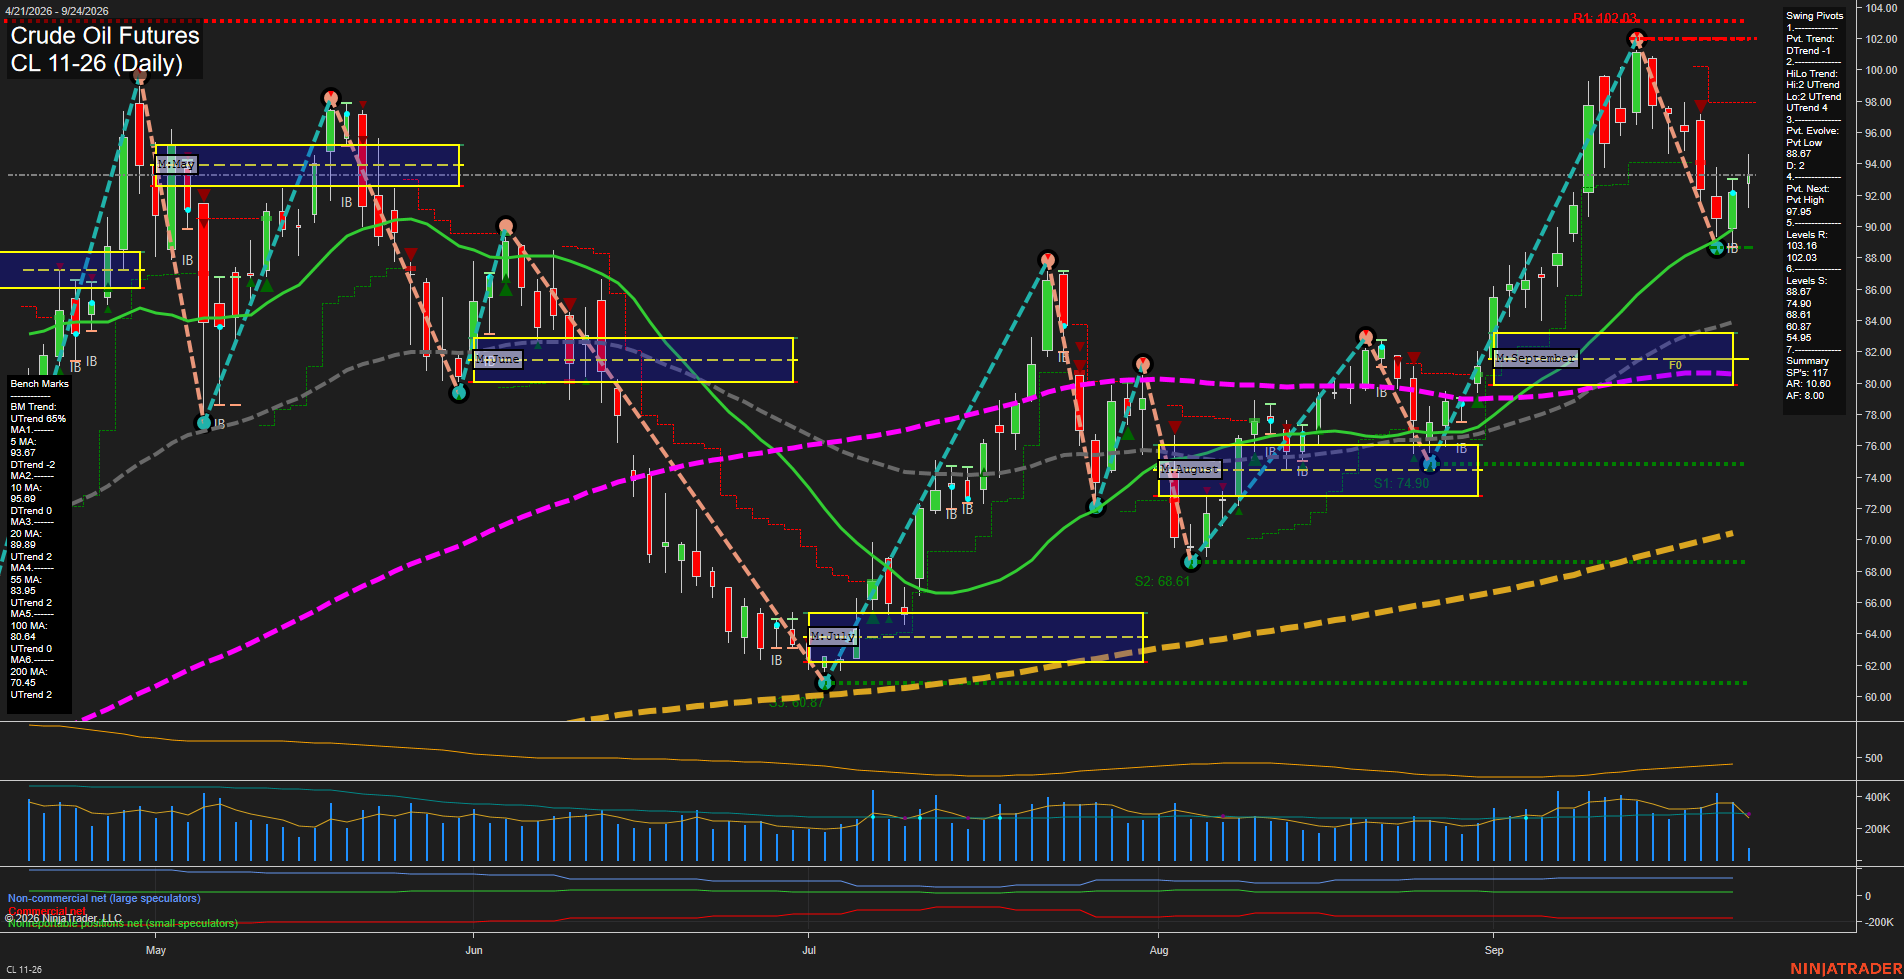
Overall Rating
- Short-Term: Bearish
- Intermediate-Term: Bullish
- Long-Term: Bullish.
Key Insights Summary
Price has produced a sharp rebound from the 88.67 pivot low, but the short-term pivot structure remains in DTrend and both the 5-day and 10-day benchmarks remain down. The recovery is occurring above the rising 20-day average and within an intact intermediate higher-low structure, while the monthly and yearly Fib-grid positions remain above their F0% levels. The 97.95 pivot threshold is the defining upside reversal level within the current pullback sequence, with 102.03 the major visible swing resistance. The recent selloff from the 102 area and fast rebound from 88.67 reflect elevated volatility and a broad consolidation within a still-positive intermediate and long-term trend framework.
View charts on: AlphaWebTrader HTF Charts
GC Daily View
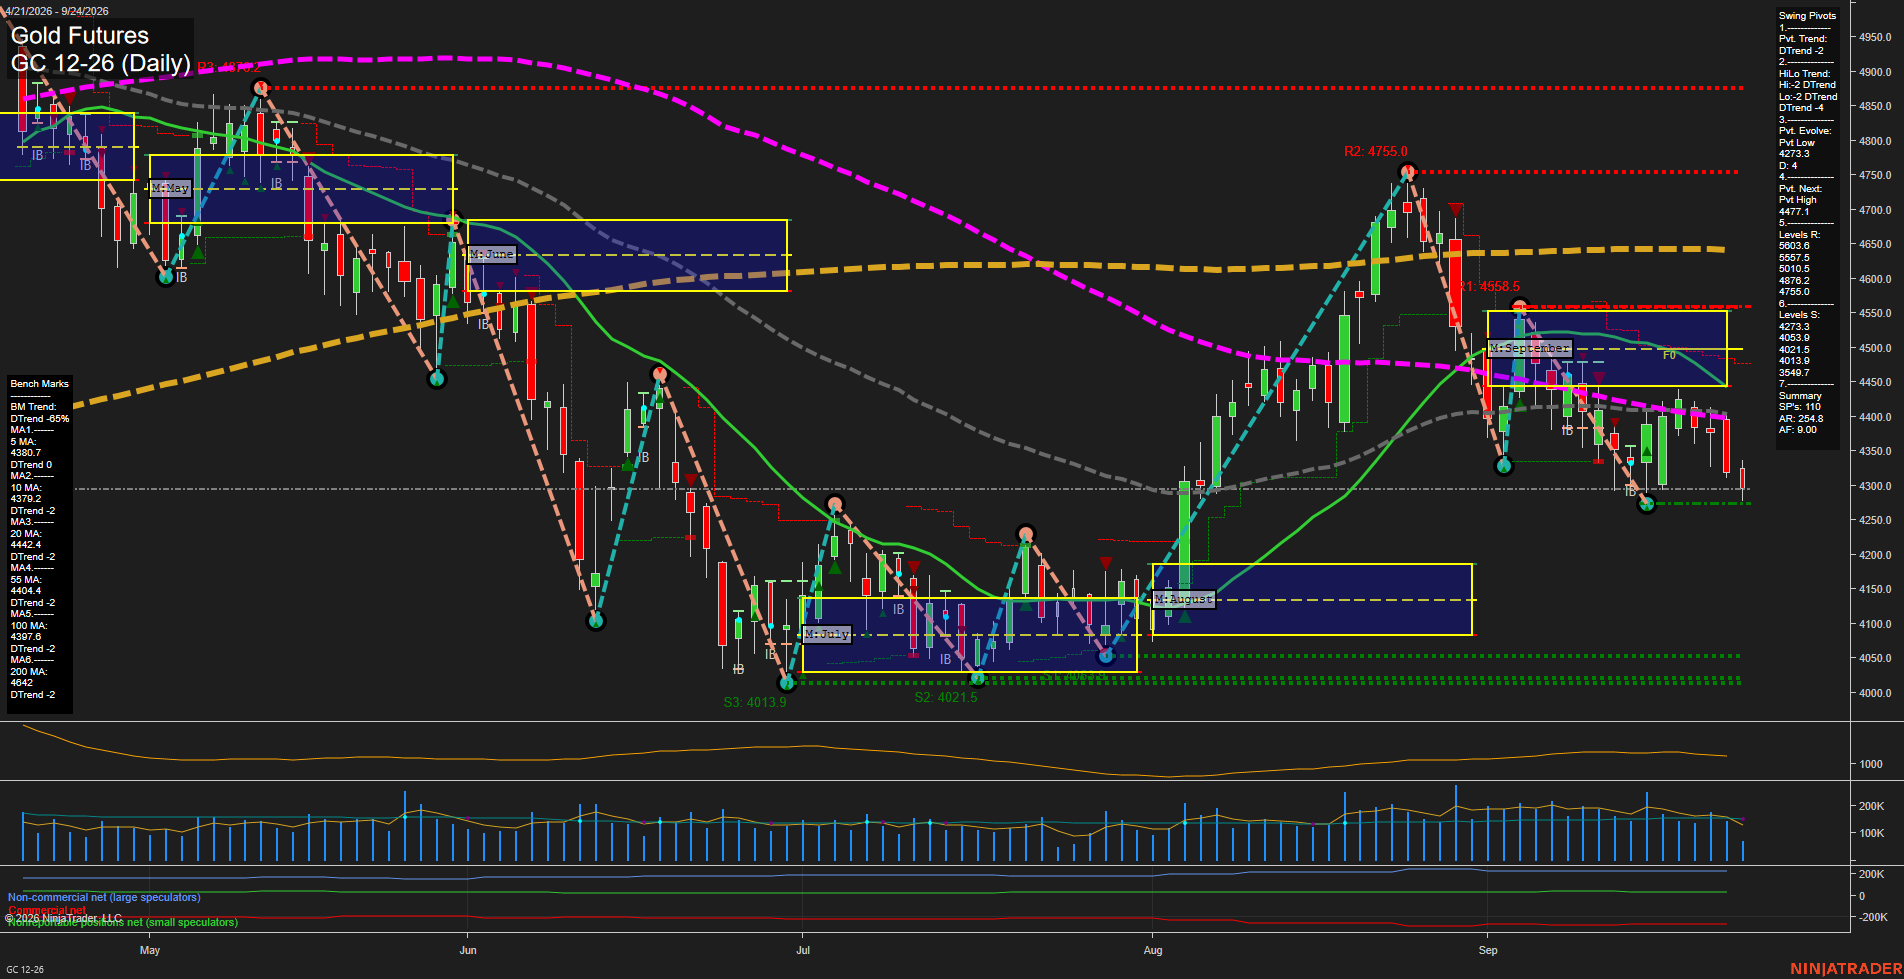
Overall Rating
- Short-Term: Bearish
- Intermediate-Term: Bearish
- Long-Term: Bearish.
Key Insights Summary
Gold futures remain in a broad corrective downswing, with price below the weekly, monthly, and yearly Fib-grid centers and beneath all six declining daily benchmarks. The short-term pivot trend and intermediate HiLo structure are both down, defined by lower highs from the 4755.0 swing resistance and a fresh pivot low near 4274.4. The recent decline has accelerated below the 5-day and 10-day averages, while 4442.4 to 4477.1 represents the nearest overhead retracement and pivot-reversal zone. The 4273.3 support area is the immediate structural test; lower supports cluster near 4053.9 through 4013.9. Elevated range conditions and declining momentum structure characterize the current swing cycle.
View charts on: AlphaWebTrader HTF Charts
ZB Daily View
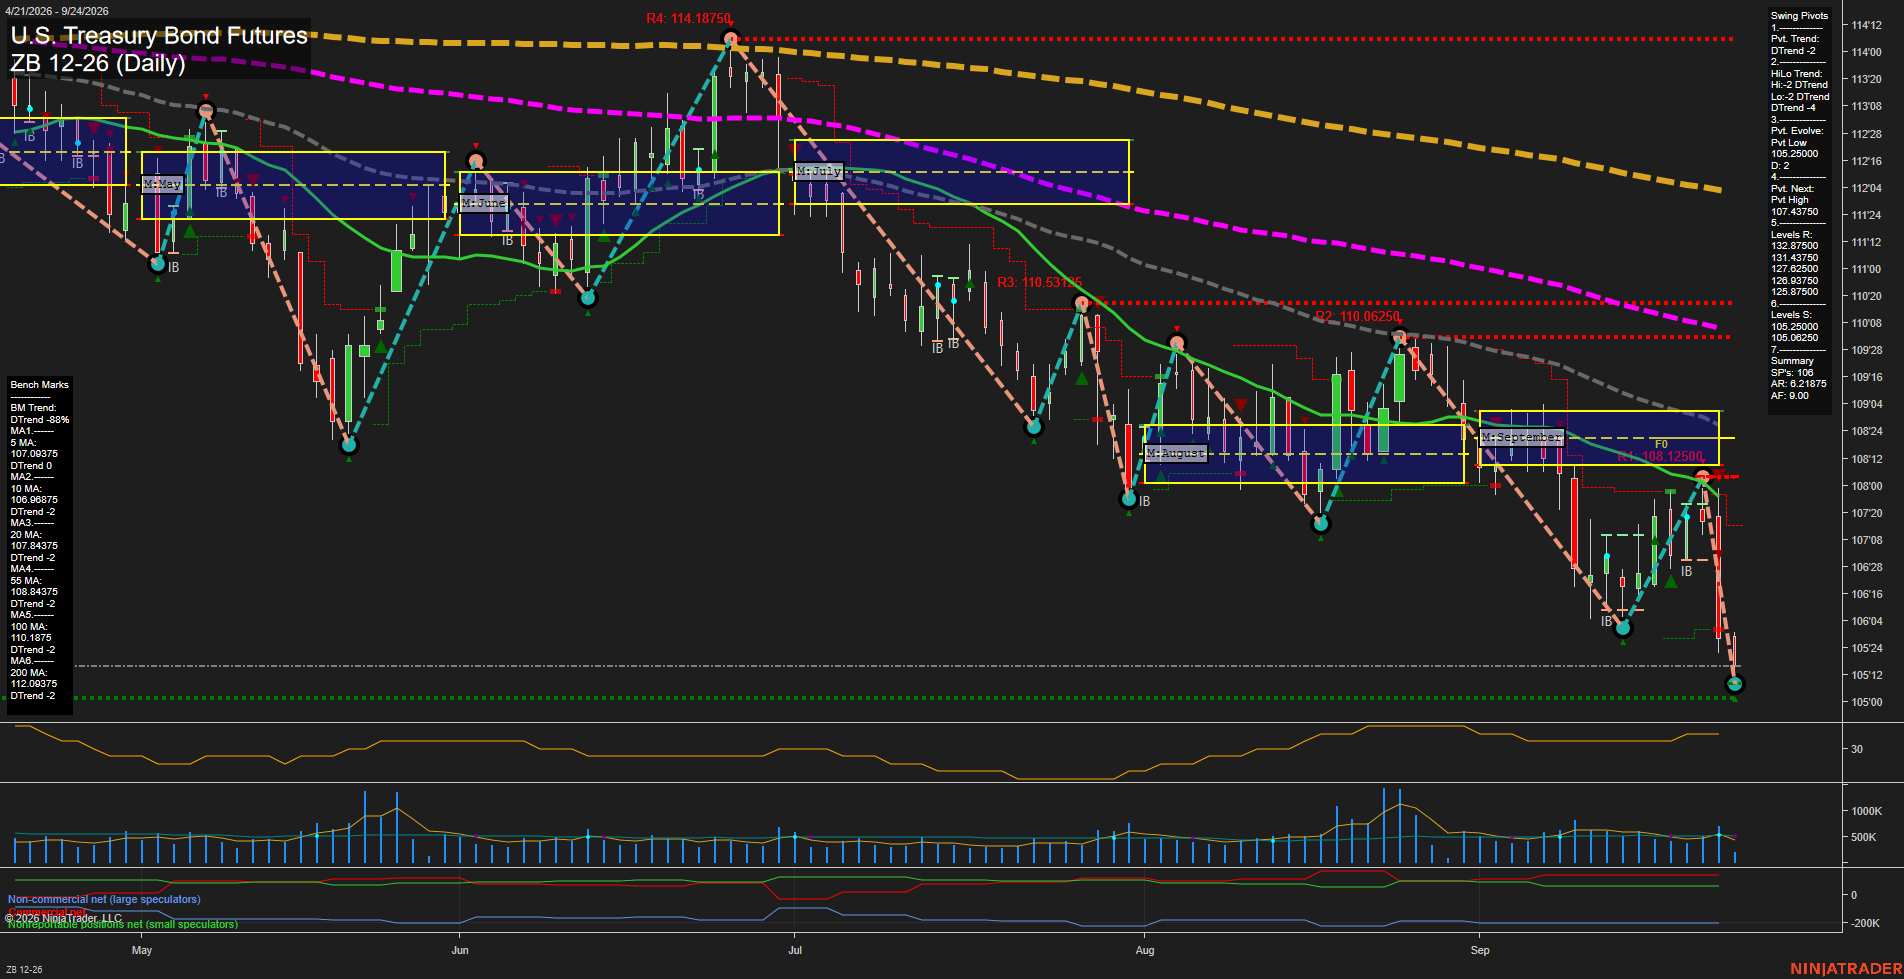
Overall Rating
- Short-Term: Bearish
- Intermediate-Term: Bearish
- Long-Term: Bearish.
Key Insights Summary
Price is in a broad daily decline marked by lower swing highs and lower swing lows, with the current pivot structure, monthly grid position, and all six declining benchmarks aligned negatively. The latest large-range selloff has pushed ZB beneath the September NTZ and through the 105.25000 support area, leaving 105.06250 as the immediate swing-low reference. Momentum is fast and downside volatility remains elevated. The nearest structural countertrend reference is the 107.43750 pivot-high reversal level, while the overhead moving-average cluster from 106.96875 through 108.34375 defines a substantial rebound-and-rejection zone. Longer-term price remains materially below the declining 100-day and 200-day averages, preserving the dominant bearish trend cycle.
View charts on: AlphaWebTrader HTF Charts