Pre-market review of ES, NQ, YM, EMD, RTY and FDAX tracks pivots and trend signals as oil, yields, Iran and PCE shape futures trading.
Fundamentals: U.S. index futures face cross-currents from recent equity strength and renewed pressure from oil, Treasury yields and Middle East tensions. Stalled U.S.-Iran diplomacy keeps Strait of Hormuz risks in focus, while rebounding Gulf exports temper supply concerns. Markets are also weighing hawkish Fed expectations, weaker China industrial-profit growth and Wednesday's PCE inflation data.
Technicals: U.S. index futures enter the NYSE pre-market session with broadly constructive longer-term structures in ES and NQ, while YM, EMD, RTY and FDAX remain in short-term corrective or bearish phases. The report maps pivot thresholds, moving-average clusters and Fib-grid references as markets consolidate after September volatility.
Pre-Market Trading 360° view Market Radar of: holidays, earnings, eco-news, market-news summary, news sentiment, prior session major ETFs, MAG7, Higher Time Frame Analysis Indices Futures Summary, and E-mini S&P500, Nasdaq 100, NYMEX Crude, Gold Futures Daily Chart analysis.
As of: September 28, 2026 07:16 CT
Earnings Radar
Monitoring for earnings releases by the Magnificent 7, AI-tech-related firms, and major financial institutions.
- MU Release: 2026-09-30 T:AMC
Conclusion: MU reports after the close on 2026-09-30, placing semiconductor and AI-memory earnings focus into index-futures market context. Market momentum and volume can slow ahead of this major semiconductor release.
For full details visit: Yahoo Earnings Calendar
EcoNews Radar U.S. Events
| Day | Time | Impact | Event |
|---|---|---|---|
| Tue | 10:00 | Medium | CB Consumer Confidence |
| Tue | 10:00 | Medium | JOLTS Job Openings |
| Wed | 08:15 | Medium | ADP Non-Farm Employment Change |
| Wed | 08:30 | High | Core PCE Price Index m/m |
| Wed | 08:30 | High | Final GDP q/q |
| Wed | 08:30 | Medium | Final GDP Price Index q/q |
| Wed | 10:30 | Low | Crude Oil Inventories |
| Thu | 08:30 | Medium | Unemployment Claims |
| Thu | 10:00 | Medium | FOMC Member Waller Speaks |
| Thu | 10:00 | Medium | ISM Manufacturing PMI |
| Fri | 08:30 | High | Average Hourly Earnings m/m |
| Fri | 08:30 | High | Non-Farm Employment Change |
| Fri | 08:30 | High | Unemployment Rate |
EcoNews Summary
High-impact U.S. inflation, growth, and labor releases concentrate on Wednesday and Friday. These reports provide key readings on price pressure, economic activity, wage growth, employment conditions, and unemployment.
Event Notes:
- Wednesday 08:30 — Core PCE Price Index m/m: Measures the monthly change in consumer prices excluding food and energy. Traders monitor it as a gauge of underlying inflation pressure.
- Wednesday 08:30 — Final GDP q/q: Measures the final quarterly annualized change in U.S. economic output. Traders monitor it for confirmation of the economy’s growth pace.
- Friday 08:30 — Average Hourly Earnings m/m: Measures the monthly change in worker pay. Traders monitor wage growth for its connection to labor-cost and inflation pressures.
- Friday 08:30 — Non-Farm Employment Change: Measures the monthly change in U.S. employment outside the farm sector. Traders monitor it as a broad indicator of labor-market strength.
- Friday 08:30 — Unemployment Rate: Measures the percentage of the labor force without a job and actively seeking work. Traders monitor it for changes in labor-market slack.
Conclusion:
Friday at 08:30, led by Non-Farm Employment Change, is the week’s single most important event window, alongside Average Hourly Earnings and the Unemployment Rate. Market momentum and volume often slow ahead of major PCE, GDP, and employment releases, with increased volatility at release time.
For full details visit: Forex Factory EcoNews
Market News Summary:
Index futures face competing support from prior U.S. equity strength and pressure from higher oil prices, Treasury yields, and Middle East tensions.
Primary Drivers & Risks:
- Primary Driver: Oil-driven inflation and yields
- Primary Risk: Iran conflict escalation
Tone:
Cautious, with inflation and geopolitical cross-currents dominating.
Stock Market / ETFs / Indices:
Japanese equities rose 0.8%, led by chip-related stocks, after Friday’s U.S. equity rebound. U.S. futures traded higher early Monday, while later coverage cited pressure from rising oil, higher yields, and AI-sector safety concerns. The Nasdaq-100 recently reached record highs and the S&P 500 remained near its peak.
Geopolitical:
U.S.-Iran diplomacy remained stalled after rejection of Iran’s Hormuz proposal, keeping Strait of Hormuz disruption risks elevated. The U.S.-China trade truce received a two-month extension, while the Trump-Xi meeting produced limited deliverables beyond further AI-risk discussions.
Oil / Energy:
Crude rose as stalled Iran talks and Hormuz uncertainty outweighed recovering Gulf supply. Middle East exports rebounded to 12.8 million barrels per day in September as Saudi Arabia and the UAE increased shipments, partially offsetting supply disruption concerns. Tight LNG conditions persisted, including delayed Qatari deliveries to an Italian buyer.
Gold / Metals:
Gold and silver fell sharply, with gold reaching a seven-week low. Higher oil prices, rising Treasury yields, a stronger dollar, and deeper Fed rate-hike pricing weighed on precious metals and miners.
Fed / Financials:
Treasury yields resumed their rise after multiyear-high levels last week, as oil-driven inflation pressure reinforced hawkish Federal Reserve expectations. Higher-for-longer policy concerns followed strong U.S. industrial activity and elevated energy costs. Bank of Japan minutes also showed growing support among some policymakers for faster rate increases.
Macro / Other:
China’s industrial-profit growth slowed to 4.2% in August, its weakest pace of the year, amid sluggish demand and intense competition. Higher transport and motor-oil costs were reported as spreading through the U.S. economy. Wednesday’s U.S. PCE inflation data stands as a near-term macro focus.
Conclusion:
Oil prices, Treasury yields, and Federal Reserve rate expectations are the central index-futures inputs. Middle East developments remain closely linked to energy and inflation pricing.
Rebounding Gulf crude exports temper the supply shock, while stalled Hormuz diplomacy sustains the geopolitical risk premium. Equity resilience and prior gains in technology shares contrast with higher yields, China growth softness, and sector-specific AI concerns.
Market News Sentiment
Market News Articles: 23
- Neutral: 47.83%
- Negative: 34.78%
- Positive: 17.39%
Sentiment Summary: Market news sentiment is primarily neutral (48%), with negative coverage (35%) exceeding positive coverage (17%).
Conclusion: Indices futures day traders face a neutral-to-cautious news backdrop based on the distribution of reported sentiment.
GLD,Gold Articles: 7
- Negative: 85.71%
- Positive: 14.29%
Sentiment Summary: Gold-related coverage is predominantly negative, with 86% negative and 14% positive sentiment across 7 articles.
Conclusion: The snapshot reflects a strongly negative news tone toward GLD and gold, which may be relevant for indices futures traders monitoring risk sentiment.
USO,Oil Articles: 8
- Positive: 62.50%
- Negative: 25.00%
- Neutral: 12.50%
Sentiment Summary: USO/Oil coverage is moderately positive, with 63% positive, 25% negative, and 13% neutral articles across 8 articles.
Conclusion: Oil-related news tone is net positive, providing a supportive sentiment backdrop for energy-sensitive index futures sectors.
Market Data Snapshot
ETF Snapshot of major stock market ETFs, Mag7, and others as of: September 28, 2026 07:16
Top Movers & Losers
- MSFT 516.17 Bullish 3.66% ▲
- AAPL 341.07 Bullish 1.53% ▲
- DIA 517.49 Bullish 0.94% ▲
- TSLA 372.11 Bearish -1.54% ▼
- USO 148.33 Bearish -3.11% ▼
- META 751.66 Bearish -3.33% ▼
Major Index ETFs: SPY, QQQ, DIA, IWM, IJH
- DIA 517.49 Bullish 0.94% ▲
- SPY 771.35 Bullish 0.54% ▲
- QQQ 744.50 Bullish 0.46% ▲
- IJH 72.99 Bullish 0.36% ▲
- IWM 281.97 Bullish 0.11% ▲
Major Index ETFs are Bullish across the group: DIA is the most bullish mover at +0.94%, followed by SPY at +0.54%, QQQ at +0.46%, and IJH at +0.36%. IWM is the least positive mover at a marginal +0.11%.
Mag 7 Stocks: AAPL, MSFT, GOOG, AMZN, META, NVDA, TSLA
- MSFT 516.17 Bullish 3.66% ▲
- AAPL 341.07 Bullish 1.53% ▲
- GOOG 341.08 Bullish 0.61% ▲
- NVDA 225.07 Bullish 0.22% ▲
- AMZN 249.67 Bullish 0.12% ▲
- TSLA 372.11 Bearish -1.54% ▼
- META 751.66 Bearish -3.33% ▼
Mixed: MSFT is the most bullish mover at +3.66%, followed by AAPL at +1.53% and GOOG at +0.61%. NVDA at +0.22% and AMZN at +0.12% are modestly Bullish. META is the most bearish mover at -3.33%, with TSLA also Bearish at -1.54%.
Cross-Market ETFs: TLT, GLD, USO, IBIT
- GLD 393.41 Bullish 0.44% ▲
- TLT 79.32 Bearish -0.13% ▼
- IBIT 47.57 Bearish -0.50% ▼
- USO 148.33 Bearish -3.11% ▼
Other ETFs are Mixed: GLD is the most bullish mover at +0.44%, while USO is the most bearish mover at -3.11%. IBIT is Bearish at -0.50%, and TLT is marginally Bearish at -0.13%.
ETF, Mag7, and Cross-Market ETF Insights
Overall Tone
Mixed: equity ETFs are broadly Bullish, while sharp Bearish moves in META and USO create selective risk-off divergence.
Equity ETFs and Mag7:
Major Index ETFs are broadly Bullish, led by DIA at +0.94%, followed by SPY at +0.54% and QQQ at +0.46%; IWM at +0.11% is marginally positive and IJH gained +0.36%. Mag7 performance is selective: MSFT is the most bullish mover at +3.66%, while META is the most bearish mover at -3.33%, with TSLA also Bearish at -1.54%. AAPL gained +1.53%, while GOOG, NVDA, and AMZN posted more modest Bullish moves.
Cross-Market ETFs:
Cross-market ETFs are Mixed versus Bullish equities: GLD gained +0.44%, while TLT was marginally Bearish at -0.13%. GLD is the most bullish cross-market mover, while USO is the most bearish at -3.11%; IBIT also declined -0.50%. Commodity weakness contrasts with the broad equity ETF gains, while gold strength indicates divergence within cross-market positioning.
Futures Indices – Higher Time Frame Analysis
Summary of the current state of US Indices Futures based on higher time-frame (HTF) technical analysis as of: 2026-09-28: 07:16 CT.
US Indices Futures
- ES: YSFG/MSFG up, WSFG short; benchmarks rising; pivots UTrend; support 7568.25/7668.25, resistance 7848.50-7850.25 and 7906.25.
- NQ: YSFG/MSFG up, WSFG down; benchmarks rising; intermediate UTrend; support 28734.75/27500.75, resistance 31094.75-31389.25.
- YM: YSFG up, MSFG/WSFG down; short benchmarks declining; pivot DTrend; support 51477-51479, resistance 52731-52917 and 53387.
- EMD: YSFG up, MSFG/WSFG down; daily benchmarks declining; pivot DTrend; support 3636.2/3617.1, resistance 3699.6, 3830.6 and 3896.8.
- RTY: YSFG up, MSFG/WSFG down; short benchmarks declining; pivot DTrend; support 2829/2825.1, resistance 2911.9, 2931.2 and 3005.2.
- FDAX: YSFG up, MSFG/WSFG down; short benchmarks declining; pivot DTrend; support 25333-25337, resistance 25943-25990 and 26069.
Overall State
- Short-Term: Bearish
- Intermediate-Term: Neutral
- Long-Term: Bullish
Conclusion
ES and NQ retain intermediate and long-term UTrend structures, though WSFG readings and recent signals reflect consolidation below pivot resistance. YM, EMD, RTY, and FDAX are aligned in short-term DTrend conditions, below WSFG and MSFG balance areas, with price testing or near active pivot supports. Across the group, YSFG positioning and longer-term benchmark structure remain upward for most contracts; EMD and RTY daily long-term conditions are mixed. The short-term weakness is broadly correlated across YM, EMD, RTY, and FDAX, while ES and NQ hold comparatively firmer higher-timeframe benchmark alignment.
Note: Intra-day counter-trend pullbacks or retracements may occur, HTF is context for informational usage and market structure. Glossary: Session Fib Grids periods of YSFG:’Yearly’, MSFG:’Monthly’, WSFG:’Weekly’
For full details visit: AlphaWebTrader Technicals
ES Daily View
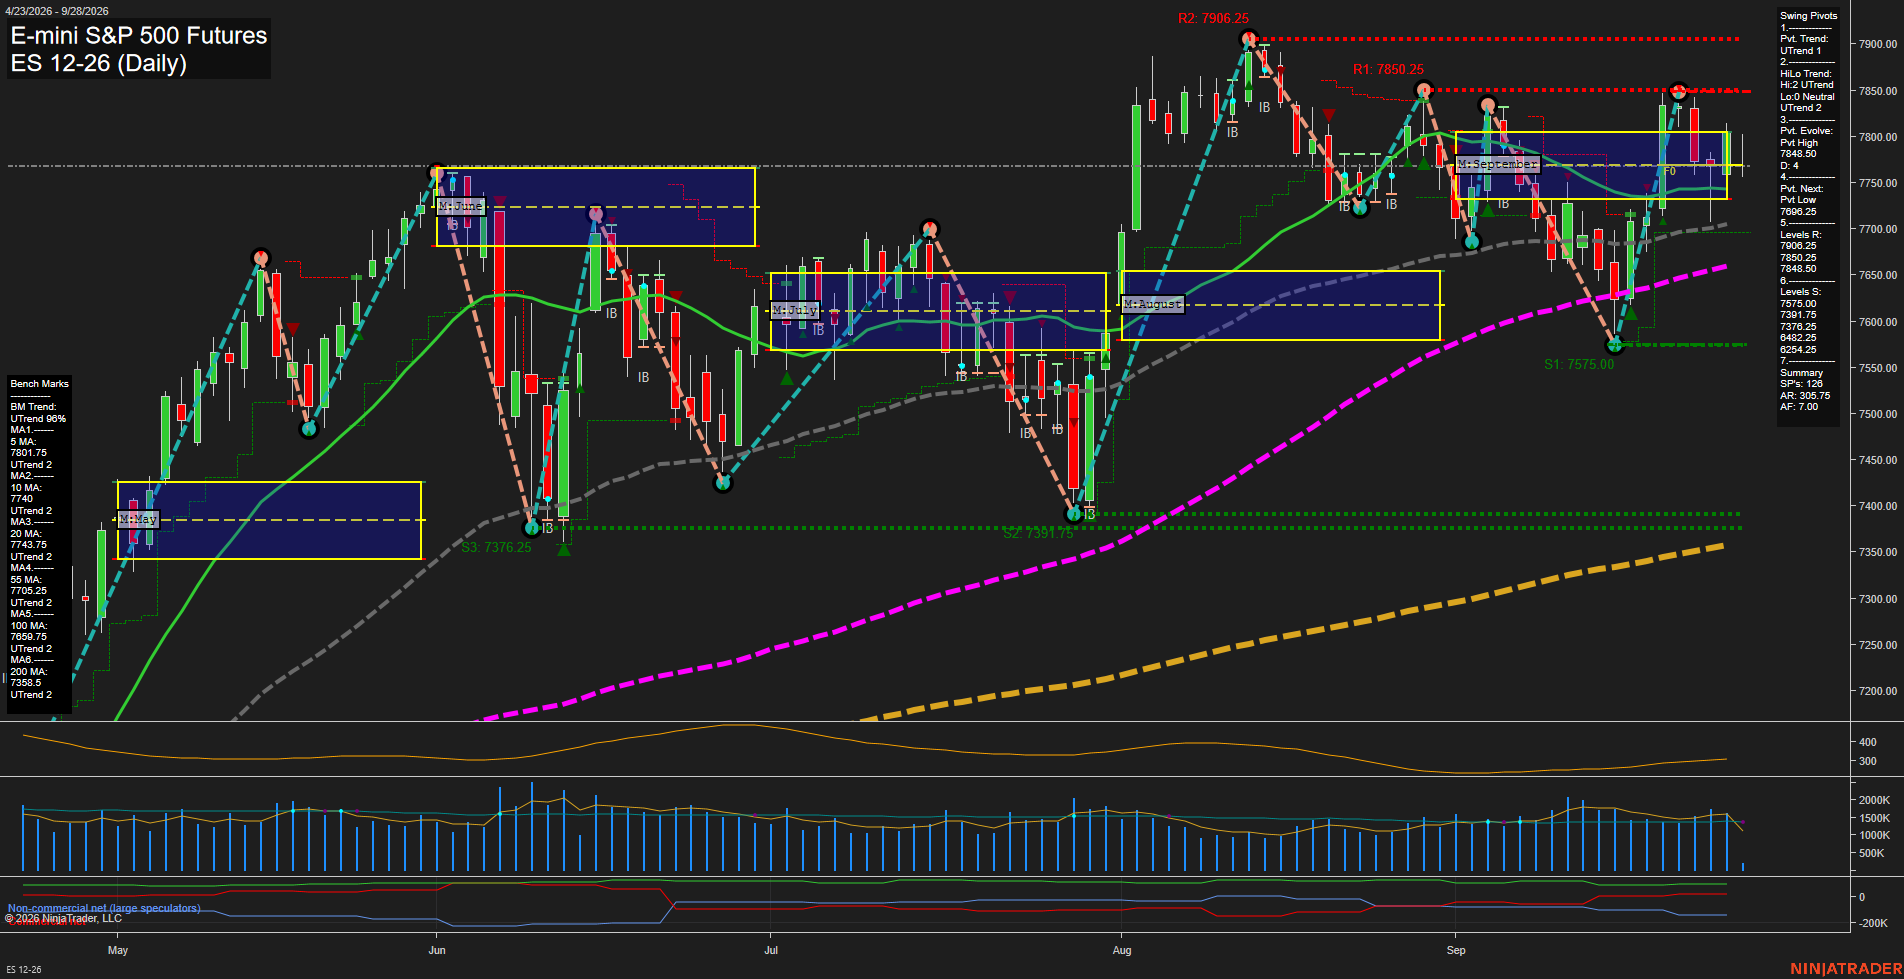
Overall Rating
- Short-Term: Bullish
- Intermediate-Term: Bullish
- Long-Term: Bullish.
Key Insights Summary
The daily structure remains broadly constructive, with price above the rising 10, 20, 55, 100, and 200-day benchmarks and both pivot trend measures aligned upward. The late-September pullback has placed price below the weekly F0% area and beneath the 5-day average, reflecting short-term consolidation and a countertrend weekly bias within the larger advance. The 7848.50 to 7850.25 pivot-resistance band is the immediate overhead supply area, while 7705.25 to 7743.75 clusters the principal moving-average support. The monthly and yearly fib-grid readings remain positive, supporting the intermediate and long-term higher-high/higher-low trend structure despite elevated daily ATR and recent choppy two-way price action.
View charts on: AlphaWebTrader HTF Charts
NQ Daily View
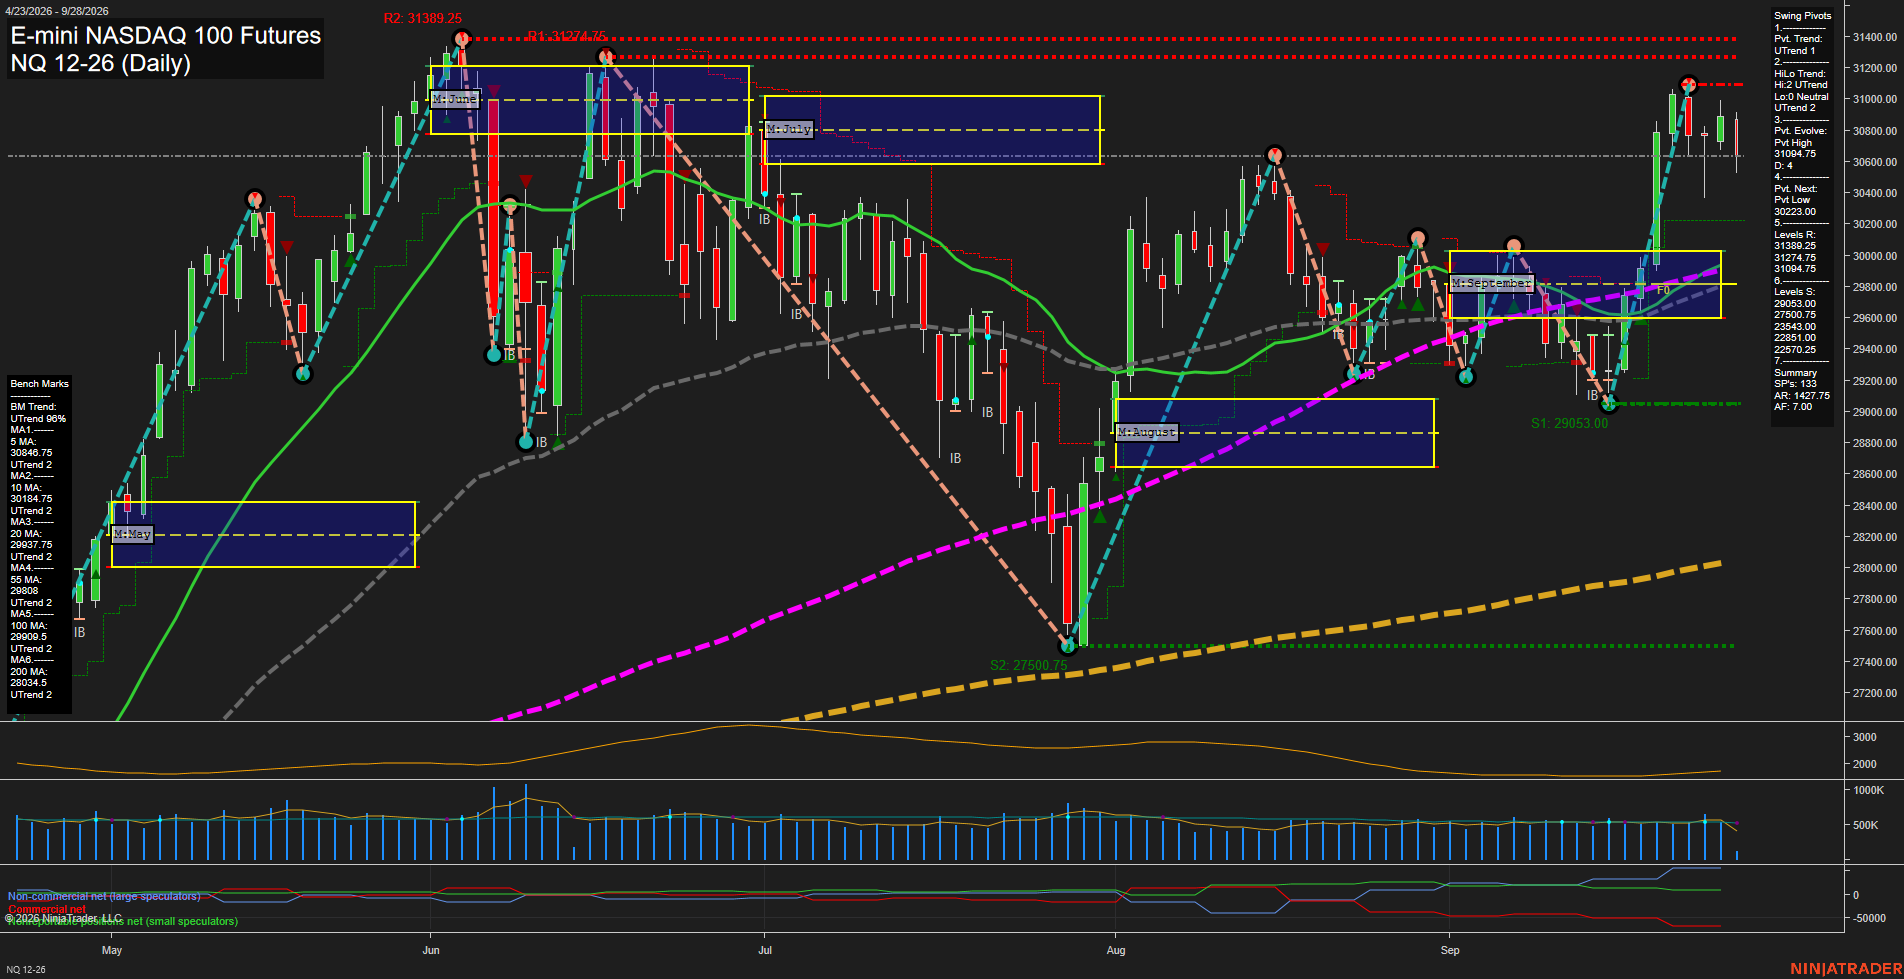
Overall Rating
- Short-Term: Neutral
- Intermediate-Term: Bullish
- Long-Term: Bullish.
Key Insights Summary
NQ remains in a constructive intermediate and long-term recovery structure, supported by the rising 10, 20, 55, 100, and 200-day benchmarks, the positive monthly and yearly Fib-grid positioning, and an intermediate UTrend pivot sequence. Short-term conditions are mixed: price is below the declining 5-day benchmark and below the weekly F0% area, while the latest TR120 signal is short. The recent rally tested the 31094.75 pivot-high area and encountered rejection, leaving 30223.00 as the next pivot-reversal reference. Price action is consolidating beneath 31094.75 resistance, with 31274.75 and 31389.25 forming the higher resistance band; 29053.00 remains the principal swing support below the current range.
View charts on: AlphaWebTrader HTF Charts
CL Daily View
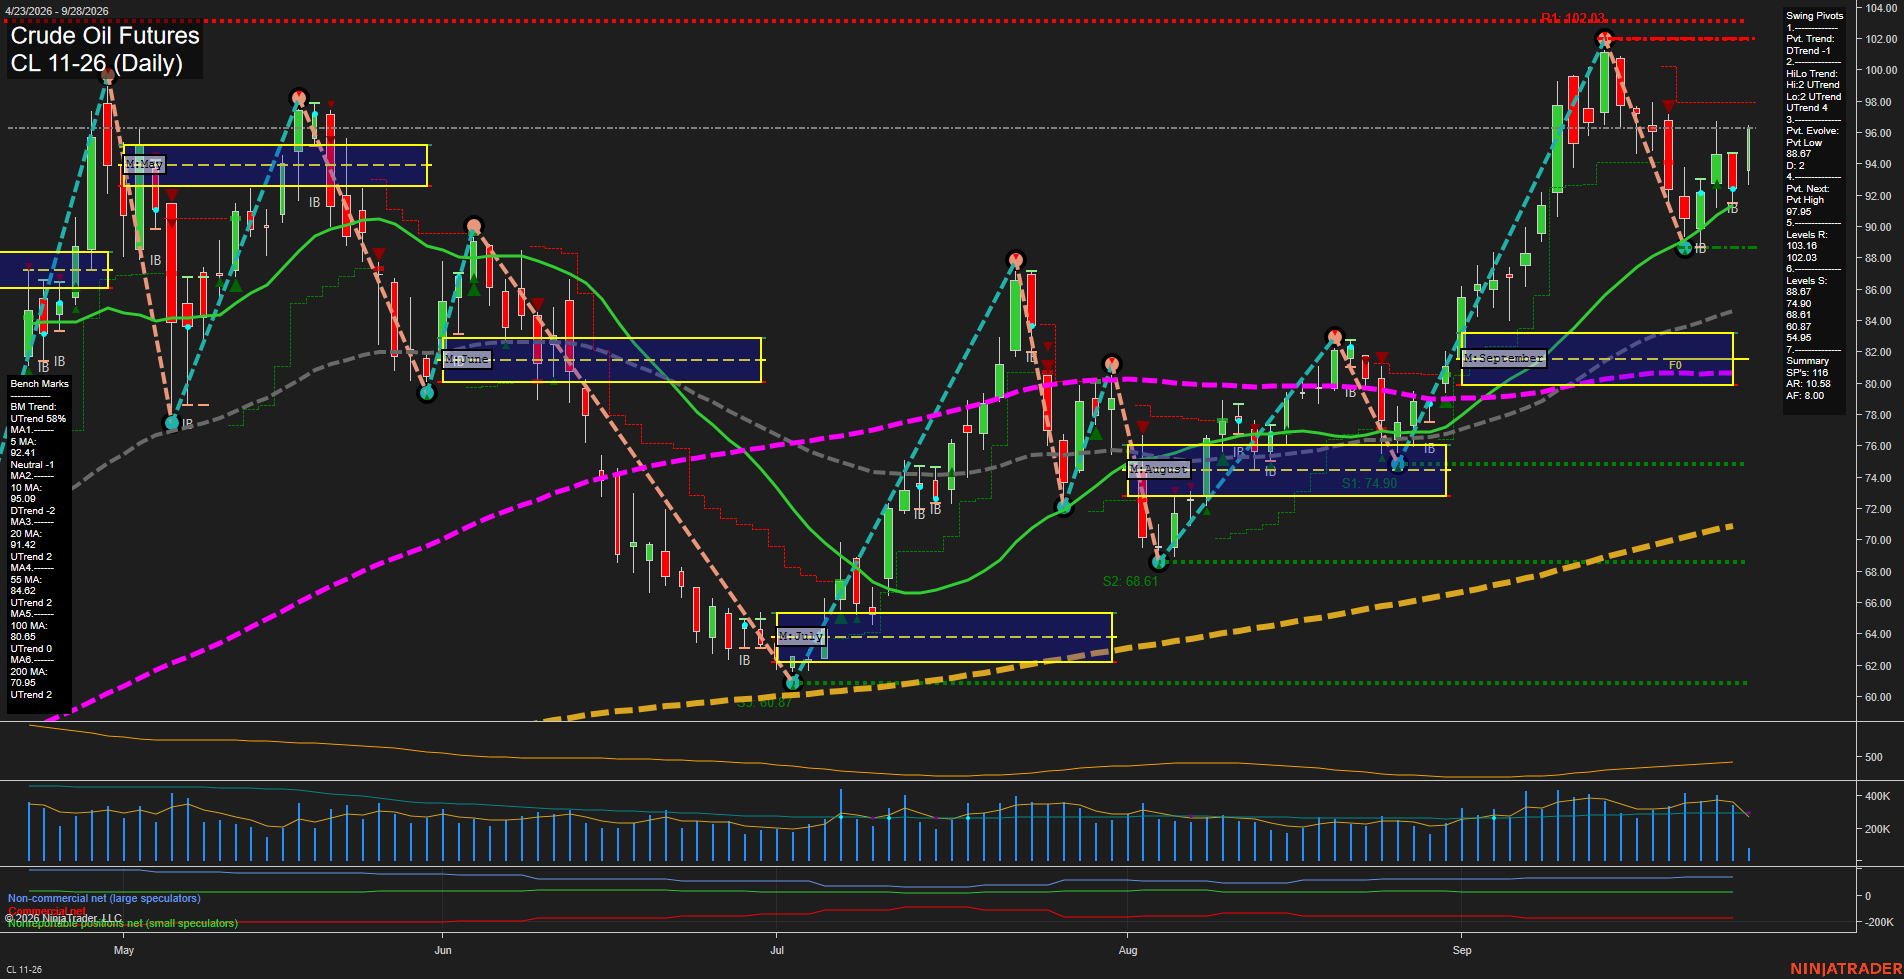
Overall Rating
- Short-Term: Neutral
- Intermediate-Term: Bullish
- Long-Term: Bullish.
Key Insights Summary
Price remains above the weekly, monthly, and yearly Fib-grid reference levels, while the 20-, 55-, 100-, and 200-day benchmarks retain rising trends. The intermediate and long-term structure remains a higher-low recovery from the August low, but the short-term pivot state is in a downswing following rejection from the 102.03 resistance area. The current retracement has held well above the 88.67 pivot support and near the rising 20-day average, leaving the market in a bullish broader trend with a near-term consolidation and pullback phase. A move through 97.95 would define a renewed short-term pivot high, while 102.03 remains the dominant overhead swing resistance.
View charts on: AlphaWebTrader HTF Charts
GC Daily View
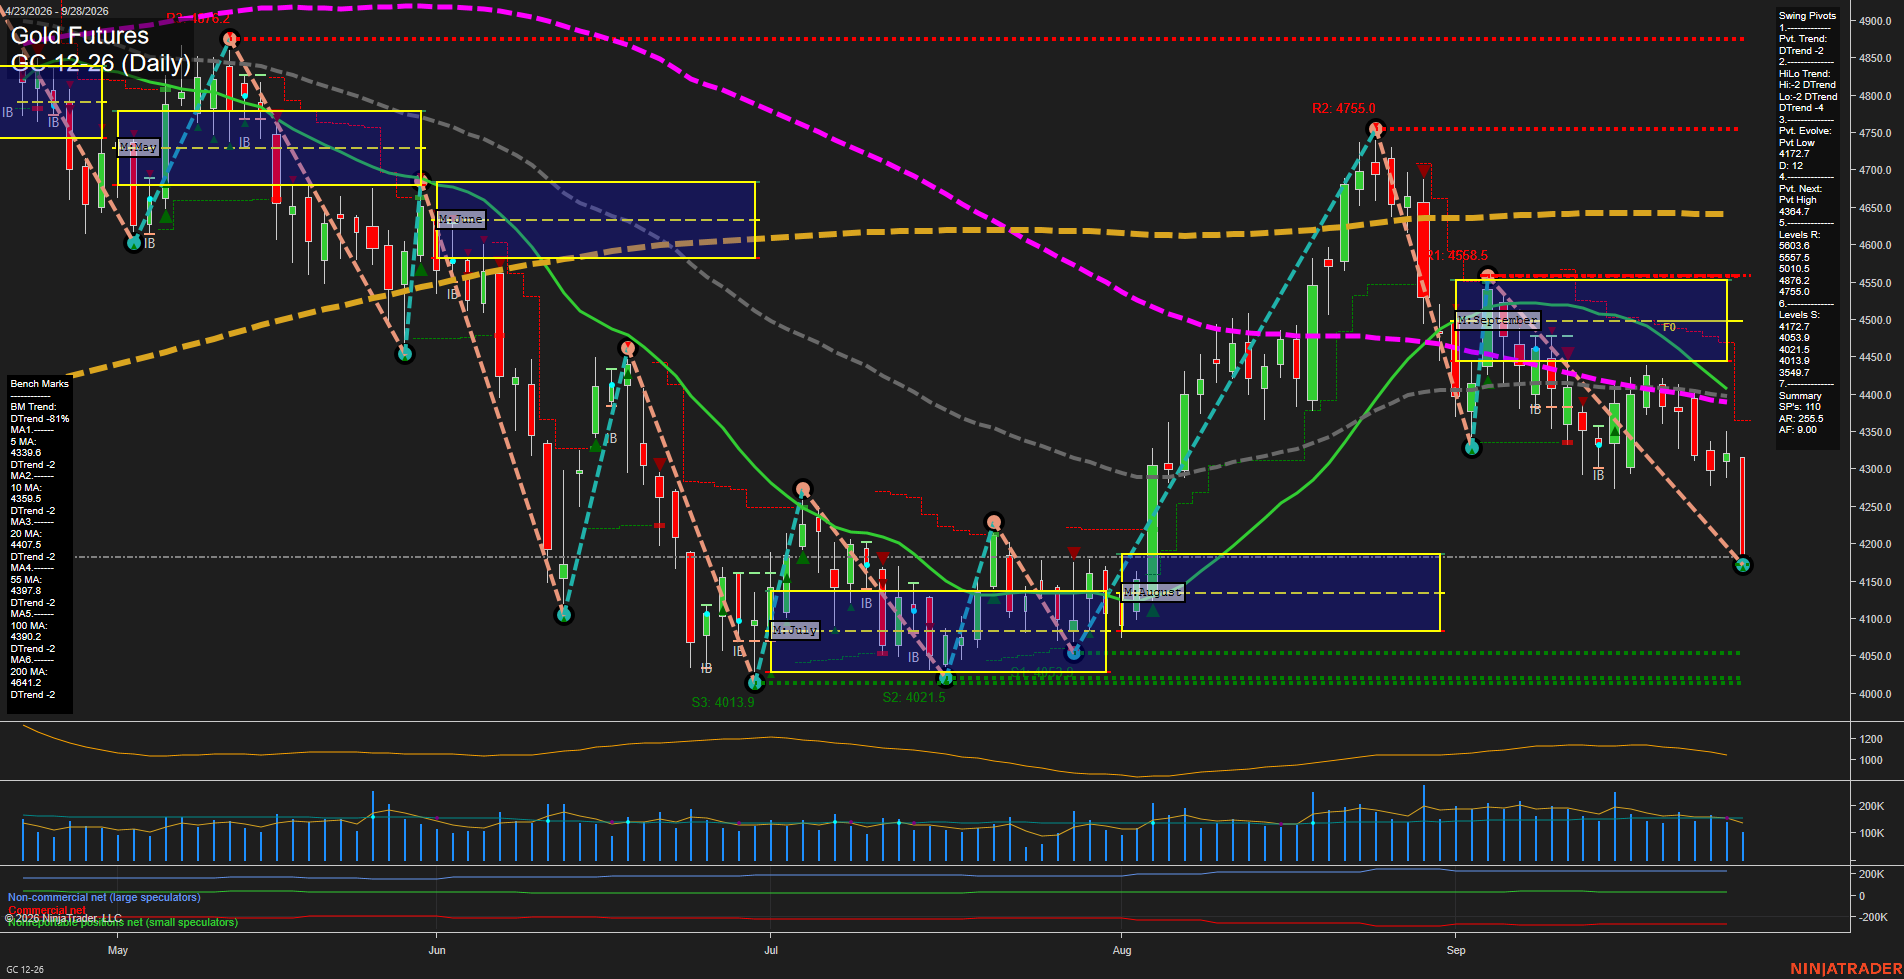
Overall Rating
- Short-Term: Bearish
- Intermediate-Term: Bearish
- Long-Term: Bearish.
Key Insights Summary
Gold futures show broad bearish alignment across the weekly, monthly, and yearly Fib grids, pivot structure, and all six benchmark moving averages. Price has broken sharply lower on a large, high-momentum daily bar and is establishing a new pivot low near 4172.7, while the next opposite pivot threshold is materially higher at 4364.7. The decline follows a lower-high sequence from the 4755.0 pivot high, with 4053.9 through 4013.9 forming the nearest lower support cluster. Elevated ATR reflects an expanded volatility regime, while price remains below the monthly F0% area and the 20-, 55-, 100-, and 200-day benchmarks, reinforcing a dominant downside swing-cycle structure.
View charts on: AlphaWebTrader HTF Charts
ZB Daily View
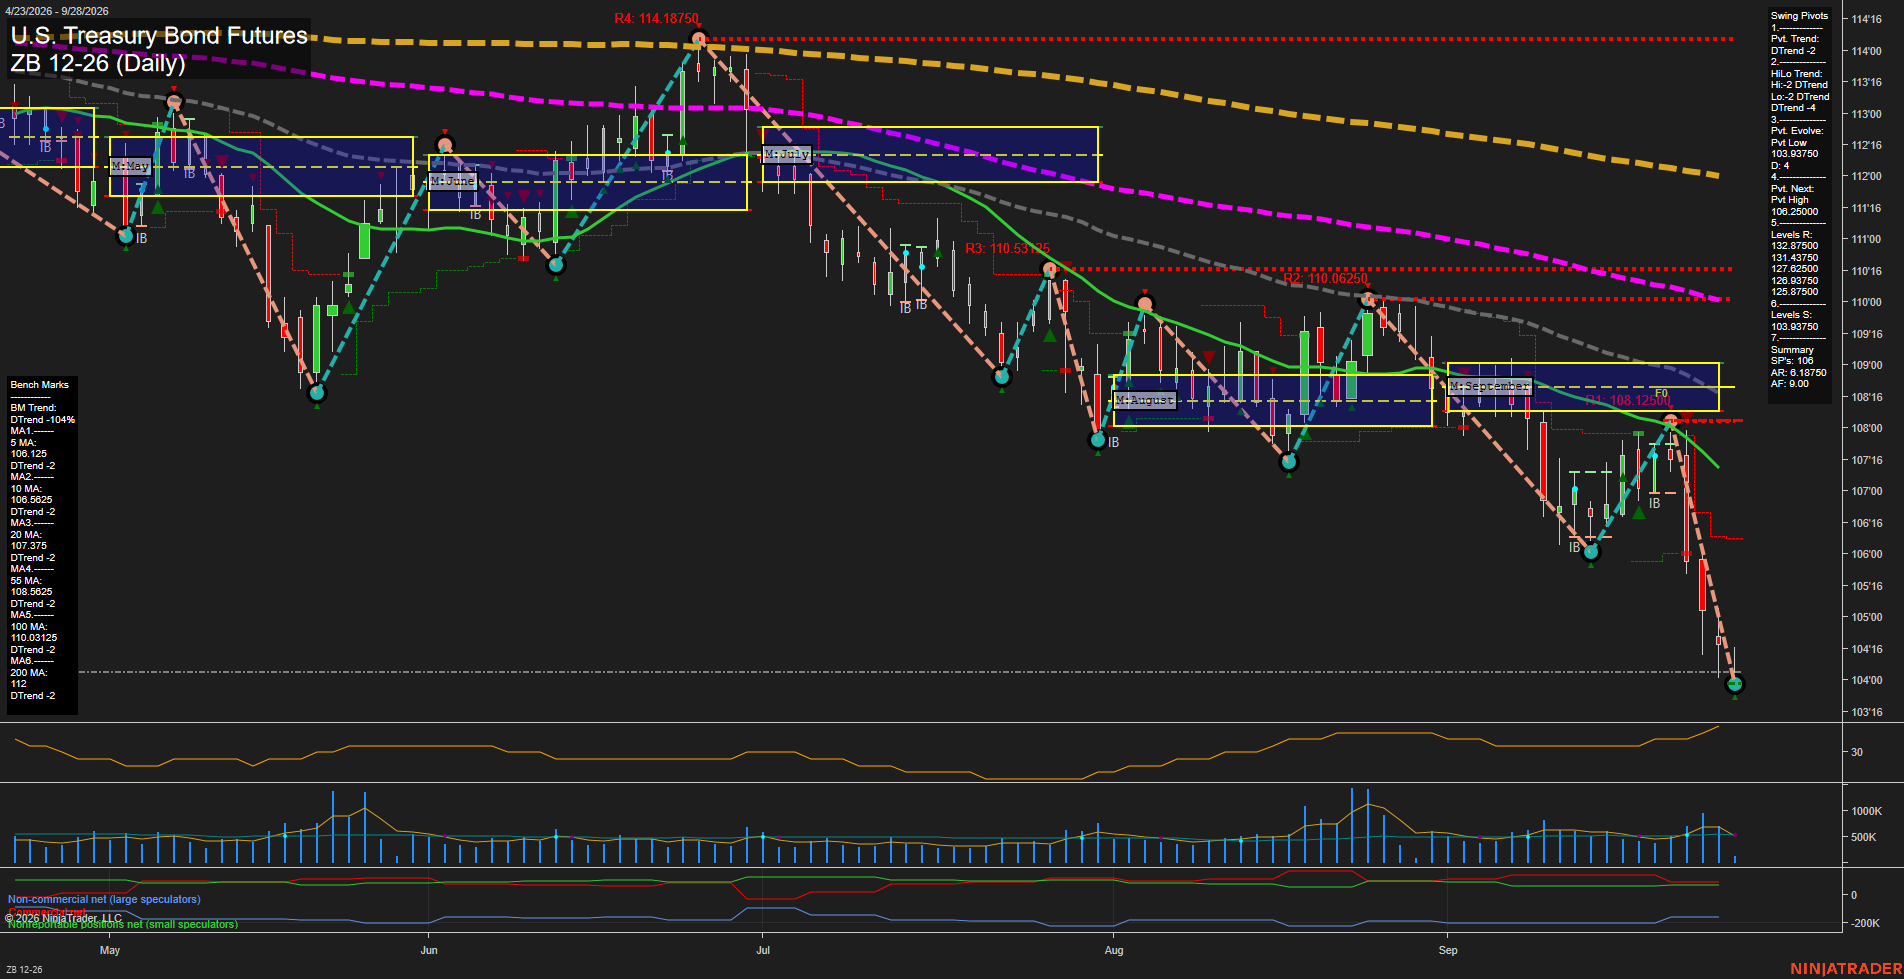
Overall Rating
- Short-Term: Bearish
- Intermediate-Term: Bearish
- Long-Term: Bearish.
Key Insights Summary
ZB remains in a broad and accelerating daily downtrend, with large-range selling bars and fast downside momentum extending price materially beneath the September MSFG/NTZ area and all six declining benchmark averages. Pivot structure is bearish across both short- and intermediate-term measures, with the latest evolving pivot low near 103.900 reflecting continuing lower-low behavior. Recent short-, weekly-, monthly-, and long-term trend signals remain aligned to the downside. The broken 106.000-106.18750 support zone is now overhead, while the next defined pivot reversal threshold is substantially higher at 108.2500; ATR expansion and elevated volume activity confirm a high-volatility directional decline rather than a stable consolidation.
View charts on: AlphaWebTrader HTF Charts