Futures show S&P 500 and Nasdaq consolidating near highs as Dow, small caps, Europe and Canada face pressure amid rising yields and oil risks.
Fundamentals: U.S. equity indexes remain near record levels, supported by mega-cap technology and AI-linked shares despite weak market breadth. Treasury yields have climbed on strong data, hawkish Federal Reserve commentary and weak Treasury demand, while Strait of Hormuz disruption continues to shape oil, shipping and fuel-cost conditions.
Technicals: U.S. index futures show broadly bullish higher-timeframe structure in the S&P 500 and Nasdaq, though both are consolidating beneath nearby resistance after sharp recoveries. Dow, small-cap, Canadian and German contracts retain varying degrees of short-term corrective pressure, while longer-term trend conditions remain more constructive in several markets.
Market Week Ahead – Trading 360° view Market Radar for: holidays, earnings, eco-news, market-news summary, news sentiment, and major ETFs, MAG7, Higher Time Frame Analysis Indices Futures Summary, and ETF SPY S&P500, QQQ Tech, USO Oil, GLD Gold Weekly Chart analysis
As of: September 27, 2026 06:15 CT
Earnings Radar
Monitoring for earnings releases by the Magnificent 7, AI-tech-related firms, and major financial institutions.
- MU Release: 2026-09-30 T:AMC
Conclusion: Micron (MU) reports after the close on 2026-09-30, placing semiconductor and AI-memory earnings in focus for index futures around the release. Market momentum and volume can slow ahead of this major semiconductor earnings event.
For full details visit: Yahoo Earnings Calendar
EcoNews Radar U.S. Events
| Day | Time | Impact | Event |
|---|---|---|---|
| Tue | 10:00 | Medium | CB Consumer Confidence |
| Tue | 10:00 | Medium | JOLTS Job Openings |
| Wed | 08:15 | Medium | ADP Non-Farm Employment Change |
| Wed | 08:30 | High | Core PCE Price Index m/m |
| Wed | 08:30 | High | Final GDP q/q |
| Wed | 08:30 | Medium | Final GDP Price Index q/q |
| Wed | 10:30 | Low | Crude Oil Inventories |
| Thu | 08:30 | Medium | Unemployment Claims |
| Thu | 10:00 | Medium | FOMC Member Waller Speaks |
| Thu | 10:00 | Medium | ISM Manufacturing PMI |
| Fri | 08:30 | High | Average Hourly Earnings m/m |
| Fri | 08:30 | High | Non-Farm Employment Change |
| Fri | 08:30 | High | Unemployment Rate |
EcoNews Summary
The week centers on high-impact U.S. inflation, growth, and labor-market releases. Wednesday’s 08:30 Core PCE Price Index and Final GDP reports concentrate major inflation and economic-growth information. Friday’s 08:30 labor releases, led by Non-Farm Employment Change, provide the week’s most significant scheduled labor-market update.
Event Notes:
- Wednesday 08:30 – Core PCE Price Index m/m: Measures the monthly change in prices for goods and services excluding food and energy. It is monitored as a core inflation gauge.
- Wednesday 08:30 – Final GDP q/q: Measures the final quarterly annualized change in U.S. economic output. Traders monitor it for confirmation of economic growth conditions.
- Friday 08:30 – Average Hourly Earnings m/m: Measures the monthly change in employee pay. It is monitored for wage-inflation conditions.
- Friday 08:30 – Non-Farm Employment Change: Measures the monthly change in U.S. employment outside farm work. It is monitored as a broad indicator of labor-market strength.
- Friday 08:30 – Unemployment Rate: Measures the percentage of the labor force without work and actively seeking employment. It is monitored for labor-market slack and employment conditions.
Conclusion:
The single most important event is Friday at 08:30, the USD Non-Farm Employment Change release, alongside Average Hourly Earnings and the Unemployment Rate. Market momentum and volume often slow ahead of major PCE and GDP releases, with increased volatility at release time.
For full details visit: Forex Factory EcoNews
Market News Summary:
Index futures face cross-currents from surging Treasury yields, narrow equity leadership, and continuing Strait of Hormuz uncertainty.
Primary Drivers & Risks:
- Primary Driver: Treasury yields at multi-year highs
- Primary Risk: Hormuz disruption and narrow market breadth
Tone:
Cautious, with equity resilience concentrated in mega-cap technology.
Stock Market / ETFs / Indices:
Major U.S. indexes remain near records despite weak breadth: roughly three-quarters of S&P 500 members traded below their 50-day moving averages. Mega-cap, AI-linked companies continue to support the S&P 500 and Nasdaq-100, while concentration risk remains prominent. Equal-weight exposure carries different sensitivity to the yield curve and broader economic conditions.
Geopolitical:
President Trump rejected Iran’s proposal to reopen the Strait of Hormuz and resume negotiations. U.S. officials stated that options regarding Iran remain open, keeping the conflict and shipping disruption in focus.
Oil / Energy:
WTI and Brent fell more than 2% on truce discussions, but Hormuz traffic remained well below normal. Fuel costs, U.S. supply, Chinese demand, and constrained shipping remain key oil-market inputs.
Fed / Financials:
Treasury yields rose sharply on higher real rates, strong economic data, hawkish Federal Reserve commentary, and weak Treasury demand. The two-year yield reached its highest level since May 2024, while the 10-year approached 2007 highs and the 30-year neared two-decade highs. Long-duration Treasury losses have persisted as investors await a rate reversal.
Macro / Other:
U.S. investment growth, particularly in technology, is supporting stronger growth relative to Europe. AI infrastructure also faces operational and regulatory concerns, including reported power-delivery issues at a major data-center project and renewed attention to AI safety.
Conclusion:
Elevated Treasury yields and mega-cap AI strength are the main opposing forces for U.S. equity indexes. Headline indexes remain resilient despite concentrated leadership and weak internal breadth.
Hormuz-related geopolitical uncertainty continues to affect oil and fuel-cost conditions. Rising rates, energy disruption, AI infrastructure issues, and new tariff measures add cross-currents.
Market News Sentiment
Market News Articles: 10
- Negative: 50.00%
- Positive: 30.00%
- Neutral: 20.00%
Sentiment Summary: Market news sentiment is mixed-to-negative, with 50% negative, 30% positive, and 20% neutral coverage across 10 articles.
Conclusion: The news flow carries a net negative tone for indices futures day traders, while positive and neutral coverage remains present.
No stock-related news items found.
Sentiment Summary: No stock-related news items were identified, leaving market sentiment neutral based on the available data.
Conclusion: The snapshot provides no news-driven directional signal for indices futures day traders.
USO,Oil Articles: 1
- Negative: 100.00%
Sentiment Summary: USO and oil coverage was 100% negative across 1 article.
Conclusion: The limited oil news sample carried uniformly negative sentiment, indicating a negative tone in this commodity-related input for indices futures traders.
SPY Weekly View
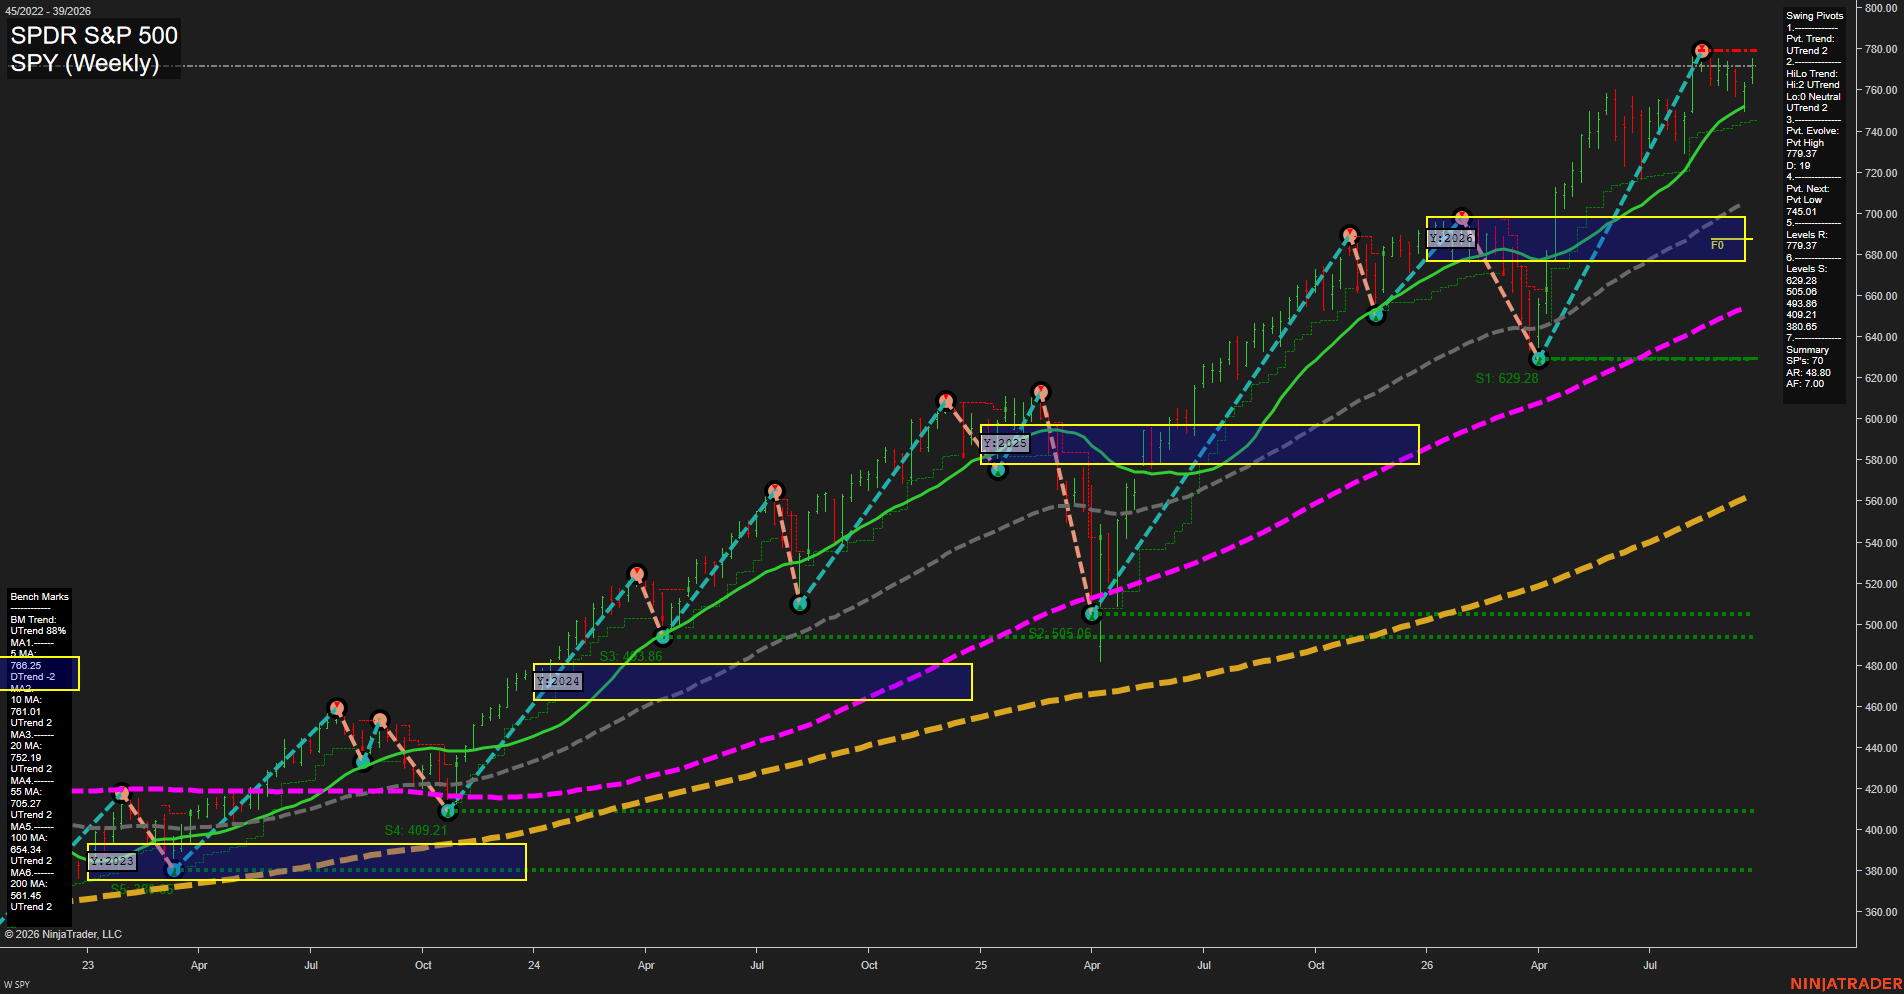
Overall Rating
- Short-Term: Bullish
- Intermediate-Term: Bullish
- Long-Term: Bullish.
Key Insights Summary
For a futures swing-trader market-structure view, the SPY weekly chart reflects a broad bullish ES-equivalent trend: price is holding above all rising intermediate- and long-term benchmarks while both pivot trend measures remain in UTrend. The market is consolidating near the 779.37 pivot high with smaller weekly bars and slower momentum, indicating an extended advance transitioning into a tighter high-level balance rather than a confirmed reversal. The 745.01 pivot-next level defines the nearest structural downside reversal point, while 779.37 remains the immediate breakout reference. The yearly NTZ/F0% area near the upper-680s is well below current price, reinforcing the strength of the larger trend and identifying the prior consolidation zone as a major longer-term support region.
View charts on: AlphaWebTrader HTF Charts
QQQ Weekly View
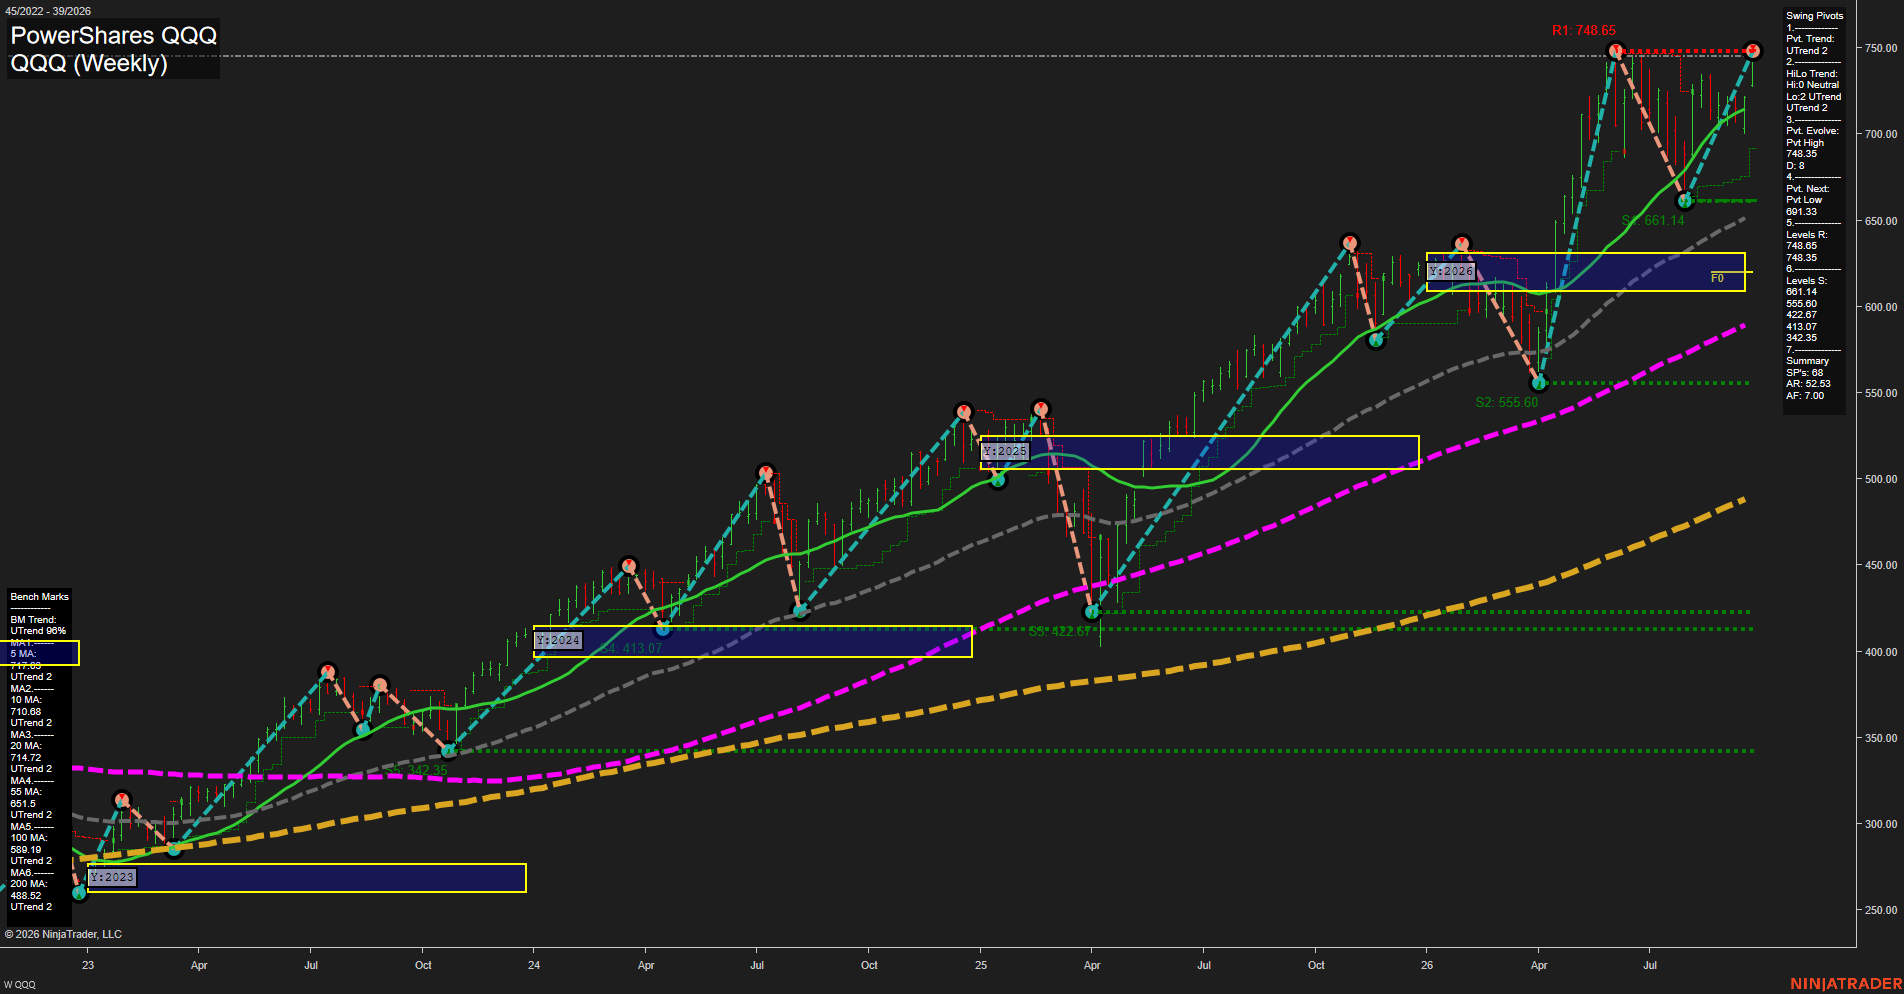
Overall Rating
- Short-Term: Neutral
- Intermediate-Term: Bullish
- Long-Term: Bullish.
Key Insights Summary
QQQ is pressing the 748.35 pivot-high resistance area after a strong weekly advance, while the short-term pivot measure remains in DTrend because a confirmed new high has not yet developed. From a futures swing-trader perspective, this is a high-level consolidation beneath resistance rather than a broad trend failure: the intermediate HiLo structure remains UTrend, price is materially above all rising benchmark averages, and the yearly grid position remains bullish above its NTZ. The 691.14 to 661.14 area defines the nearest meaningful weekly structural support zone; a rotation into that area would represent a retracement within the larger rising trend, while sustained trade above 748.35 would resolve the present compression into continuation territory.
View charts on: AlphaWebTrader HTF Charts
USO Weekly View
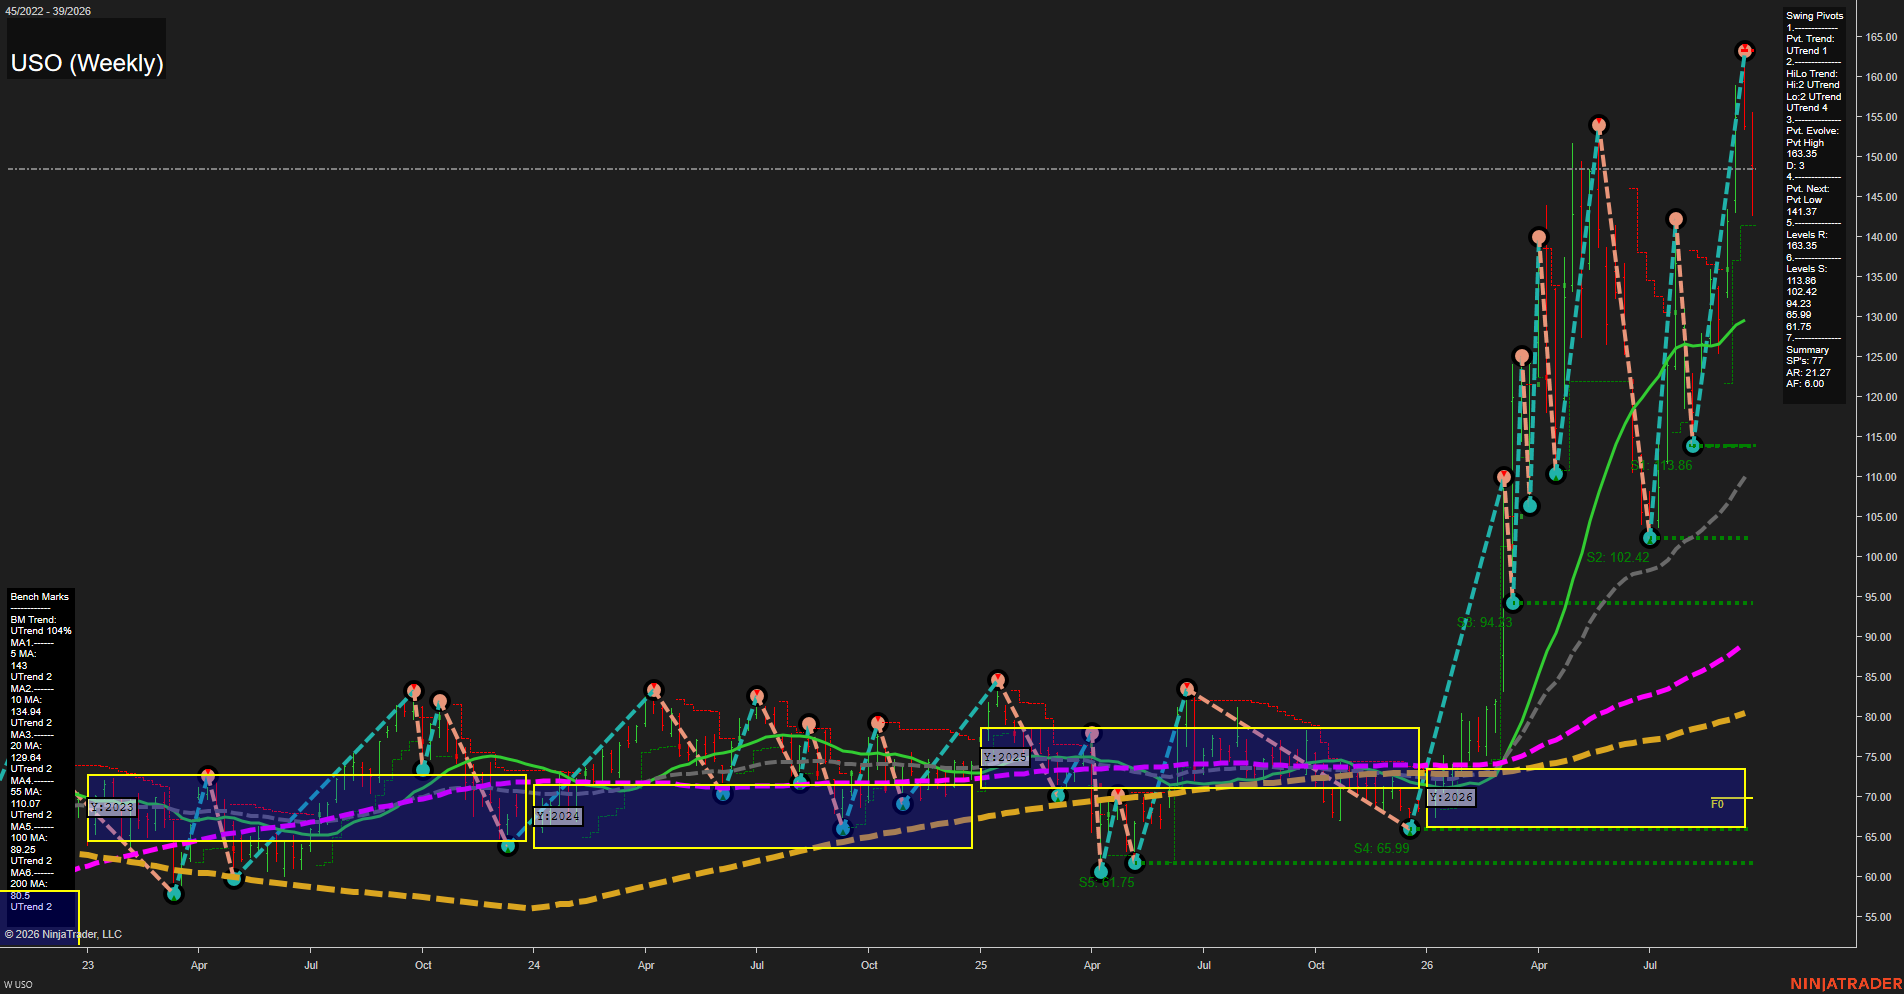
Overall Rating
- Short-Term: Bullish
- Intermediate-Term: Bullish
- Long-Term: Bullish.
Key Insights Summary
USO reflects a powerful futures-style momentum expansion, with price holding well above every rising weekly benchmark and the pivot structure maintaining higher highs and higher lows. The current advance is extended above the yearly F0%/NTZ area and has accelerated toward the 163.35 pivot-high resistance. The 141.37 pivot-low reversal level is the nearest structural reference beneath price; a rotation below it would mark a meaningful short-term character change, while the broader intermediate and long-term trend structure remains firmly positive.
View charts on: AlphaWebTrader HTF Charts
GLD Weekly View
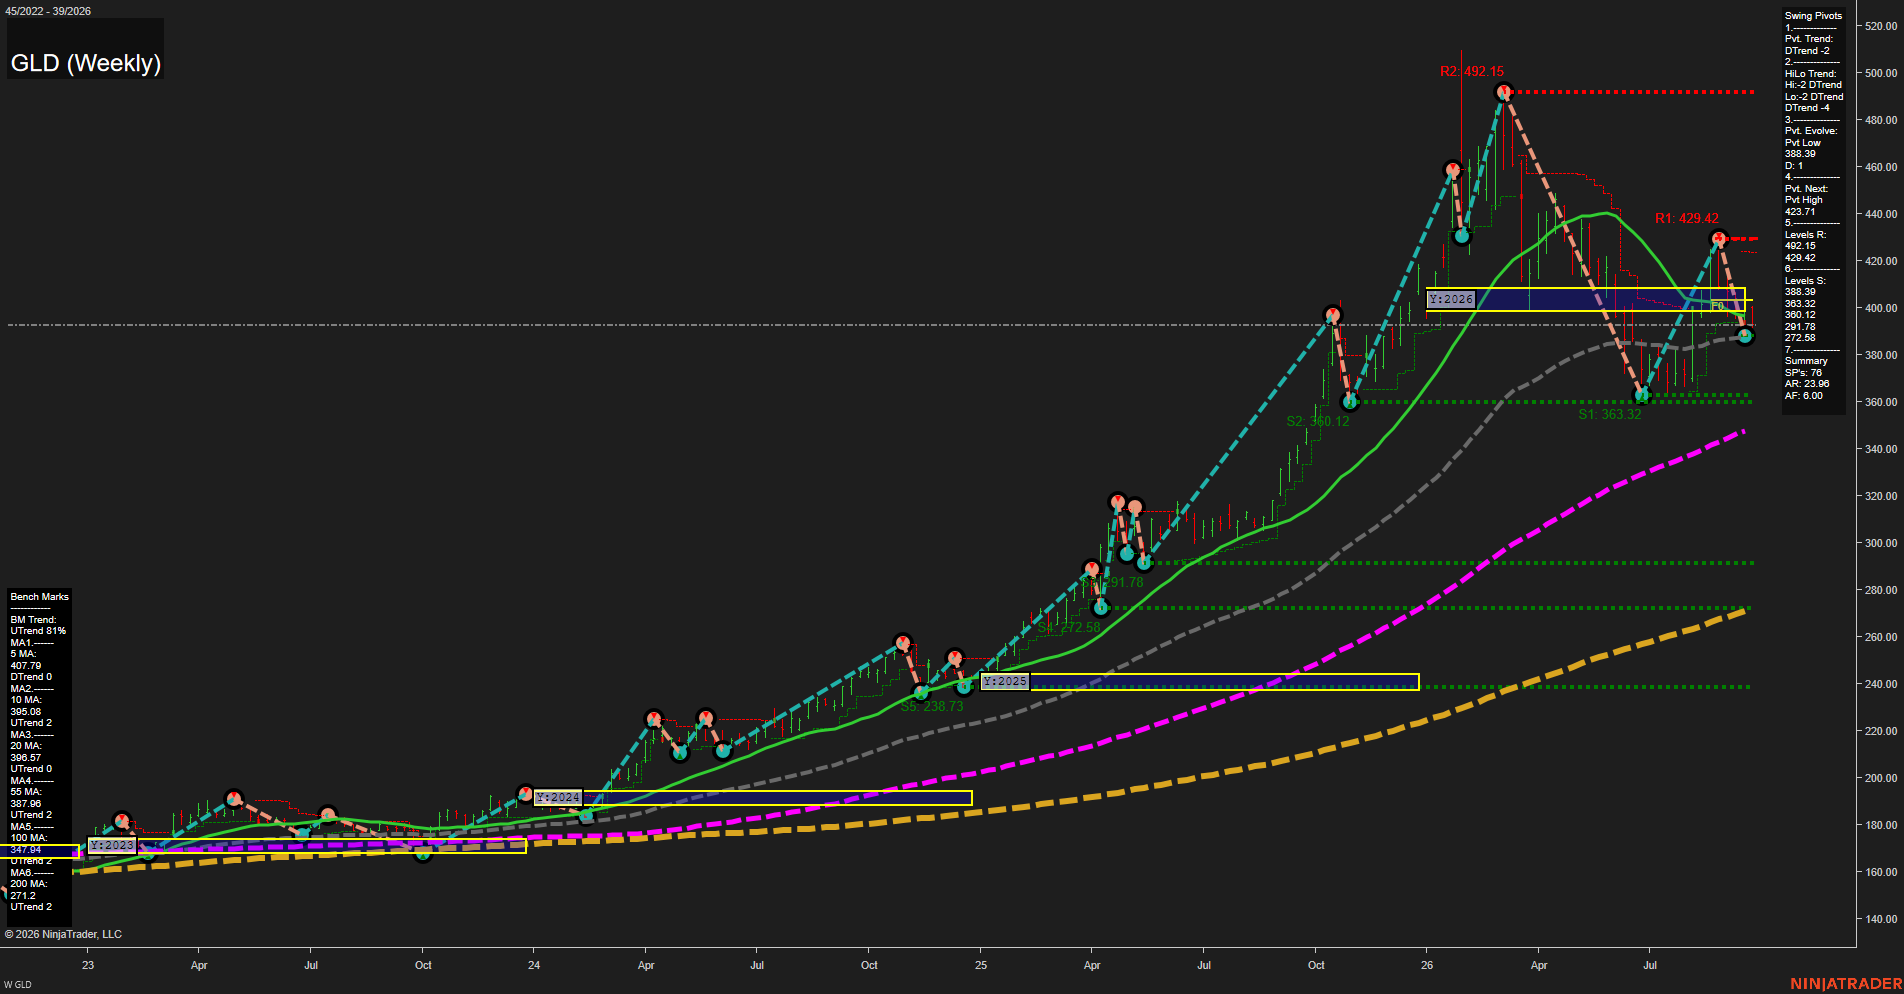
Overall Rating
- Short-Term: Bearish
- Intermediate-Term: Bullish
- Long-Term: Bullish.
Key Insights Summary
GLD reflects a futures-style corrective swing within a much larger bullish gold trend. Price has declined from the 429.42 pivot-high resistance area into the active 388.39 pivot-low area, producing a short-term DTrend and fast downside momentum. The 20-week benchmark at 396.57 and 10-week benchmark at 395.08 now form nearby overhead pressure, while the rising 55-week average at 387.96 aligns closely with current price. The broader structure remains constructive because price is materially above the rising 100-week and 200-week averages, but the weekly pivot sequence remains corrective unless price re-establishes a higher swing high through 423.71. A sustained loss of 388.39 would expose the 363.32 support zone, while recovery above 429.42 would restore the prior upside swing structure toward 492.15.
View charts on: AlphaWebTrader HTF Charts
ZB Weekly View
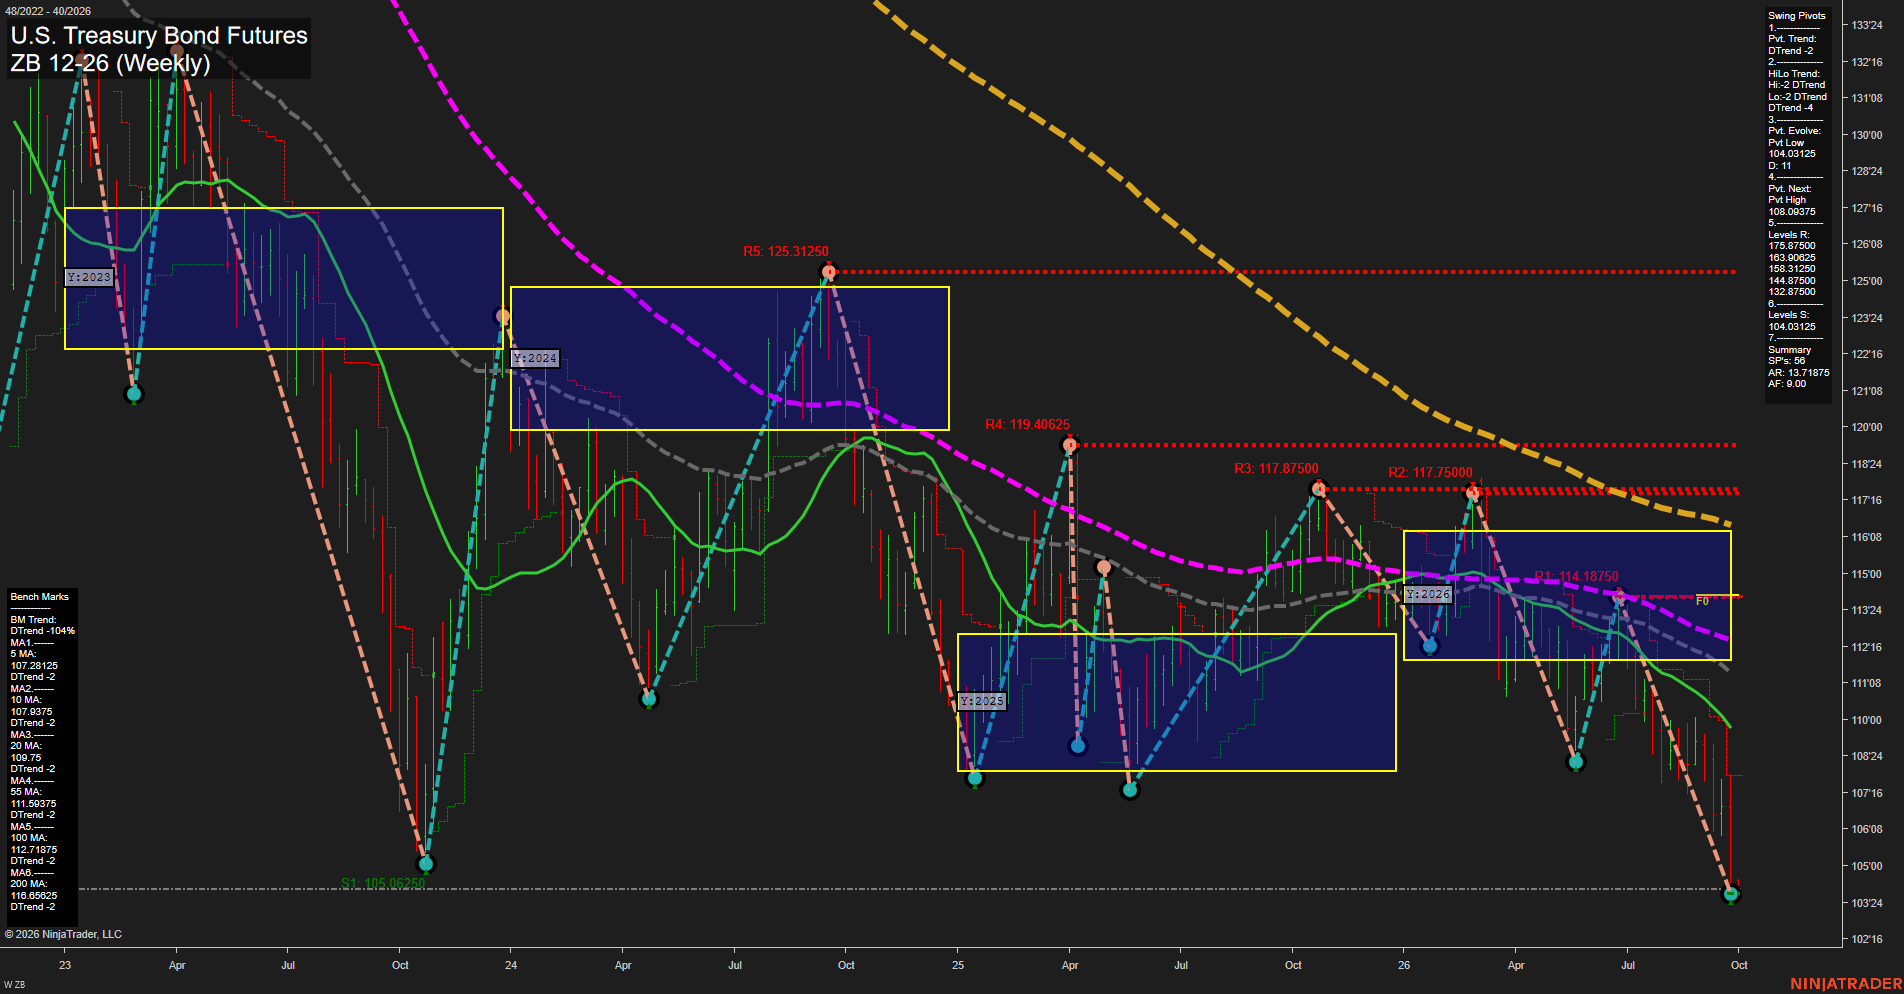
Overall Rating
- Short-Term: Bearish
- Intermediate-Term: Bearish
- Long-Term: Bearish.
Key Insights Summary
ZB remains in a broad weekly decline, with price extending below the 2026 yearly NTZ and F0% area while trading beneath every benchmark moving average. The pivot structure is firmly bearish across both short-term and intermediate-term readings, marked by lower highs and a newly evolving low near 104-00. The 5-, 10-, 20-, 55-, 100-, and 200-period averages are aligned downward, confirming persistent downside trend pressure. The 104-00/104-01 area is the nearest pivot support reference, while 108-09 is the reversal threshold required to establish the next pivot high. Current action reflects a fast downside swing rather than a balanced consolidation, with rallies remaining counter-trend beneath declining moving-average resistance.
View charts on: AlphaWebTrader HTF Charts