U.S. stocks closed lower as Treasury yields and crude oil stayed elevated amid Middle East tensions, weakening breadth and pressuring gold and silver.
Fundamentals: U.S. equities ended lower as elevated Treasury yields and crude oil prices weighed on risk appetite amid continuing Middle East conflict concerns. The Nasdaq declined while market breadth remained weak, with equal-weight and small-cap benchmarks under pressure. Gold and silver fell as bond yields rose, while financial-sector dealmaking and trading activity offered a limited offset.
Technicals: Market action at the NYSE close reflected mixed ETF performance, with NVDA and USO higher while TSLA, GLD and META declined. ES and NQ retained bullish intermediate and long-term structures despite consolidation near resistance. YM, EMD, RTY and FDAX remained in short-term corrective downswings, with several markets testing key pivot or moving-average support zones.
After Market Close daily snapshot: market news summary and sentiment, major ETFs, Magnificent 7 analysis, Indices Futures Higher Time Frame Analysis, and E-mini S&P500, Nasdaq 100, NYMEX Crude, Gold Futures Daily Chart analysis.
As of: September 28, 2026 05:00 CT
Market News Summary:
U.S. equities weakened as Treasury yields and crude oil remained elevated amid Middle East conflict risks.
Primary Drivers & Risks:
- Primary Driver: Rising Treasury yields and crude
- Primary Risk: Middle East energy supply disruption
Tone:
Risk-off, with rate and energy pressures weighing on equities.
Stock Market / ETFs / Indices:
U.S. stocks declined, with the Nasdaq Composite down more than 150 points late Monday as the Treasury selloff deepened. The S&P 500 remained near highs but showed weak breadth, with nearly half of constituents exhibiting negative beta and equal-weight and small-cap benchmarks having broken down in September. Equity-index volatility stayed broadly steady, while single-stock volatility increased.
Geopolitical:
Peace talks in the Middle East suffered a setback, and President Trump rejected an Iranian proposal. The ongoing U.S.-Israeli conflict with Iran remained a central source of energy-market and economic uncertainty.
Oil / Energy:
Higher crude prices were linked to supply-shock concerns and sustained pressure on Treasury yields. U.K. diesel prices reached record highs, U.S. diesel prices stood at $6.45, distillate inventories were near seasonal lows, and the U.S. Strategic Petroleum Reserve fell to its lowest level since 1982.
Gold / Metals:
Gold fell more than 3% as the global bond selloff and higher yields pressured precious metals. Silver also declined, approaching a key technical level near $60 per ounce, while China remained on pace for sharply higher gold imports in 2026.
Fed / Financials:
The 10-year Treasury yield reached 5% earlier in the month and yields approached 5.2% before Monday trading, extending a two-decade-high rate environment. Higher yields pressured risk assets, though Jefferies reported stronger quarterly profit from deal activity and equities trading.
Macro / Other:
A planned $15 billion Iowa steel plant highlighted industrial investment activity. Aviation groups urged Congress to approve $30 billion for air-traffic-control and airport upgrades, while the FAA delayed Boeing 737 MAX 10 approval over a software glitch.
Conclusion:
Elevated Treasury yields and crude oil prices drove the session’s pressure on index futures and cash equities. Weak market breadth and technology sensitivity to rates remained important equity-market factors.
Middle East tensions intensified the energy and inflation cross-current. Falling gold and silver prices reflected the impact of higher yields, while financial-sector trading and deal activity provided a limited offset.
Market News Sentiment
Market News Articles: 38
- Neutral: 47.37%
- Positive: 28.95%
- Negative: 23.68%
Sentiment Summary: Among 38 market news articles, 47% were neutral, 29% positive, and 24% negative, indicating predominantly balanced coverage with a modest positive skew over negative items.
Conclusion: Indices futures news tone was largely neutral, with positive coverage exceeding negative coverage by 5 percentage points.
GLD,Gold Articles: 14
- Negative: 64.29%
- Positive: 21.43%
- Neutral: 14.29%
Sentiment Summary: Gold-related coverage is predominantly negative, with 64% negative, 21% positive, and 14% neutral articles across 14 items.
Conclusion: The snapshot indicates negative sentiment toward gold, which may be relevant as a cross-market risk-sentiment reference for indices futures day traders.
USO,Oil Articles: 12
- Positive: 41.67%
- Negative: 33.33%
- Neutral: 25.00%
Sentiment Summary: USO/Oil coverage was mixed, with 42% positive, 33% negative, and 25% neutral articles.
Conclusion: Oil-related news tone was moderately positive overall, with meaningful negative coverage remaining relevant for indices futures traders.
Market Data Snapshot
ETF Snapshot of major stock market ETFs, Mag7, and others as of: September 28, 2026 05:00
Top Movers & Losers
- NVDA 228.86 Bullish 1.68% ▲
- USO 150.01 Bullish 1.13% ▲
- GOOG 339.16 Bearish -0.56% ▼
- TSLA 357.45 Bearish -3.94% ▼
- GLD 377.91 Bearish -3.94% ▼
- META 715.62 Bearish -4.79% ▼
Major Index ETFs: SPY, QQQ, DIA, IWM, IJH
- DIA 514.02 Bearish -0.67% ▼
- IWM 280.02 Bearish -0.69% ▼
- SPY 765.61 Bearish -0.74% ▼
- IJH 72.44 Bearish -0.75% ▼
- QQQ 736.53 Bearish -1.07% ▼
Major index ETFs were Bearish across the board: QQQ led losses at -1.07%, followed by IJH at -0.75% and SPY at -0.74%. IWM declined -0.69%, while DIA was the least negative mover at -0.67%.
Mag 7 Stocks: AAPL, MSFT, GOOG, AMZN, META, NVDA, TSLA
- NVDA 228.86 Bullish 1.68% ▲
- GOOG 339.16 Bearish -0.56% ▼
- AAPL 338.40 Bearish -0.78% ▼
- MSFT 509.22 Bearish -1.35% ▼
- AMZN 246.15 Bearish -1.41% ▼
- TSLA 357.45 Bearish -3.94% ▼
- META 715.62 Bearish -4.79% ▼
Mixed Mag7 context: NVDA is the most bullish mover at +1.68%, while META is the most bearish mover at -4.79%. Downside breadth includes TSLA at -3.94%, AMZN at -1.41%, MSFT at -1.35%, AAPL at -0.78%, and GOOG at -0.56%.
Cross-Market ETFs: TLT, GLD, USO, IBIT
- USO 150.01 Bullish 1.13% ▲
- IBIT 47.21 Bearish -0.76% ▼
- TLT 78.62 Bearish -0.88% ▼
- GLD 377.91 Bearish -3.94% ▼
Mixed cross-market conditions: USO is the most bullish mover at +1.13%, while GLD is the most bearish mover at -3.94%. TLT is Bearish at -0.88%, and IBIT is Bearish at -0.76%.
ETF, Mag7, and Cross-Market ETF Insights
Overall Tone
Bearish tone: broad equity ETF and Mag7 losses were accompanied by Bearish bonds, gold, and Bitcoin exposure, while oil was the sole Bullish cross-market component.
Equity ETFs and Mag7:
Major Index ETFs were broadly Bearish, led lower by QQQ at -1.07%, while DIA was the least negative mover at -0.67%; SPY declined -0.74%, IJH -0.75%, and IWM -0.69%. Mag7 performance was selective: NVDA was the most bullish mover at +1.68%, while META was the most bearish mover at -4.79%; TSLA and META showed substantial Bearish pressure at -3.94% and -4.79%, respectively.
Cross-Market ETFs:
Cross-market ETFs were mixed, with USO the most bullish mover at +1.13% as TLT, GLD, and IBIT were Bearish. GLD was the most bearish mover at -3.94%, while TLT fell -0.88% and IBIT declined -0.76%, showing commodity strength alongside weakness in bonds, gold, and Bitcoin exposure.
Futures Indices – Higher Time Frame Analysis
Summary of the current state of US Indices Futures based on higher time-frame (HTF) technical analysis as of: 2026-09-28: 17:00 CT.
US Indices Futures
- ES YSFG/MSFG upward, WSFG short below F0%, UTrend pivots, 7906.25 resistance, 7568.25 pivot support, 7668.25 20-week benchmark.
- NQ YSFG/MSFG upward, WSFG down and short signal, UTrend intermediate pivots, 31094.75-31389.25 resistance, 28734.75 reversal level, 27500.75 support.
- YM YSFG upward; MSFG/WSFG down, DTrend short and intermediate pivots, 51479 support, 53387 reversal threshold, 55316 pivot high.
- EMD YSFG upward; MSFG/WSFG below centers, DTrend, 3636.2 pivot support, 3617.1 lower support, 3699.6 resistance, 3830.6 reversal threshold.
- RTY YSFG upward; MSFG/WSFG down, DTrend, 2829.9 pivot support near 2825.1 200-day benchmark, 2911.9 reversal level, 2931.2 resistance.
- FDAX YSFG upward; MSFG/WSFG below F0%, DTrend, 25333-25337 pivot support, 25943-25990 resistance, 26069 reversal threshold.
Overall State
- Short-Term: Bearish
- Intermediate-Term: Bearish
- Long-Term: Bullish
Conclusion
ES and NQ retain intermediate and long-term upward structures, while YM, EMD, RTY, and FDAX maintain short-term DTrend conditions below weekly and monthly Fib-grid references. Broad index correlation remains corrective, with several contracts testing pivot-low support. Yearly Fib-grid positioning and longer-term benchmark alignment remain upward across the group, framing current weakness as retracement activity within predominantly longer-term uptrends.
Note: Intra-day counter-trend pullbacks or retracements may occur, HTF is context for informational usage and market structure. Glossary: Session Fib Grids periods of YSFG:’Yearly’, MSFG:’Monthly’, WSFG:’Weekly’
For full details visit: AlphaWebTrader Technicals
ES Daily View
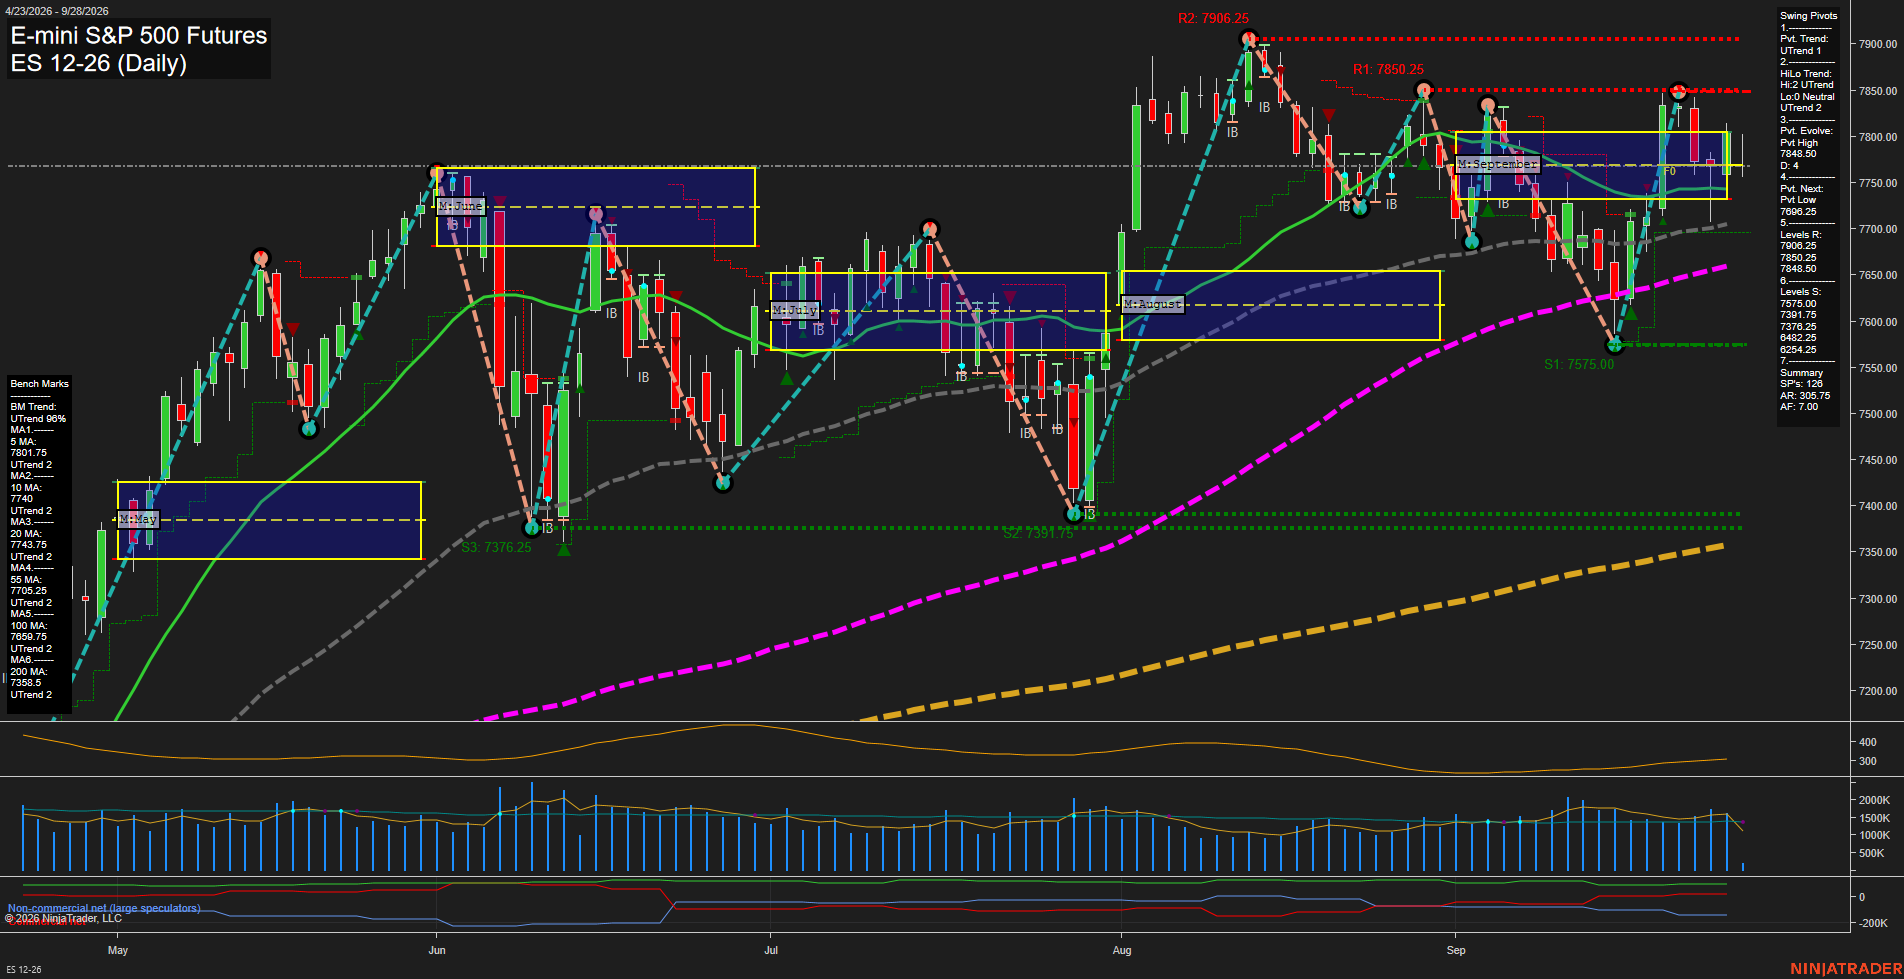
Overall Rating
- Short-Term: Bullish
- Intermediate-Term: Bullish
- Long-Term: Bullish.
Key Insights Summary
The daily structure remains broadly constructive, with price above the rising 10, 20, 55, 100, and 200-day benchmarks and both pivot trend measures aligned upward. The late-September pullback has placed price below the weekly F0% area and beneath the 5-day average, reflecting short-term consolidation and a countertrend weekly bias within the larger advance. The 7848.50 to 7850.25 pivot-resistance band is the immediate overhead supply area, while 7705.25 to 7743.75 clusters the principal moving-average support. The monthly and yearly fib-grid readings remain positive, supporting the intermediate and long-term higher-high/higher-low trend structure despite elevated daily ATR and recent choppy two-way price action.
View charts on: AlphaWebTrader HTF Charts
NQ Daily View
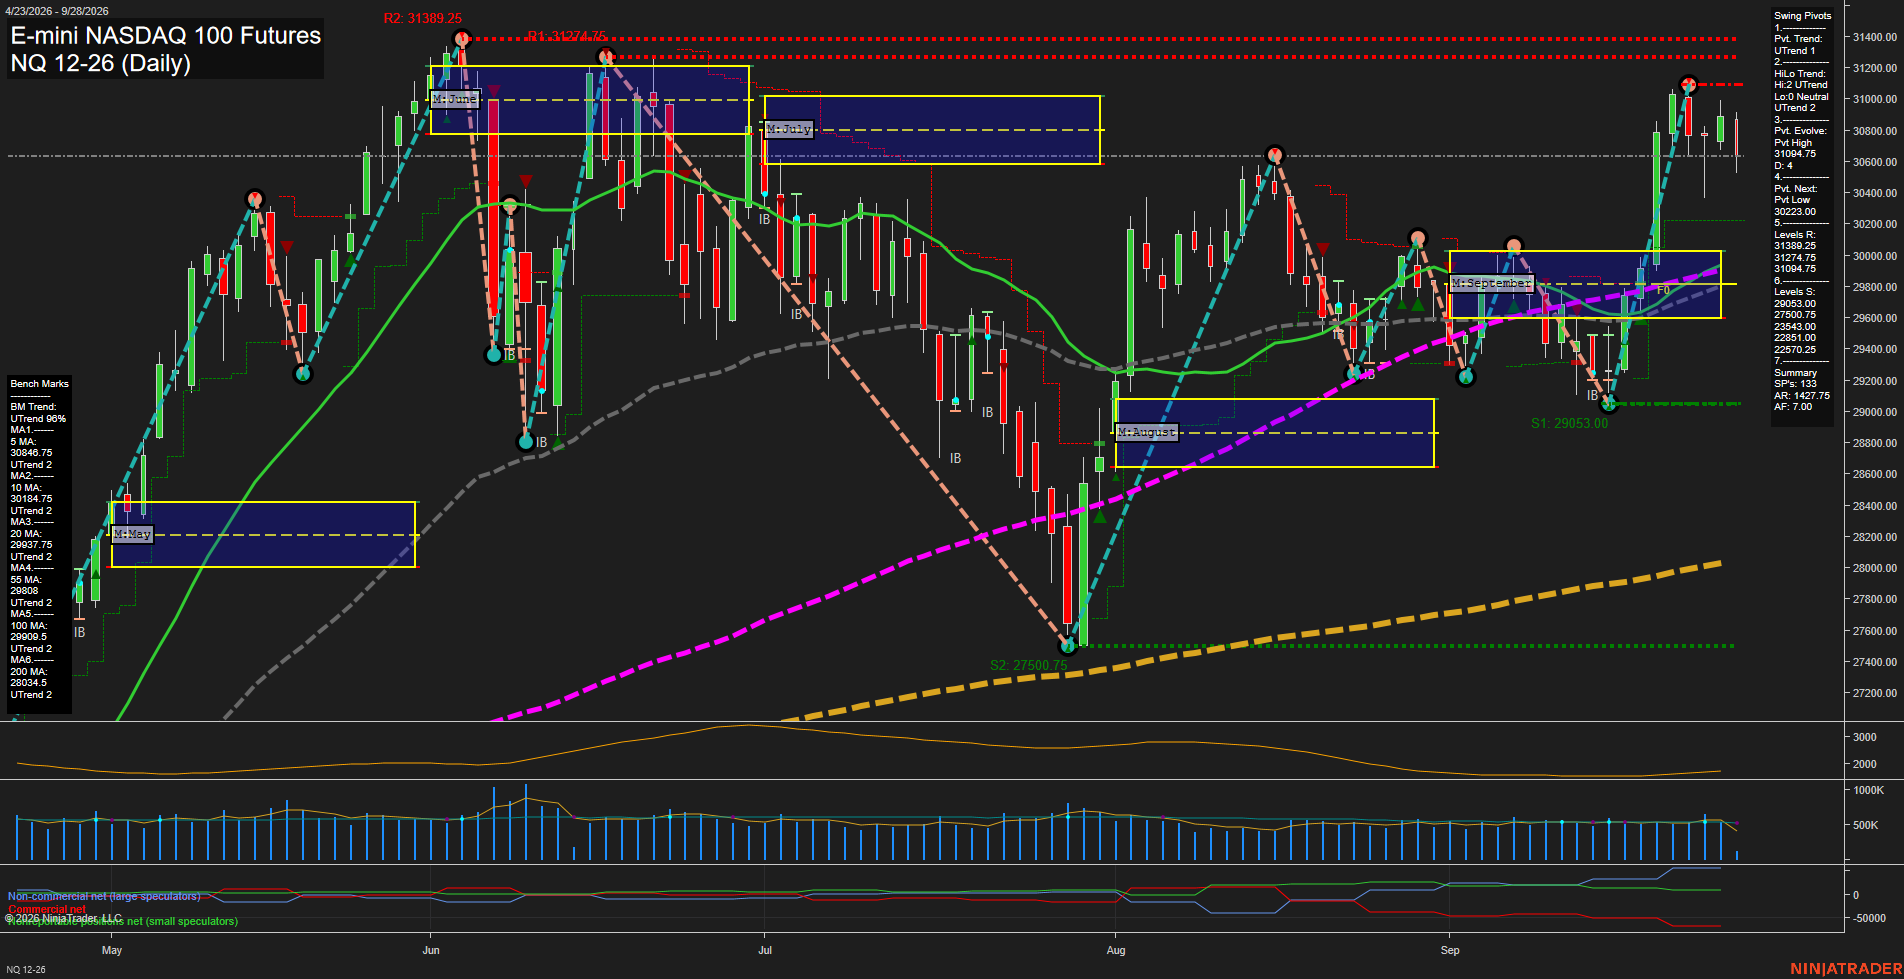
Overall Rating
- Short-Term: Neutral
- Intermediate-Term: Bullish
- Long-Term: Bullish.
Key Insights Summary
NQ remains in a constructive intermediate and long-term recovery structure, supported by the rising 10, 20, 55, 100, and 200-day benchmarks, the positive monthly and yearly Fib-grid positioning, and an intermediate UTrend pivot sequence. Short-term conditions are mixed: price is below the declining 5-day benchmark and below the weekly F0% area, while the latest TR120 signal is short. The recent rally tested the 31094.75 pivot-high area and encountered rejection, leaving 30223.00 as the next pivot-reversal reference. Price action is consolidating beneath 31094.75 resistance, with 31274.75 and 31389.25 forming the higher resistance band; 29053.00 remains the principal swing support below the current range.
View charts on: AlphaWebTrader HTF Charts
CL Daily View
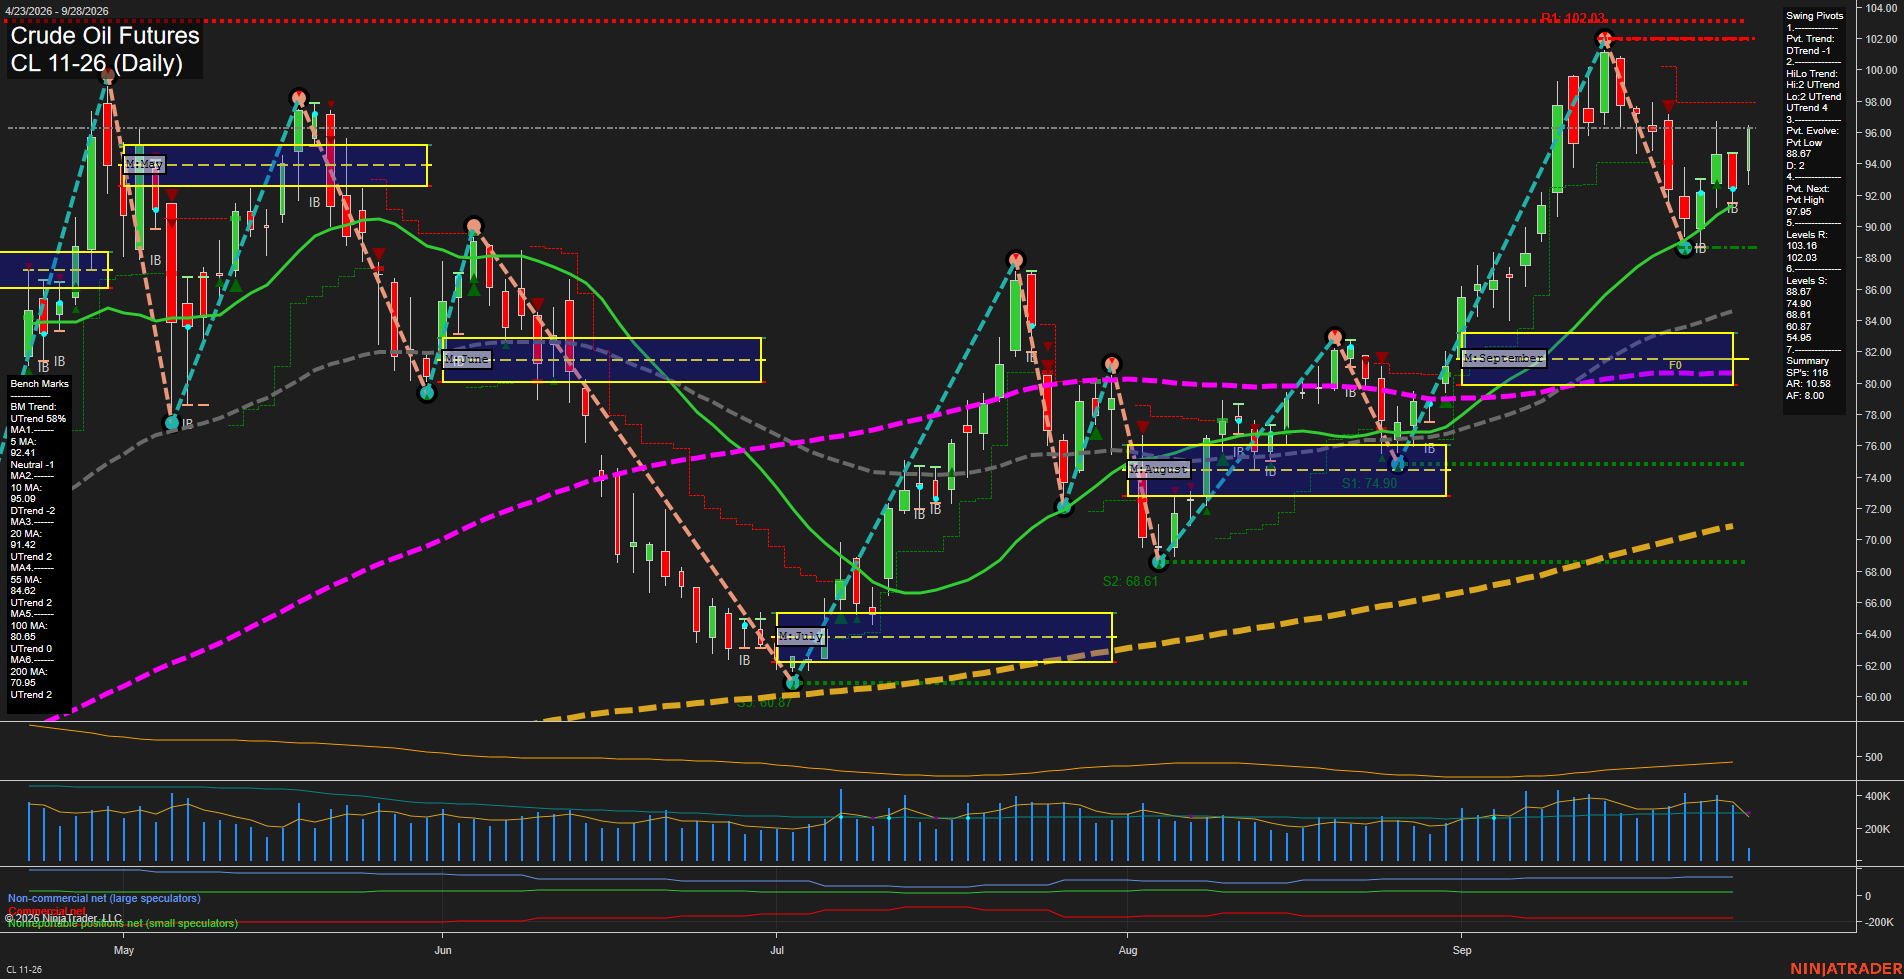
Overall Rating
- Short-Term: Neutral
- Intermediate-Term: Bullish
- Long-Term: Bullish.
Key Insights Summary
Price remains above the weekly, monthly, and yearly Fib-grid reference levels, while the 20-, 55-, 100-, and 200-day benchmarks retain rising trends. The intermediate and long-term structure remains a higher-low recovery from the August low, but the short-term pivot state is in a downswing following rejection from the 102.03 resistance area. The current retracement has held well above the 88.67 pivot support and near the rising 20-day average, leaving the market in a bullish broader trend with a near-term consolidation and pullback phase. A move through 97.95 would define a renewed short-term pivot high, while 102.03 remains the dominant overhead swing resistance.
View charts on: AlphaWebTrader HTF Charts
GC Daily View
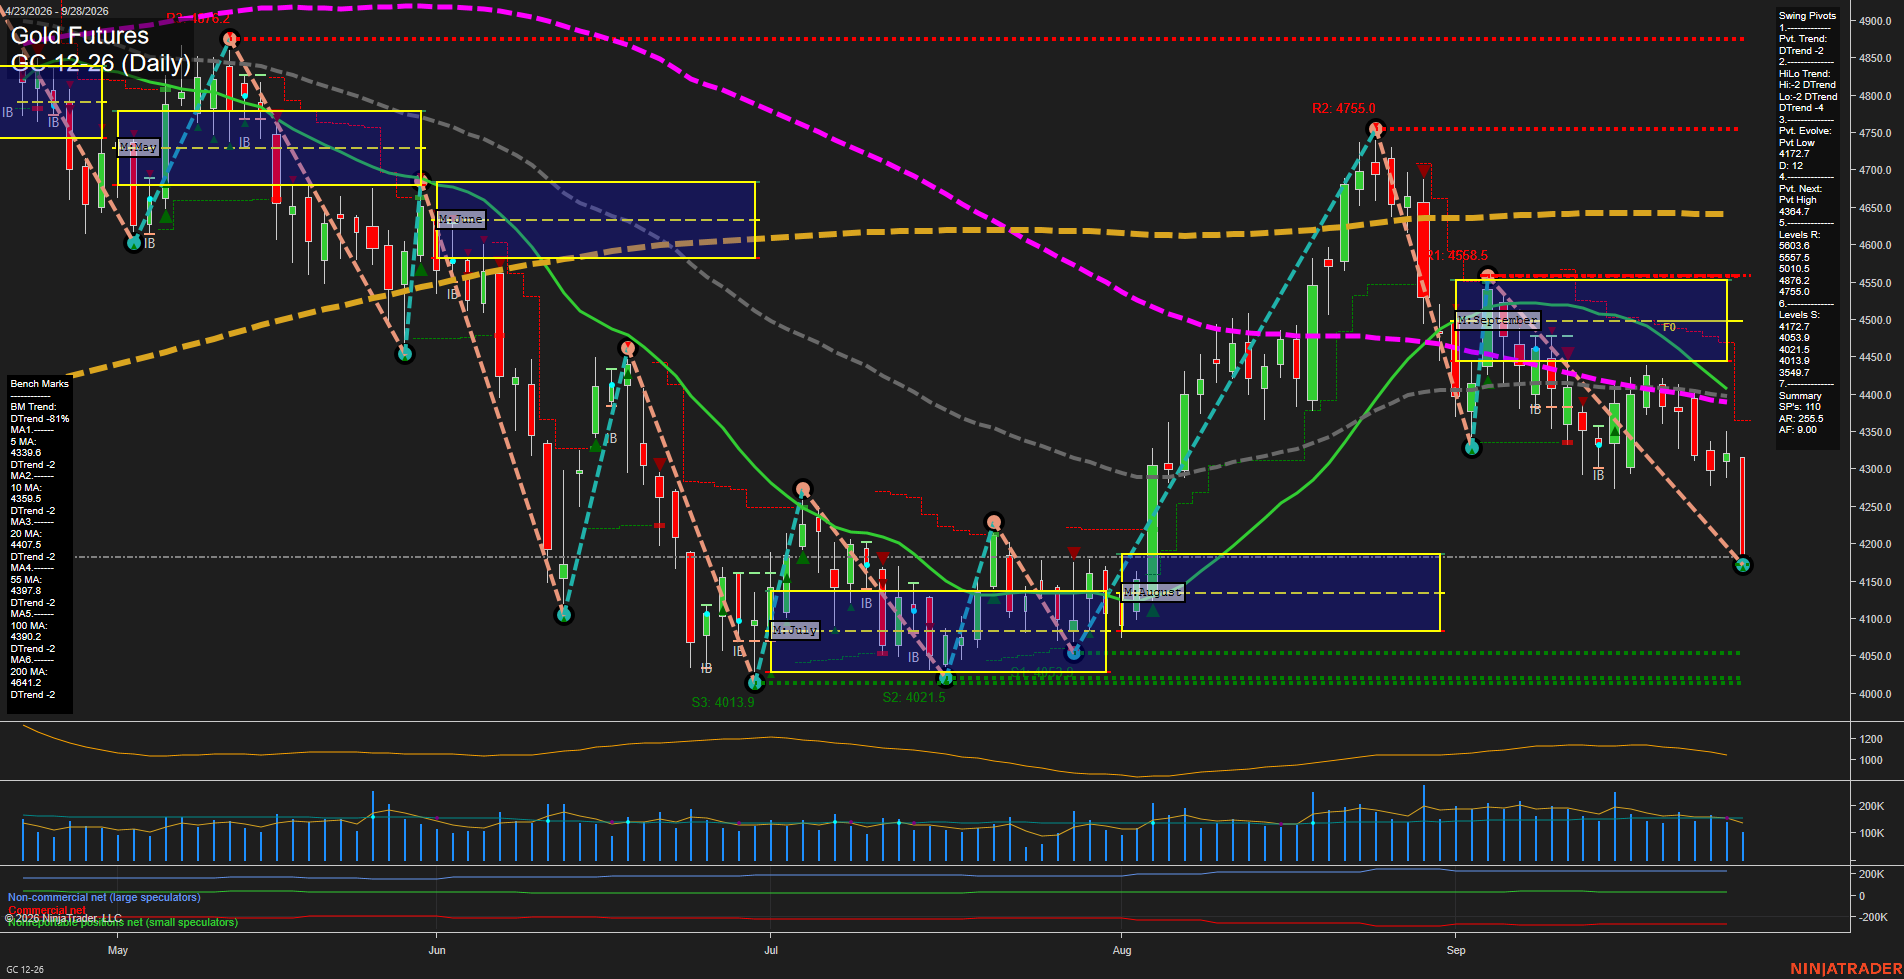
Overall Rating
- Short-Term: Bearish
- Intermediate-Term: Bearish
- Long-Term: Bearish.
Key Insights Summary
Gold futures show broad bearish alignment across the weekly, monthly, and yearly Fib grids, pivot structure, and all six benchmark moving averages. Price has broken sharply lower on a large, high-momentum daily bar and is establishing a new pivot low near 4172.7, while the next opposite pivot threshold is materially higher at 4364.7. The decline follows a lower-high sequence from the 4755.0 pivot high, with 4053.9 through 4013.9 forming the nearest lower support cluster. Elevated ATR reflects an expanded volatility regime, while price remains below the monthly F0% area and the 20-, 55-, 100-, and 200-day benchmarks, reinforcing a dominant downside swing-cycle structure.
View charts on: AlphaWebTrader HTF Charts
ZB Daily View
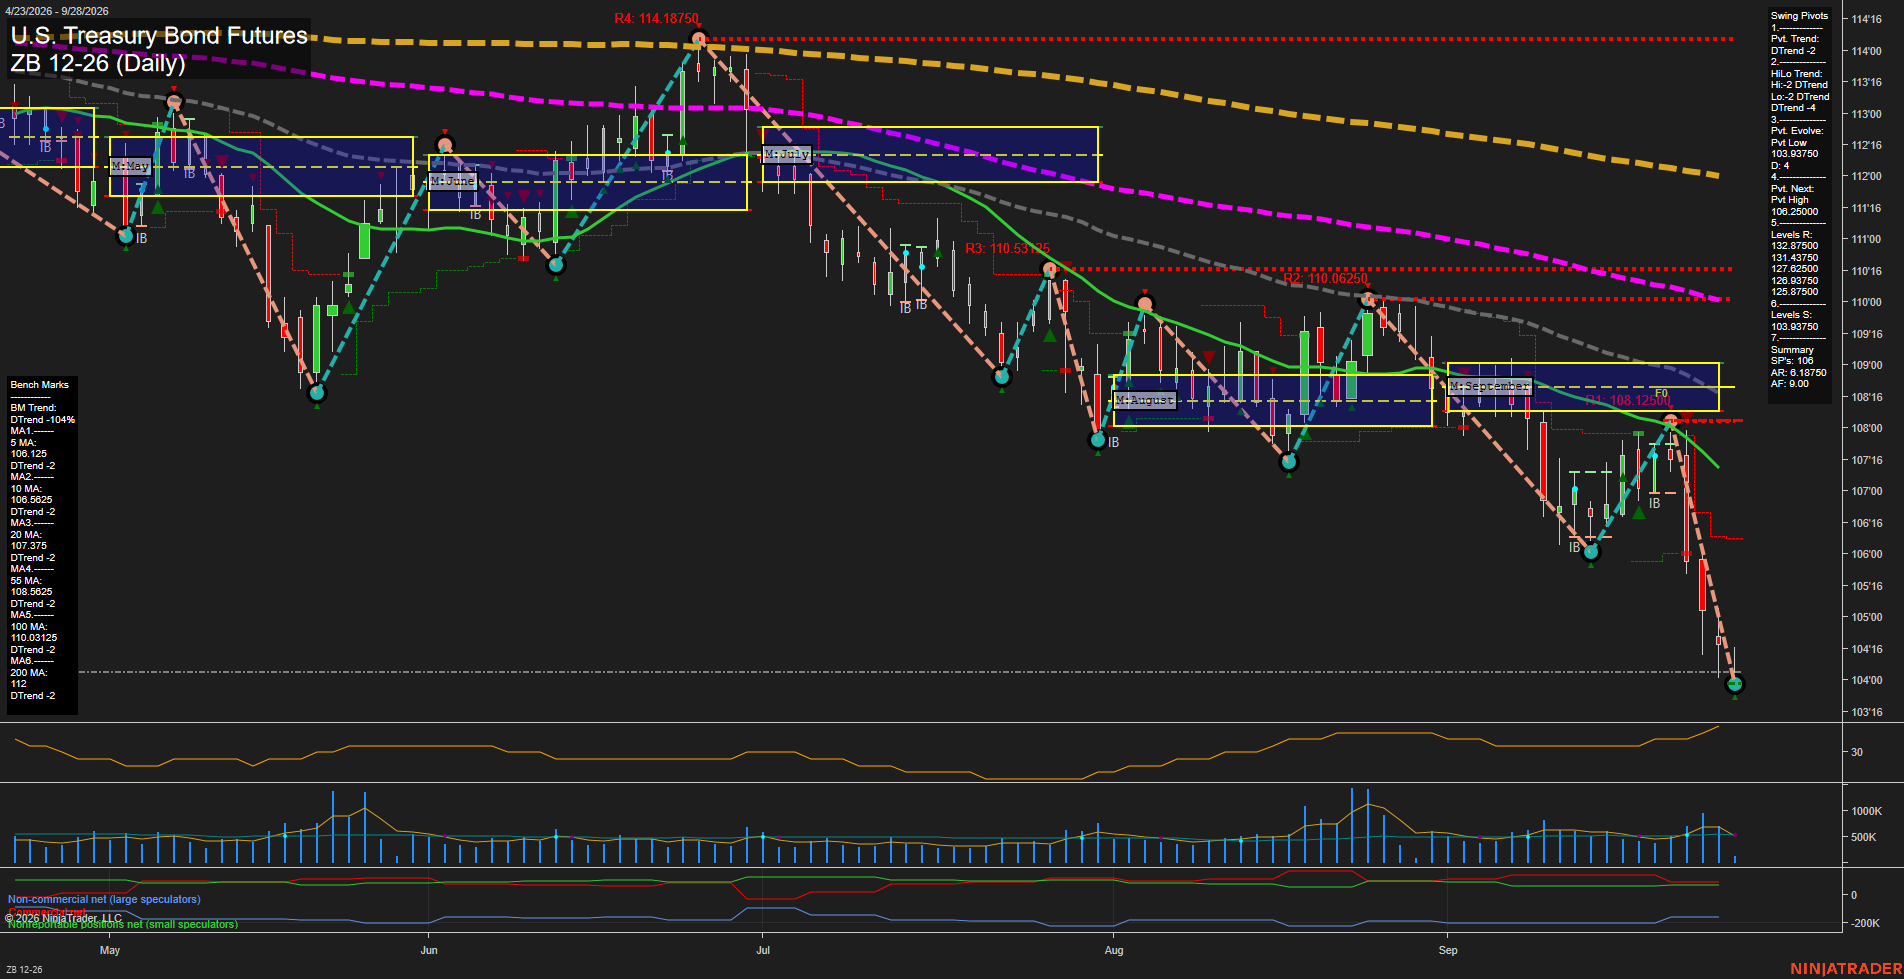
Overall Rating
- Short-Term: Bearish
- Intermediate-Term: Bearish
- Long-Term: Bearish.
Key Insights Summary
ZB remains in a broad and accelerating daily downtrend, with large-range selling bars and fast downside momentum extending price materially beneath the September MSFG/NTZ area and all six declining benchmark averages. Pivot structure is bearish across both short- and intermediate-term measures, with the latest evolving pivot low near 103.900 reflecting continuing lower-low behavior. Recent short-, weekly-, monthly-, and long-term trend signals remain aligned to the downside. The broken 106.000-106.18750 support zone is now overhead, while the next defined pivot reversal threshold is substantially higher at 108.2500; ATR expansion and elevated volume activity confirm a high-volatility directional decline rather than a stable consolidation.
View charts on: AlphaWebTrader HTF Charts