US and European index futures market review covers key technical levels, ETF movers, oil and yields as markets await confidence and JOLTS data.
Fundamentals: U.S. index futures traded near flat after Monday’s losses, with Middle East supply concerns supporting oil prices and elevated Treasury yields weighing on risk sentiment. Stabilization in chip and AI shares offered limited support, while software stocks faced disruption concerns. Markets also awaited U.S. consumer confidence and JOLTS job openings data.
Technicals: Pre-market futures analysis shows broadly constructive higher-timeframe trends in ES and NQ despite neutral-to-bearish short-term consolidation. YM, EMD, RTY and FDAX retain varying degrees of corrective pressure, with several daily structures bearish. The report tracks key pivot support and resistance zones, moving-average alignment, Fib-grid readings and elevated volatility alongside prior-session ETF movers.
Pre-Market Trading 360° view Market Radar of: holidays, earnings, eco-news, market-news summary, news sentiment, prior session major ETFs, MAG7, Higher Time Frame Analysis Indices Futures Summary, and E-mini S&P500, Nasdaq 100, NYMEX Crude, Gold Futures Daily Chart analysis.
As of: September 29, 2026 07:16 CT
Earnings Radar
Monitoring for earnings releases by the Magnificent 7, AI-tech-related firms, and major financial institutions.
- MU Release: 2026-09-30 T:AMC
Conclusion: Micron (MU) reports after the close on 2026-09-30, placing semiconductor and AI-memory earnings in focus for index futures into the following session. Market momentum and volume can slow ahead of this major semiconductor earnings release.
For full details visit: Yahoo Earnings Calendar
EcoNews Radar U.S. Events
| Day | Time | Impact | Event |
|---|---|---|---|
| Tue | 10:00 | Medium | CB Consumer Confidence |
| Tue | 10:00 | Medium | JOLTS Job Openings |
| Wed | 08:15 | Medium | ADP Non-Farm Employment Change |
| Wed | 08:30 | High | Core PCE Price Index m/m |
| Wed | 08:30 | High | Final GDP q/q |
| Wed | 08:30 | Medium | Final GDP Price Index q/q |
| Wed | 10:30 | Low | Crude Oil Inventories |
| Thu | 08:30 | Medium | Unemployment Claims |
| Thu | 10:00 | Medium | FOMC Member Waller Speaks |
| Thu | 10:00 | Medium | ISM Manufacturing PMI |
| Fri | 08:30 | High | Average Hourly Earnings m/m |
| Fri | 08:30 | High | Non-Farm Employment Change |
| Fri | 08:30 | High | Unemployment Rate |
EcoNews Summary
High-impact U.S. inflation, growth, and labor releases concentrate on Wednesday and Friday. These reports provide updated readings on price pressures, economic output, wage growth, payroll employment, and unemployment. Market momentum and volume often slow ahead of major PCE and GDP releases, with increased volatility at release time.
Event Notes:
- Wednesday 08:30 — Core PCE Price Index m/m: Measures the monthly change in consumer prices excluding food and energy. Traders monitor it as an inflation gauge tied to monetary-policy conditions.
- Wednesday 08:30 — Final GDP q/q: Measures the finalized quarterly pace of U.S. economic growth. Traders monitor it for confirmation of changes in overall economic activity.
- Friday 08:30 — Average Hourly Earnings m/m: Measures the monthly change in average worker pay. Traders monitor wage growth as an input into inflation and consumer-income trends.
- Friday 08:30 — Non-Farm Employment Change: Measures the monthly change in U.S. payroll employment outside the farm sector. Traders monitor it as a broad indicator of labor-market conditions.
- Friday 08:30 — Unemployment Rate: Measures the share of the labor force without work and actively seeking employment. Traders monitor it for labor-market slack and economic-condition signals.
Conclusion:
The single most important event day is Friday, led by the 08:30 Non-Farm Employment Change release alongside Average Hourly Earnings and the Unemployment Rate. The combined labor-market data release concentrates several high-impact indicators into one time window and often coincides with increased volatility at release time.
For full details visit: Forex Factory EcoNews
Market News Summary:
Index futures were little changed after Monday losses as Middle East tensions, firmer oil, and elevated Treasury yields maintained pressure on risk sentiment.
Primary Drivers & Risks:
- Primary Driver: Middle East oil supply tensions
- Primary Risk: Higher yields and energy inflation
Tone:
Cautious, with geopolitical and rate-sensitive cross-currents.
Stock Market / ETFs / Indices:
Dow, S&P 500, and Nasdaq 100 futures were near flat to slightly higher, recovering only a small portion of Monday’s decline. Chip and AI-share stabilization offset pressure from oil and Treasury yields, while software stocks faced AI-disruption concerns. Last week, major U.S. and foreign indexes advanced except the Russell 2000, which fell 0.79%.
Geopolitical:
U.S.-Iran ceasefire discussions remained deadlocked despite separate mediator talks. Strait of Hormuz shipping and regional energy infrastructure remained central concerns, while Iranian leadership rhetoric underscored continued conflict risk.
Oil / Energy:
Brent and WTI extended gains for a second session as supply-disruption concerns outweighed recovering Middle East crude exports. Saudi Arabia resumed Yanbu loadings after an East-West Pipeline restart, easing part of the export outlook. The IEA discussed the possibility of further strategic reserve releases, while fuel-price caps emerged in Italy.
Gold / Metals:
Gold edged higher in Asian trading but remained below $4,120 and near a multiweek low.
Fed / Financials:
Treasury yields stayed near multiyear highs after the 10-year yield reached 5.17% last week. Rising energy costs and stronger AI-related growth themes supported higher-for-longer rate positioning, while the dollar reached a two-month high amid growing October rate-hike expectations.
Macro / Other:
Markets focused on upcoming consumer-confidence and labor-market data. Iran interest-rate hike concerns also weighed on broader market sentiment.
Conclusion:
Middle East conflict developments, oil strength, and elevated Treasury yields were the main index-futures drivers. Futures traded around flat following Monday’s weakness.
Recovering regional crude flows and Saudi pipeline operations moderated supply concerns. AI-sector stabilization provided limited support, while software disruption fears and higher-rate pressure remained cross-currents.
Market News Sentiment
Market News Articles: 39
- Neutral: 43.59%
- Negative: 30.77%
- Positive: 25.64%
Sentiment Summary: Market news sentiment is neutral-leaning, with 44% neutral, 31% negative, and 26% positive coverage across 39 articles.
Conclusion: Indices futures day traders face mixed news flow with negative coverage exceeding positive coverage.
GLD,Gold Articles: 9
- Negative: 44.44%
- Positive: 33.33%
- Neutral: 22.22%
Sentiment Summary: GLD/Gold coverage is mixed with a negative tilt: 44% negative, 33% positive, and 22% neutral across 9 articles.
Conclusion: Gold-related sentiment is moderately negative, indicating a cautious tone in this market segment for indices futures day traders.
USO,Oil Articles: 16
- Negative: 43.75%
- Neutral: 37.50%
- Positive: 18.75%
Sentiment Summary: USO and oil coverage is predominantly negative (44%), with neutral articles at 38% and positive articles at 19%.
Conclusion: The oil news tone is negative overall, which may be relevant context for indices futures day traders monitoring energy-sector sentiment.
Market Data Snapshot
ETF Snapshot of major stock market ETFs, Mag7, and others as of: September 29, 2026 07:16
Top Movers & Losers
- NVDA 228.86 Bullish 1.68% ▲
- USO 150.01 Bullish 1.13% ▲
- GOOG 339.16 Bearish -0.56% ▼
- TSLA 357.45 Bearish -3.94% ▼
- GLD 377.91 Bearish -3.94% ▼
- META 715.62 Bearish -4.79% ▼
Major Index ETFs: SPY, QQQ, DIA, IWM, IJH
- DIA 514.02 Bearish -0.67% ▼
- IWM 280.02 Bearish -0.69% ▼
- SPY 765.61 Bearish -0.74% ▼
- IJH 72.44 Bearish -0.75% ▼
- QQQ 736.53 Bearish -1.07% ▼
Major Index ETFs are uniformly Bearish: QQQ leads declines at -1.07%, followed by IJH at -0.75% and SPY at -0.74%. IWM is down -0.69%, while DIA is the least negative mover at -0.67%.
Mag 7 Stocks: AAPL, MSFT, GOOG, AMZN, META, NVDA, TSLA
- NVDA 228.86 Bullish 1.68% ▲
- GOOG 339.16 Bearish -0.56% ▼
- AAPL 338.40 Bearish -0.78% ▼
- MSFT 509.22 Bearish -1.35% ▼
- AMZN 246.15 Bearish -1.41% ▼
- TSLA 357.45 Bearish -3.94% ▼
- META 715.62 Bearish -4.79% ▼
Mixed Mag7 performance: NVDA is the most bullish mover at +1.68%, while META is the most bearish mover at -4.79%. Downside is broad across TSLA -3.94%, AMZN -1.41%, MSFT -1.35%, AAPL -0.78%, and GOOG -0.56%.
Cross-Market ETFs: TLT, GLD, USO, IBIT
- USO 150.01 Bullish 1.13% ▲
- IBIT 47.21 Bearish -0.76% ▼
- TLT 78.62 Bearish -0.88% ▼
- GLD 377.91 Bearish -3.94% ▼
Mixed cross-market snapshot: USO is the most bullish mover at +1.13%, while GLD is the most bearish mover at -3.94%. TLT is Bearish at -0.88% and IBIT is Bearish at -0.76%.
ETF, Mag7, and Cross-Market ETF Insights
Overall Tone
Bearish overall, with broad equity and hedging pressure outweighing isolated leadership in NVDA at +1.68% and USO at +1.13%.
Equity ETFs and Mag7:
Major Index ETFs were broadly Bearish: SPY fell -0.74%, QQQ led index downside at -1.07%, DIA declined -0.67%, IWM lost -0.69%, and IJH slipped -0.75%. Mag7 performance was selective, with NVDA the most bullish mover at +1.68%, while GOOG was the least negative at -0.56%; META was the most bearish mover at -4.79%, followed by TSLA at -3.94%, AMZN at -1.41%, MSFT at -1.35%, and AAPL at -0.78%.
Cross-Market ETFs:
Cross-market ETFs were Mixed, with USO the most bullish mover at +1.13% while IBIT declined -0.76%, TLT fell -0.88%, and GLD was the most bearish mover at -3.94%. The weakness in TLT, GLD, and IBIT aligned with the broader Bearish equity tone, while USO showed commodity strength.
Futures Indices – Higher Time Frame Analysis
Summary of the current state of US Indices Futures based on higher time-frame (HTF) technical analysis as of: 2026-09-29: 07:16 CT.
US Indices Futures
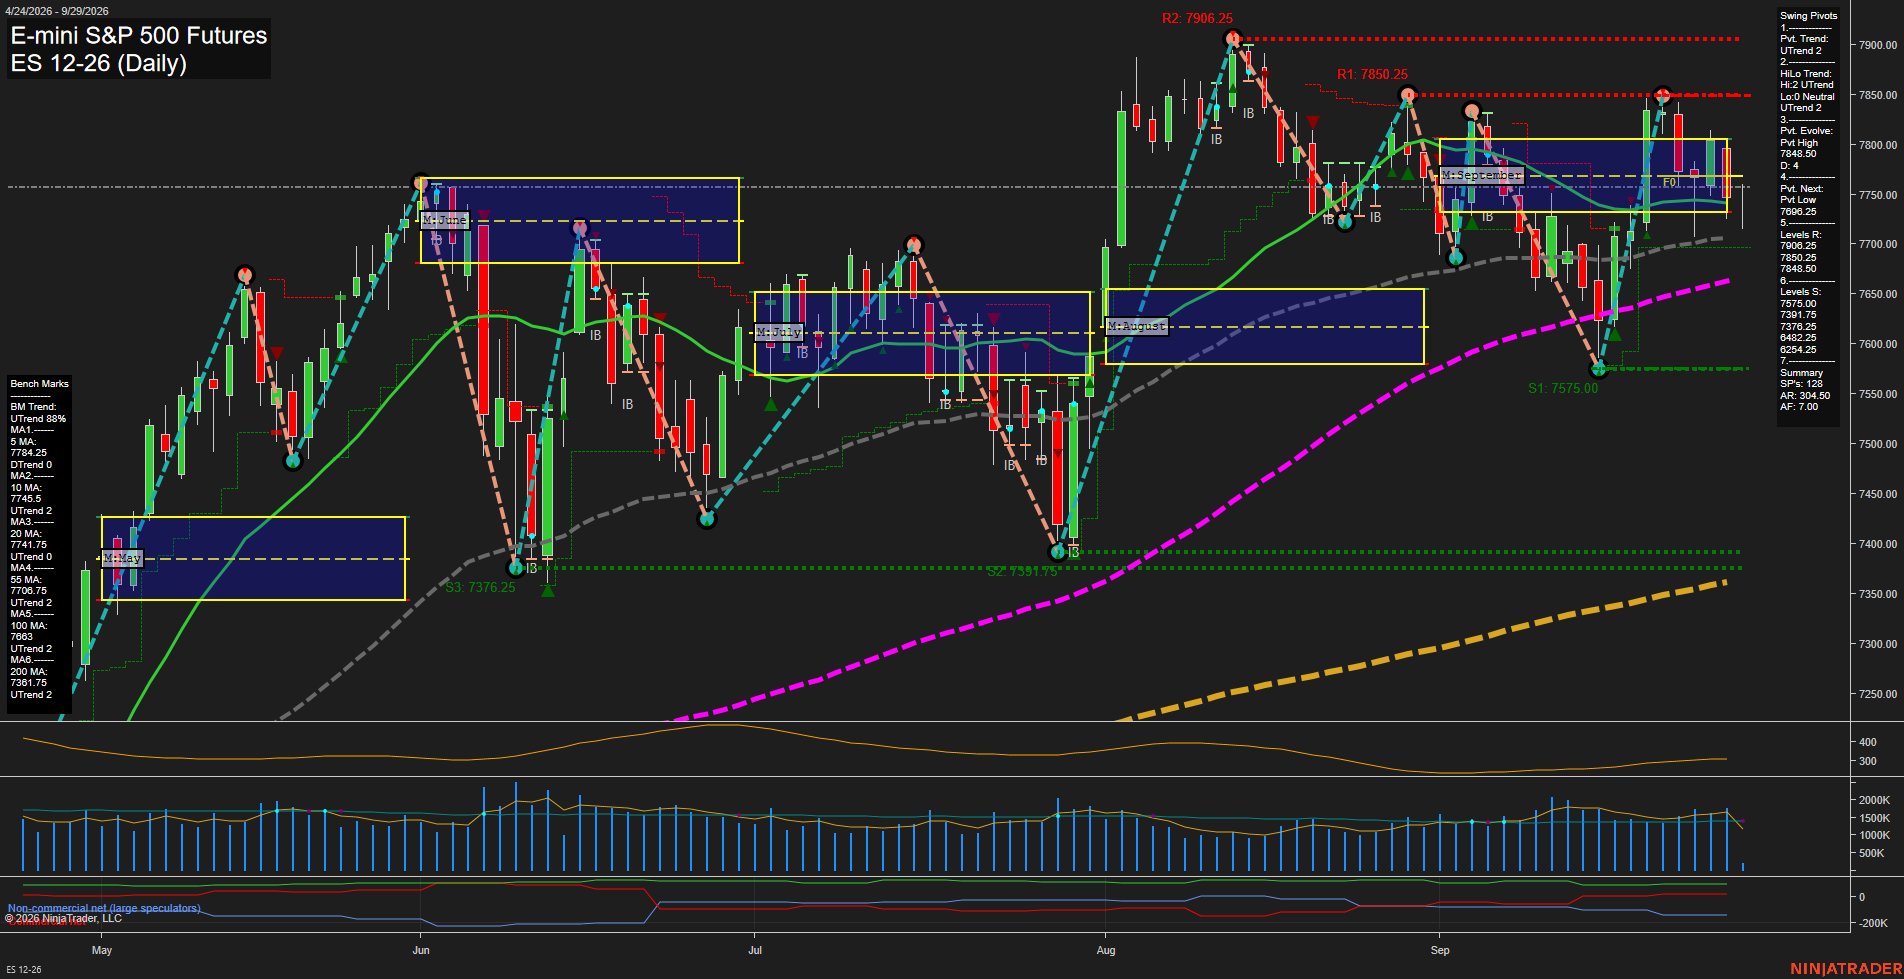
- ES: YSFG above F0%; MSFG/WSFG below F0%; rising benchmarks; UTrend; resistance 7848.50-7906.25; support 7764.75, 7636.25, 7575.00.
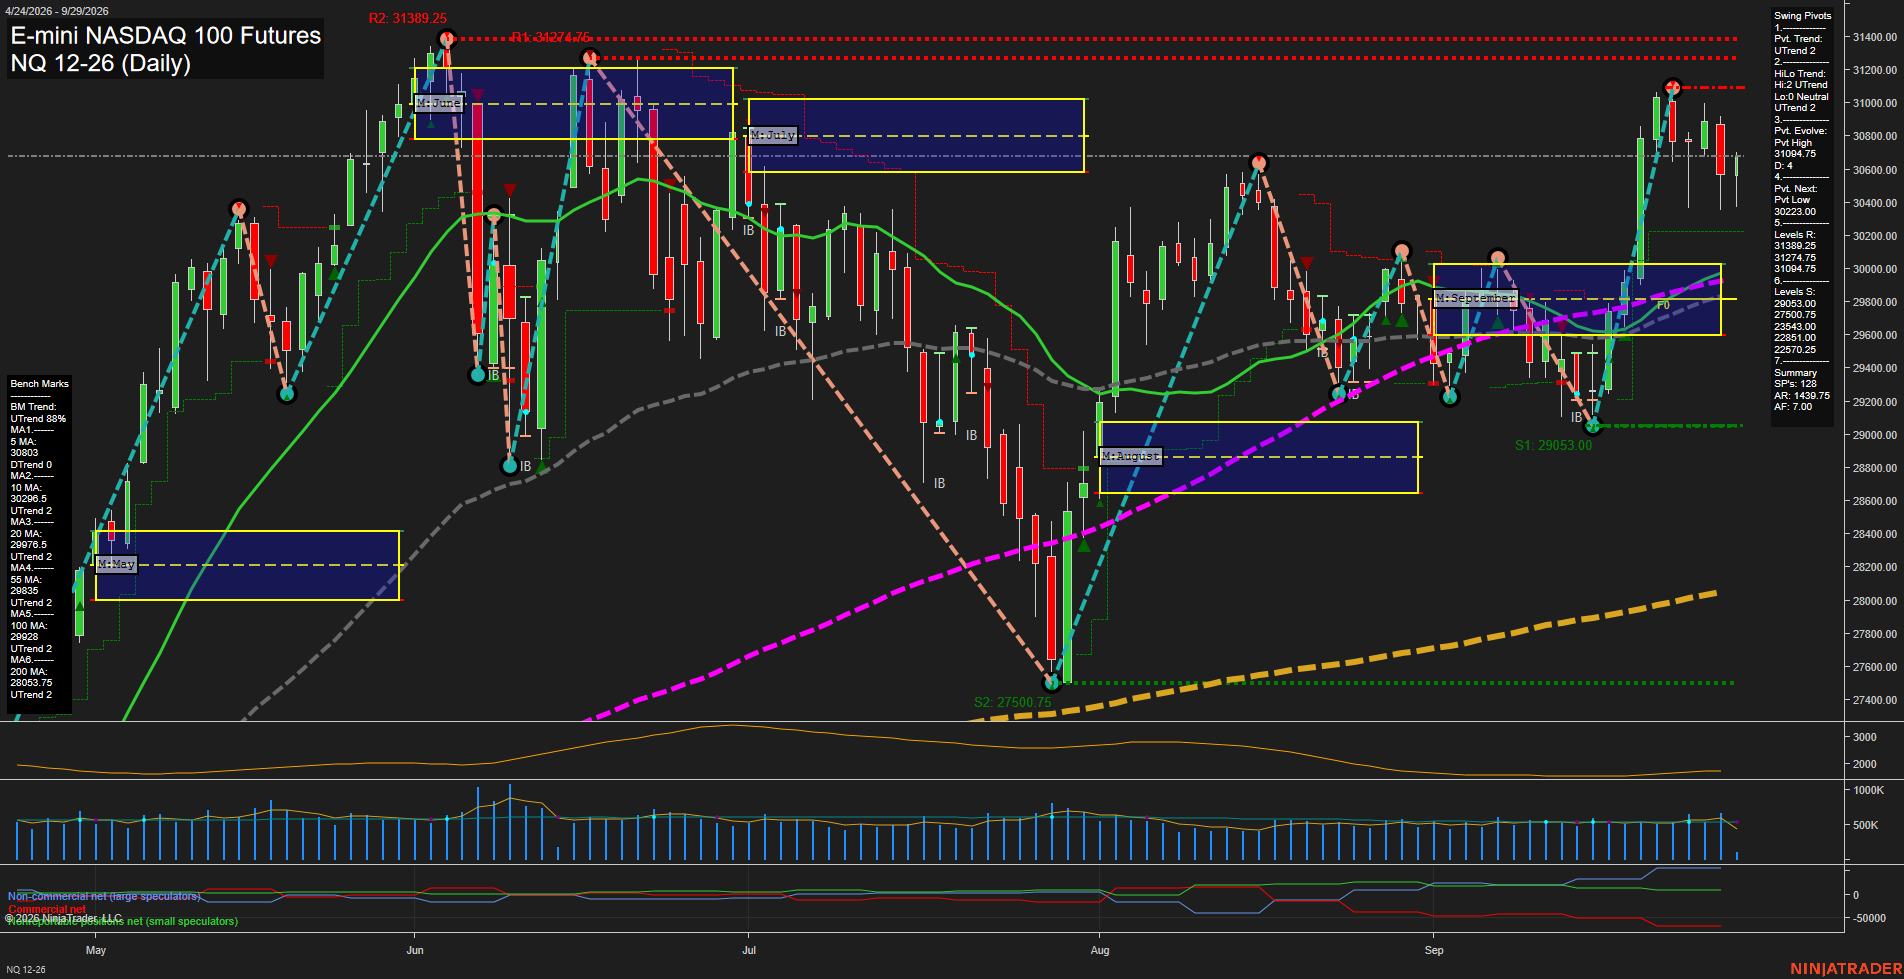
- NQ: YSFG/MSFG upward; WSFG below F0%; benchmarks rising; UTrend; resistance 31094.75-31389.25; pivots 30223.00, 28728.25; support 29053.00.
- YM: YSFG above F0%; MSFG/WSFG below centers; DTrend daily; benchmarks mixed; resistance 52719-52878; support 51447-51479.
- EMD: YSFG above F0%; MSFG/WSFG below F0%; DTrend; below daily benchmarks; support 3617.1-3628.7; reversal zone 3674.3-3716.7.
- RTY: YSFG above F0%; MSFG/WSFG below F0%; DTrend; below 5-100 day benchmarks; support 2823.9; reversal pivot 2906.3; resistance 2931.2.
- FDAX: YSFG above F0%; MSFG below F0%; WSFG near F0%; DTrend; resistance 25990, 26847; support 25337; 100/200-day benchmarks rising.
Overall State
- Short-Term: Bearish
- Intermediate-Term: Bearish
- Long-Term: Bullish
Conclusion
Broad index correlation shows short- and intermediate-term retracement pressure outside ES and NQ’s stronger benchmark alignment. YSFG conditions remain broadly above F0%, while MSFG and WSFG readings are weaker across most contracts. ES and NQ hold UTrend structures above major averages; YM, EMD, RTY, and FDAX retain DTrend conditions with nearby pivot supports defining current structure.
Note: Intra-day counter-trend pullbacks or retracements may occur, HTF is context for informational usage and market structure. Glossary: Session Fib Grids periods of YSFG:’Yearly’, MSFG:’Monthly’, WSFG:’Weekly’
For full details visit: AlphaWebTrader Technicals
ES Daily View
Overall Rating
- Short-Term: Neutral
- Intermediate-Term: Bullish
- Long-Term: Bullish.
Key Insights Summary
Price is consolidating beneath the 7848.50 to 7850.25 pivot-resistance cluster after a rebound from the 7575.00 swing low. The weekly and monthly Fib grids remain below their F0% lines, reflecting a short-term countertrend pullback, while the UTrend pivot structure and price above the 10, 20, 55, 100, and 200-day benchmarks preserve a broader constructive trend. The 7764.75 area is near the rising 10 and 20-day averages, with 7636.25 defining the next pivot-reversal level and 7575.00 the principal nearby swing support. Volatility remains elevated with ATR near 304.50, consistent with broad daily rotations inside an overall higher-timeframe advance.
View charts on: AlphaWebTrader HTF Charts
NQ Daily View
Overall Rating
- Short-Term: Neutral
- Intermediate-Term: Bullish
- Long-Term: Bullish.
Key Insights Summary
The daily structure remains broadly constructive, with price above the rising 10, 20, 55, 100, and 200-day benchmarks and the intermediate HiLo pivot trend still in UTrend. Short-term action has become mixed after rejection from the 31094.75 pivot-high area: the 5-day average is declining, the weekly fib-grid bias is below F0%, and the latest TR120 signal is short. Price is consolidating above the 30223.00 next-pivot level after a sharp September recovery, leaving 31094.75 as the nearest pivot resistance and 29053.00 as the principal swing support. Volatility remains elevated relative to the recent consolidation, consistent with medium-sized daily bars and a choppy pullback within the larger bullish structure.
View charts on: AlphaWebTrader HTF Charts
CL Daily View
Overall Rating
- Short-Term: Bearish
- Intermediate-Term: Bullish
- Long-Term: Bullish.
Key Insights Summary
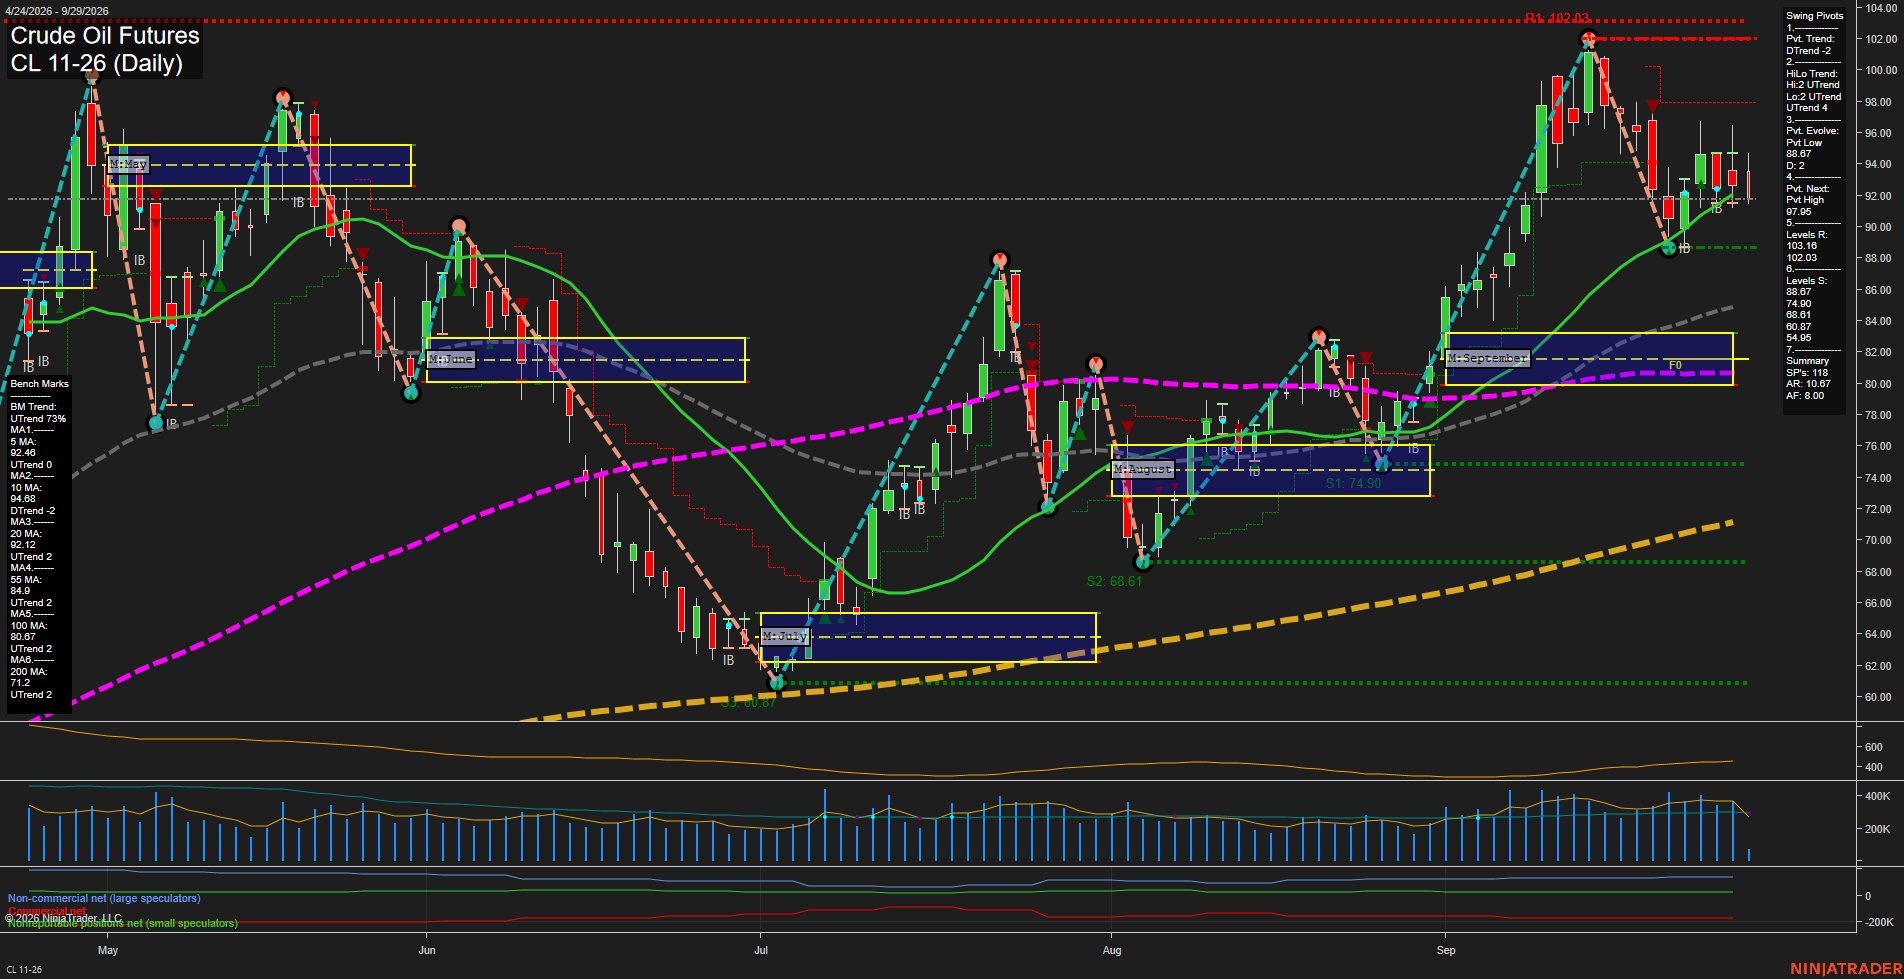
Price has shifted into a fast short-term pullback after rejection from the 102.03 swing-high resistance area. The daily pivot trend is down and price is below both the 5-day and 10-day benchmarks, while the weekly fib-grid position remains below its F0%/NTZ area. Intermediate and long-term structure remains constructive: the HiLo trend is up, price remains above the 20-day, 55-day, 100-day, and 200-day benchmarks, and the monthly and yearly fib-grid trends remain positive. The 88.67 pivot low is the primary nearby structural support, while 97.95 and 102.03 define the overhead pivot-reversal and major resistance zones.
View charts on: AlphaWebTrader HTF Charts
GC Daily View
Overall Rating
- Short-Term: Bearish
- Intermediate-Term: Bearish
- Long-Term: Bearish.
Key Insights Summary
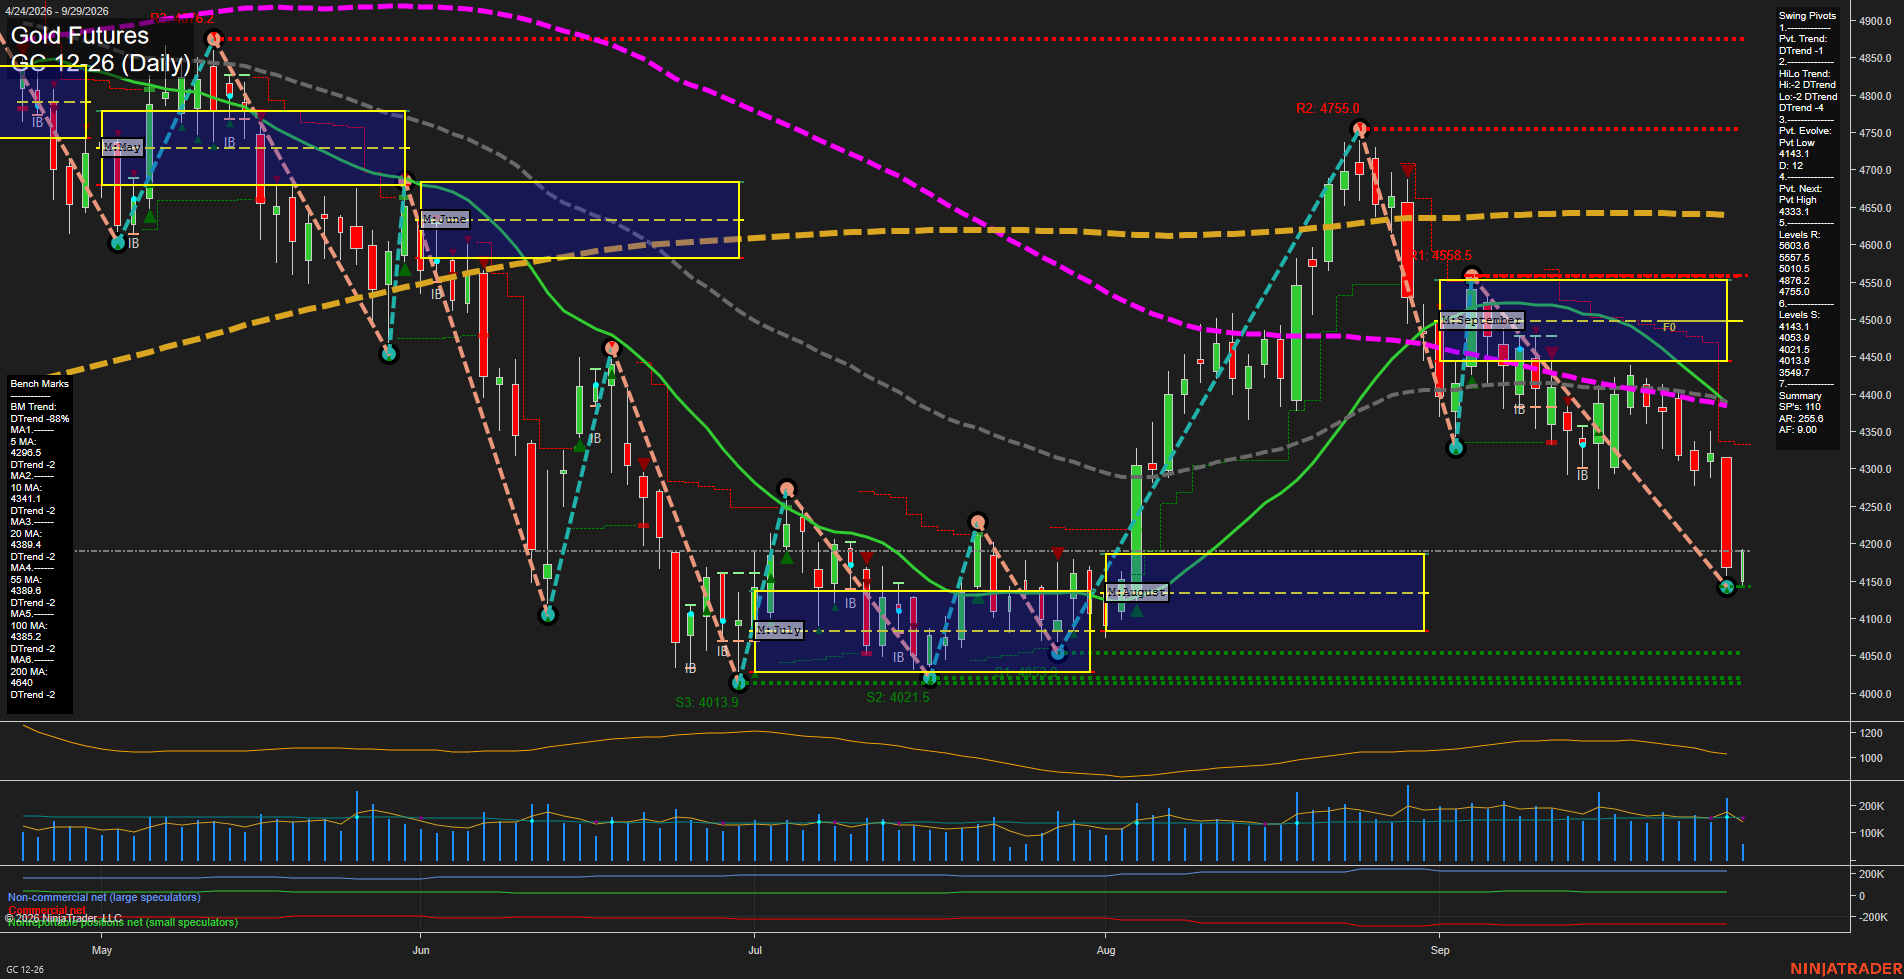
GC has accelerated lower from the late-August 4755.0 pivot high, producing a sequence of lower highs and lower lows that confirms both short-term and intermediate-term pivot downtrends. The large recent decline has pushed price below every daily benchmark and below the September MSFG F0%/NTZ area, while weekly, monthly, and yearly fib-grid readings remain negative. The 4143.1 pivot low is the immediate structural reference, with the clustered 4053.9 to 4013.9 supports representing the next downside zone. Overhead, the 4339.1 next-pivot threshold and the 5-to-100 day moving-average cluster near 4296.5 to 4389.8 define a broad bearish retracement ceiling. Elevated range expansion and persistent downside momentum characterize the current futures swing environment.
View charts on: AlphaWebTrader HTF Charts
ZB Daily View
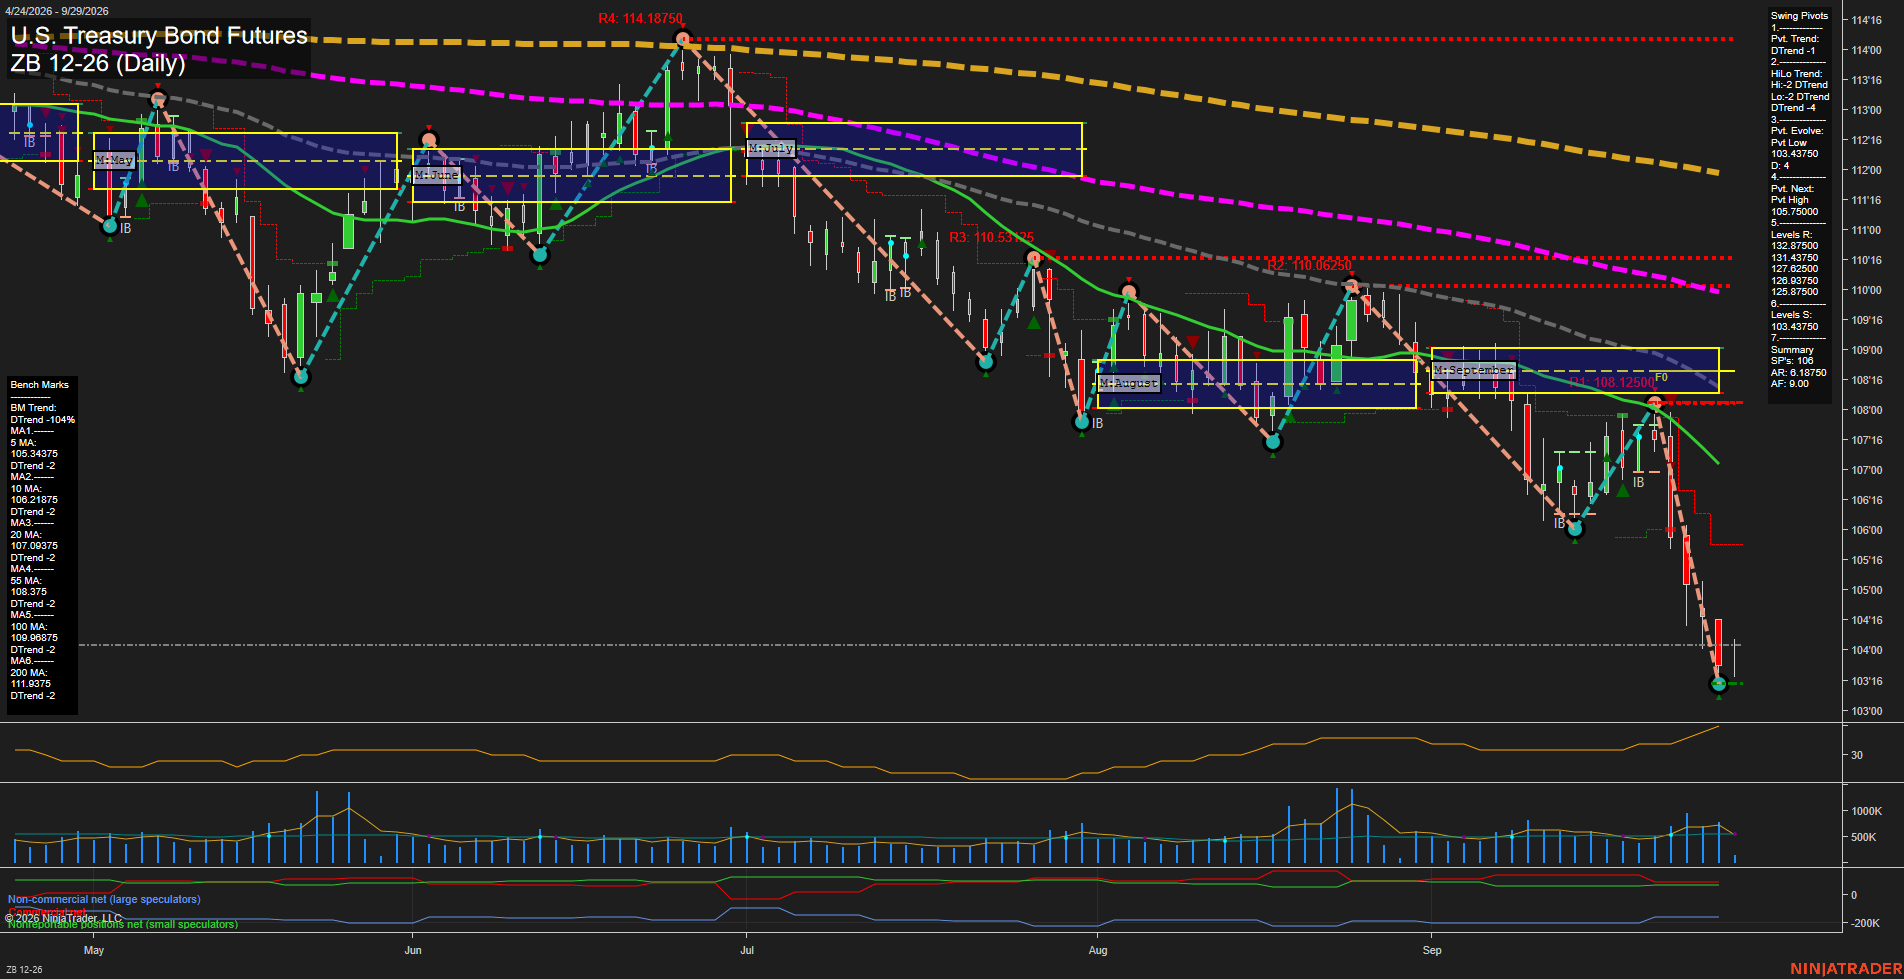
Overall Rating
- Short-Term: Bearish
- Intermediate-Term: Bearish
- Long-Term: Bearish.
Key Insights Summary
ZB remains in a broad, synchronized bearish trend: price is below every benchmark average, each average is declining, and both the short-term pivot trend and intermediate-term HiLo structure are in DTrend. The market has extended sharply beneath the September MSFG area near 108.1250 and is making lower highs and lower lows. The latest 103.4375 pivot low produced a modest bounce toward 104.0625, but momentum remains fast and the bounce is still structurally countertrend beneath the 5-day average at 105.34375. A reversal of the active pivot sequence would require a move through 105.7500, while 103.4375 remains the nearest established swing-low reference.
View charts on: AlphaWebTrader HTF Charts