Treasury yields hit 24-year highs as narrow tech strength masked weak market breadth, pressuring gold and rate-sensitive shares at the NYSE close. Oil…
Fundamentals: U.S. equities closed mixed as technology support lifted the Nasdaq while broader indexes faced weak participation, small- and mid-cap pressure, and elevated valuation concerns. The 10-year Treasury yield rose above 5.3% amid a sharp bond-market selloff, weighing on gold and rate-sensitive assets. Oil rebounded after OPEC+ maintained output targets, while Fed signals and inflation data remained mixed.
Technicals: US ETFs were mixed at the close, with USO, Apple and Alphabet higher while Meta, the Dow ETF and mid-cap shares declined. Futures technical readings showed bearish short- and intermediate-term conditions across ES, YM, EMD, RTY and FDAX, with NQ comparatively resilient. Across contracts, charts remained in corrective phases below nearby resistance, while many yearly structures and longer-term averages stayed positive.
After Market Close daily snapshot: market news summary and sentiment, major ETFs, Magnificent 7 analysis, Indices Futures Higher Time Frame Analysis, and E-mini S&P500, Nasdaq 100, NYMEX Crude, Gold Futures Daily Chart analysis.
As of: September 30, 2026 05:00 CT
Market News Summary:
Equity indexes showed narrow technology support while rising Treasury yields, weak breadth, and bond-market stress shaped the broader session.
Primary Drivers & Risks:
- Primary Driver: Treasury yields at 24-year highs
- Primary Risk: Narrow breadth and elevated valuations
Tone:
Mixed equity tone, with rate-sensitive pressure across markets.
Stock Market / ETFs / Indices:
Technology shares lifted the Nasdaq while the broader U.S. market ended modestly lower. Commentary highlighted weak participation beyond technology, continued small- and mid-cap pressure, and an S&P 500 valuation measure near 30 under the Rule of 20 framework. The S&P 500 and Nasdaq retained strong multi-year gains, but entered the fourth quarter with rising-rate pressure.
Geopolitical:
A U.S. drone startup linked to Trump family-backed investors is pursuing Ukrainian and other foreign technology for Pentagon demand, keeping defense-technology supply themes in focus.
Oil / Energy:
WTI and Brent rebounded from recent lows as OPEC+ maintained output targets. Separately, projected Northeast heating-oil bills pointed to a 31.3% winter increase, while natural-gas users faced comparatively lower costs.
Gold / Metals:
Gold remained pressured as the 10-year Treasury yield reached 5.30%, reducing the appeal of non-yielding assets. Price action placed focus on gold support near $4,103, despite reports of continued ETF and central-bank demand and longer-term bullish metals views.
Fed / Financials:
The 10-year Treasury yield rose above 5.3%, its highest level in 24 years, amid one of the sharpest bond-market selloffs in decades. Lower August PCE inflation reflected revised measurement methodology and subdued energy prices, with commentary cautioning against reading the result as broad disinflation. New York Fed President Williams’s remarks reduced October rate-hike odds, while other Fed officials offered less aligned policy signals.
Macro / Other:
Economic data were broadly described as positive, including revised second-quarter GDP growth of 2.2%. Persistent above-target inflation and firm growth remained associated with upward pressure on yields.
Conclusion:
Record-era Treasury yields and technology-led index performance were the central market drivers. Broad equity participation remained weaker than headline index action.
Bond-market stress, valuation concerns, and mixed Fed signals remained key cross-currents. Gold faced yield pressure, while oil stabilized after OPEC+ held output targets unchanged.
Market News Sentiment
Market News Articles: 51
- Neutral: 58.82%
- Negative: 25.49%
- Positive: 15.69%
Sentiment Summary: Market news sentiment is predominantly neutral at 59%, with negative coverage at 25% and positive coverage at 16%.
Conclusion: The news backdrop for indices futures is neutral overall, with negative sentiment exceeding positive sentiment.
GLD,Gold Articles: 15
- Neutral: 46.67%
- Positive: 26.67%
- Negative: 26.67%
Sentiment Summary: Gold-related coverage was neutral overall, with 47% neutral, 27% positive, and 27% negative articles across 15 items.
Conclusion: The balanced positive and negative distribution indicates no clear directional sentiment signal from gold coverage for indices futures day traders.
USO,Oil Articles: 14
- Negative: 42.86%
- Neutral: 28.57%
- Positive: 28.57%
Sentiment Summary: USO/Oil coverage is mildly negative, with 43% negative articles versus 29% each neutral and positive.
Conclusion: Oil-related news tone is tilted negative, which may be relevant context for indices futures traders monitoring energy-sector sentiment.
Market Data Snapshot
ETF Snapshot of major stock market ETFs, Mag7, and others as of: September 30, 2026 05:00
Top Movers & Losers
- USO 145.66 Bullish 1.61% ▲
- AAPL 333.02 Bullish 1.10% ▲
- GOOG 340.74 Bullish 1.01% ▲
- IJH 71.95 Bearish -0.58% ▼
- DIA 508.55 Bearish -0.84% ▼
- META 725.18 Bearish -1.84% ▼
Major Index ETFs: SPY, QQQ, DIA, IWM, IJH
- QQQ 739.77 Bullish 0.25% ▲
- SPY 762.63 Bearish -0.21% ▼
- IWM 277.89 Bearish -0.40% ▼
- IJH 71.95 Bearish -0.58% ▼
- DIA 508.55 Bearish -0.84% ▼
Major Index ETFs were Mixed: QQQ was the most bullish mover at +0.25%, while DIA was the most bearish mover at -0.84%. SPY was Bearish at -0.21%, with IWM at -0.40% and IJH at -0.58%.
Mag 7 Stocks: AAPL, MSFT, GOOG, AMZN, META, NVDA, TSLA
- AAPL 333.02 Bullish 1.10% ▲
- GOOG 340.74 Bullish 1.01% ▲
- AMZN 249.15 Bullish 1.01% ▲
- MSFT 512.90 Bullish 0.77% ▲
- TSLA 354.81 Bullish 0.56% ▲
- NVDA 228.38 Bullish 0.51% ▲
- META 725.18 Bearish -1.84% ▼
Mixed Mag7 snapshot: AAPL is the most bullish mover at +1.10%, followed by GOOG and AMZN at +1.01% each. MSFT gained +0.77%, TSLA +0.56%, and NVDA +0.51%. META is the most bearish mover at -1.84%, creating notable divergence within the group.
Cross-Market ETFs: TLT, GLD, USO, IBIT
- USO 145.66 Bullish 1.61% ▲
- IBIT 47.34 Bullish 0.02% ▲
- GLD 380.84 Bearish -0.54% ▼
- TLT 77.78 Bearish -0.58% ▼
Other ETFs were Mixed: USO was the most bullish mover at +1.61%, while IBIT was marginally Bullish at +0.02%. TLT was the most bearish mover at -0.58%, with GLD also Bearish at -0.54%.
ETF, Mag7, and Cross-Market ETF Insights
Overall Tone
Mixed, with Mag7 gains led by AAPL while broad equity ETFs were Bearish and energy strength contrasted with weaker bonds and gold.
Equity ETFs and Mag7:
Major Index ETFs were Bearish overall: QQQ was marginally Bullish at +0.25%, while SPY fell -0.21%, IWM -0.40%, IJH -0.58%, and DIA -0.84%. Mag7 performance was selective, with AAPL the most bullish equity mover at +1.10%, followed by GOOG and AMZN at +1.01%, while META was the most bearish mover at -1.84%. MSFT rose +0.77%, TSLA +0.56%, and NVDA +0.51%, showing concentrated technology leadership against broader ETF weakness.
Cross-Market ETFs:
Cross-market performance was Mixed, led by USO as the most bullish mover at +1.61%, while IBIT was near-flat at +0.02%. GLD declined -0.54% and TLT was the most bearish cross-market mover at -0.58%, leaving energy strength divergent from weaker bonds and gold.
Futures Indices – Higher Time Frame Analysis
Summary of the current state of US Indices Futures based on higher time-frame (HTF) technical analysis as of: 2026-09-30: 17:00 CT.
US Indices Futures
- ES YSFG up, MSFG/WSFG below F0%, benchmarks rising longer-term, 7564.75 support, 7906.25 pivot resistance, short-term pullback.
- NQ YSFG/MSFG up, WSFG below F0%, benchmarks broadly rising, 28728.25 pivot low, 31094.75-31389.25 resistance, mixed short-term structure.
- YM YSFG up, MSFG/WSFG below F0%, short benchmarks lower, 51459-51498 support, 52671-53381 recovery resistance, corrective downswing.
- EMD YSFG up, MSFG/WSFG below F0%, benchmarks lower through intermediate periods, 3617.1-3632.6 support, 3706.0-3896.8 resistance.
- RTY YSFG up, MSFG/WSFG below centers, benchmarks lower near-term, 2811.9 support, 2893.5-2975.9 pivot-reversal resistance, DTrend active.
- FDAX YSFG up, MSFG/WSFG below F0%, benchmarks lower through 100-period, 25337 support, 25943-25990 recovery resistance, 26847 swing-high resistance.
Overall State
- Short-Term: Bearish
- Intermediate-Term: Bearish
- Long-Term: Bullish
Conclusion
US index futures show broadly aligned short-term corrective conditions: MSFG and WSFG readings are generally below F0% areas, with lower pivots and declining near-term benchmarks. ES, YM, EMD, RTY, and FDAX are bearish near-term; NQ remains mixed with intermediate and long-term alignment upward. YSFG trends and rising longer-period benchmarks retain bullish long-term structure across the group. Key pivot supports define current downside references, while overhead pivot and benchmark clusters define resistance.
Note: Intra-day counter-trend pullbacks or retracements may occur, HTF is context for informational usage and market structure. Glossary: Session Fib Grids periods of YSFG:’Yearly’, MSFG:’Monthly’, WSFG:’Weekly’
For full details visit: AlphaWebTrader Technicals
ES Daily View
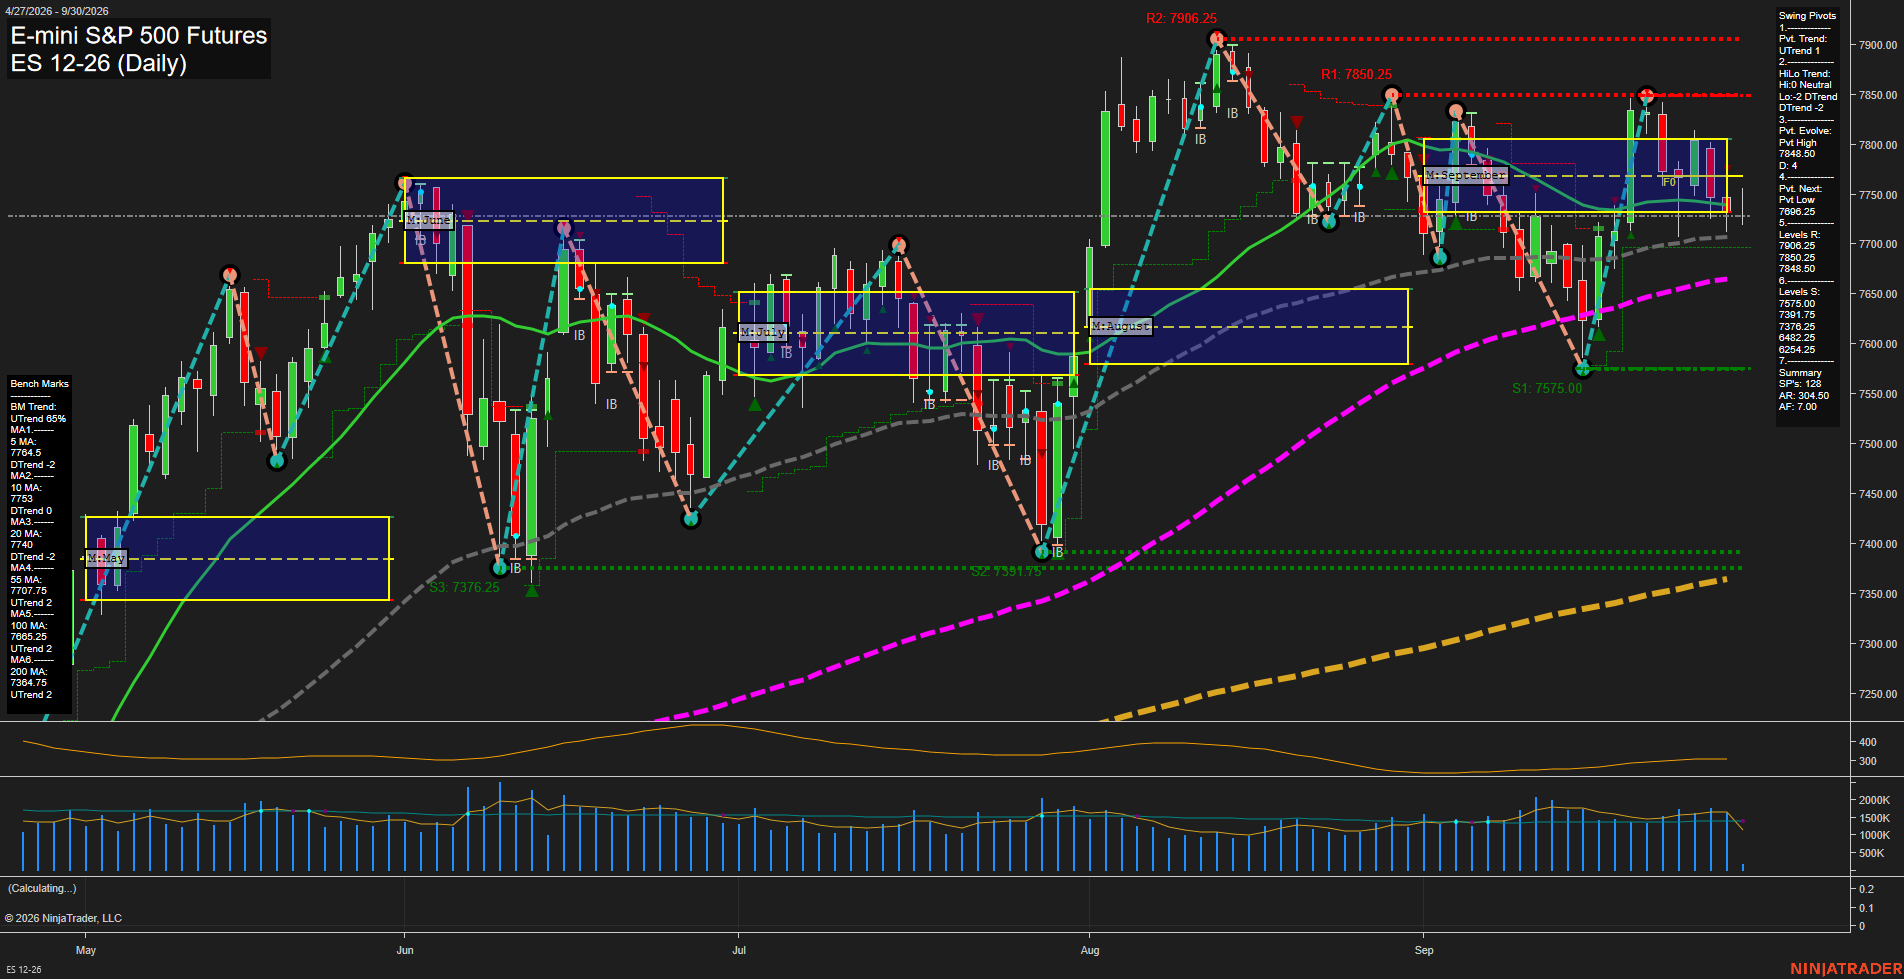
Overall Rating
- Short-Term: Bearish
- Intermediate-Term: Bearish
- Long-Term: Bullish.
Key Insights Summary
Price is consolidating beneath the declining 5-, 10-, and 20-day benchmarks and below both weekly and monthly Fib-grid balance, reflecting a short-term corrective tone following rejection from the 7848.50 to 7850.25 resistance area. The pivot structure retains a short-term UTrend designation, but the intermediate HiLo condition remains down, creating a choppy countertrend environment between 7575.00 support and 7848.50 resistance. The broader structure remains constructive above rising 55-, 100-, and 200-day averages, with the yearly grid still positive; however, elevated ATR and recent lower-high behavior indicate a volatile retracement rather than a smooth directional advance.
View charts on: AlphaWebTrader HTF Charts
NQ Daily View
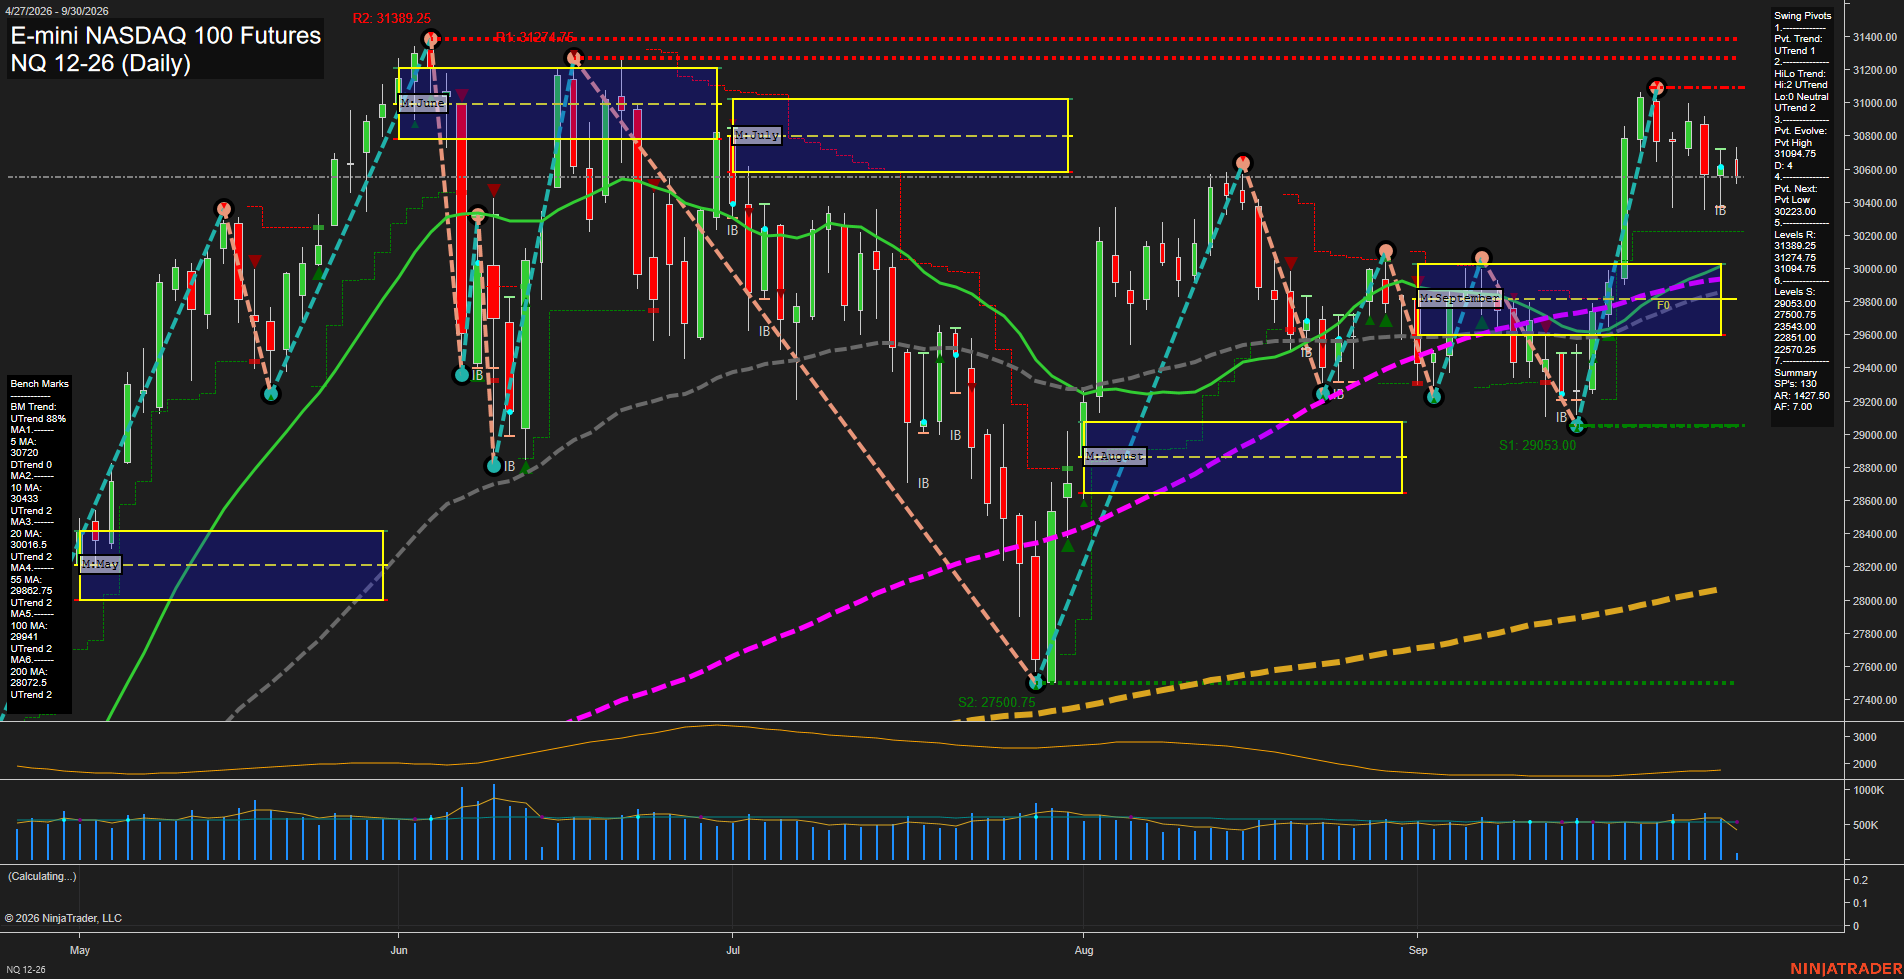
Overall Rating
- Short-Term: Neutral
- Intermediate-Term: Bullish
- Long-Term: Bullish.
Key Insights Summary
Price is consolidating just beneath the 31094.75 pivot-high resistance after a sharp late-September recovery from the 29053.00 support area. The short-term structure is mixed: the pivot trend remains upward and price holds above the 10-day average, while the declining
View charts on: AlphaWebTrader HTF Charts
CL Daily View
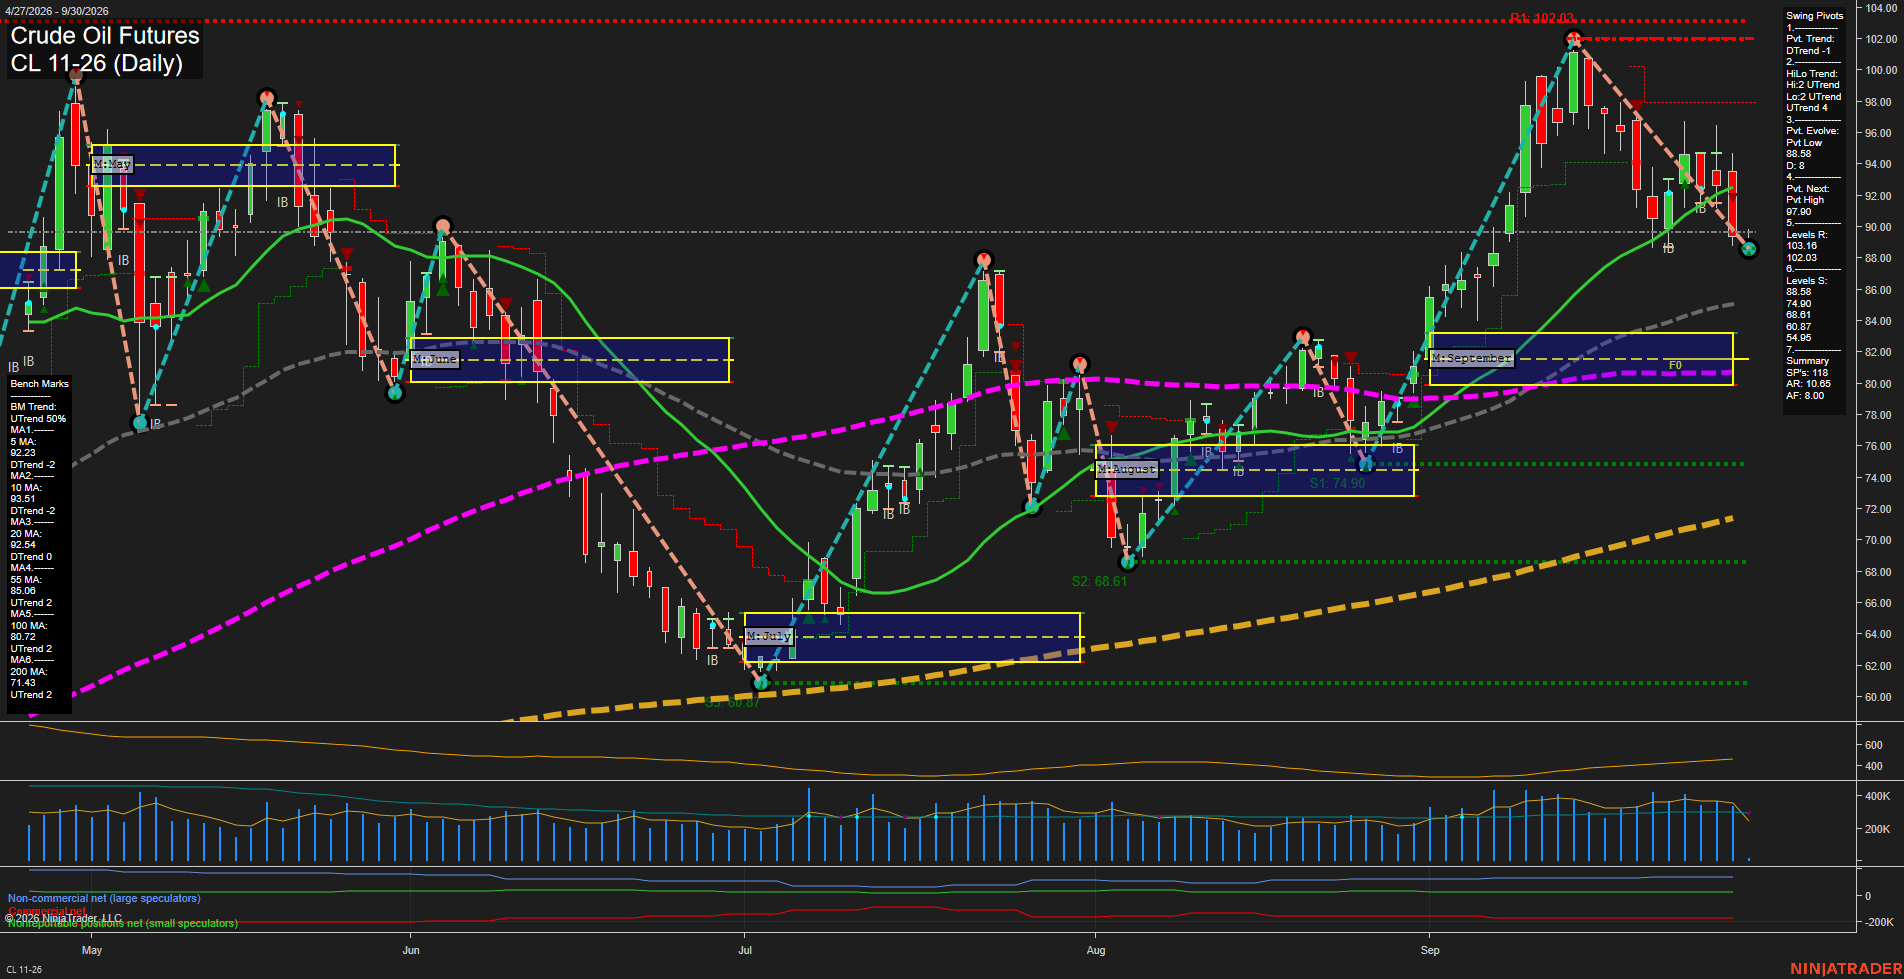
Overall Rating
- Short-Term: Bearish
- Intermediate-Term: Neutral
- Long-Term: Bullish.
Key Insights Summary
Price has undergone a fast, medium-range pullback from the 102.03 swing-high area and has established a short-term DTrend with price below the 5, 10, and 20-day benchmarks. The weekly grid is negative and recent short signals align with the active decline. However, the intermediate HiLo structure remains upward and price holds above the rising 55, 100, and 200-day averages, characterizing the current action as a sharp countertrend retracement within a broader long-term advance. The 88.58 pivot low is the immediate structural reference, while 92.23 to 93.51 marks the nearby short-term moving-average congestion zone.
View charts on: AlphaWebTrader HTF Charts
GC Daily View
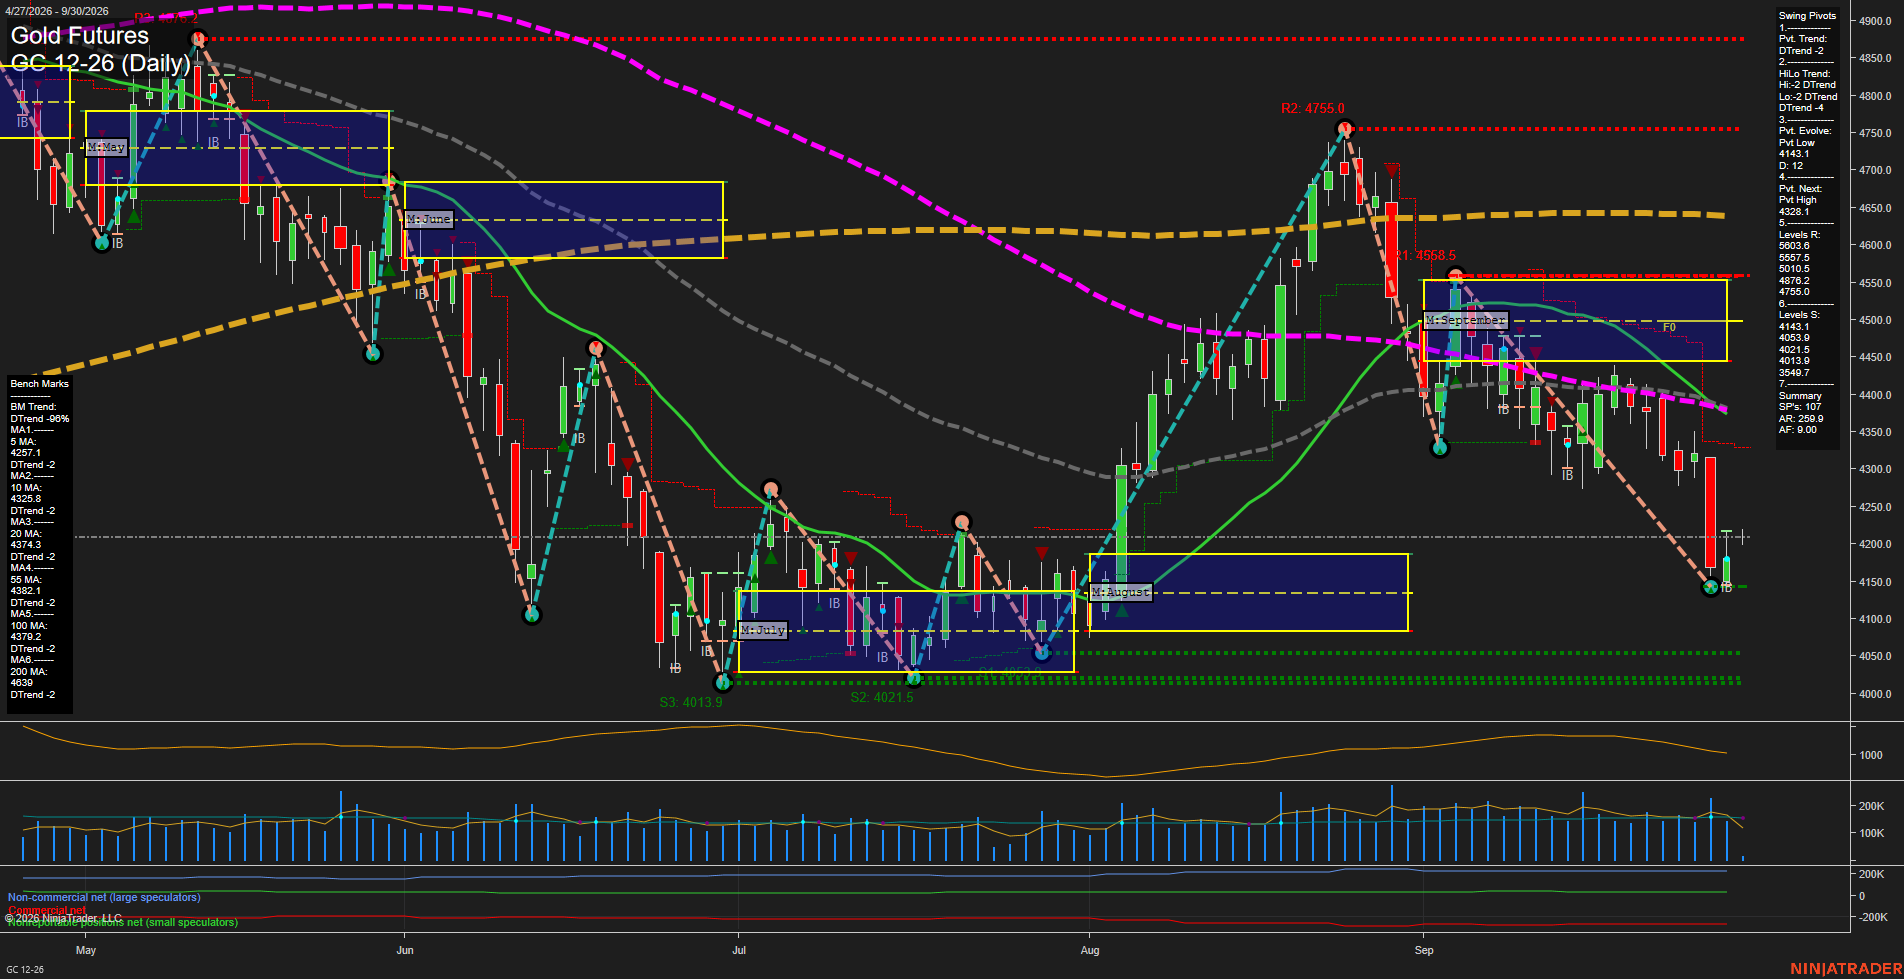
Overall Rating
- Short-Term: Bearish
- Intermediate-Term: Bearish
- Long-Term: Bearish.
Key Insights Summary
Price remains below the weekly, monthly, and yearly Fib-grid centers, while both pivot structures are in DTrend. The sharp September decline has pushed price beneath every daily benchmark, creating broad downside alignment from the 5-day through the 200-day average. The 4143.1 pivot low is the immediate swing reference, with lower support clustered near 4053.9 to 4013.9; 4328.0 is the next pivot-reversal threshold, followed by benchmark resistance in the 4374.3 to 4382.1 area. Large recent ranges and elevated ATR reflect a fast, volatile liquidation phase following the rejection from the 4755.0 swing high.
View charts on: AlphaWebTrader HTF Charts
ZB Daily View
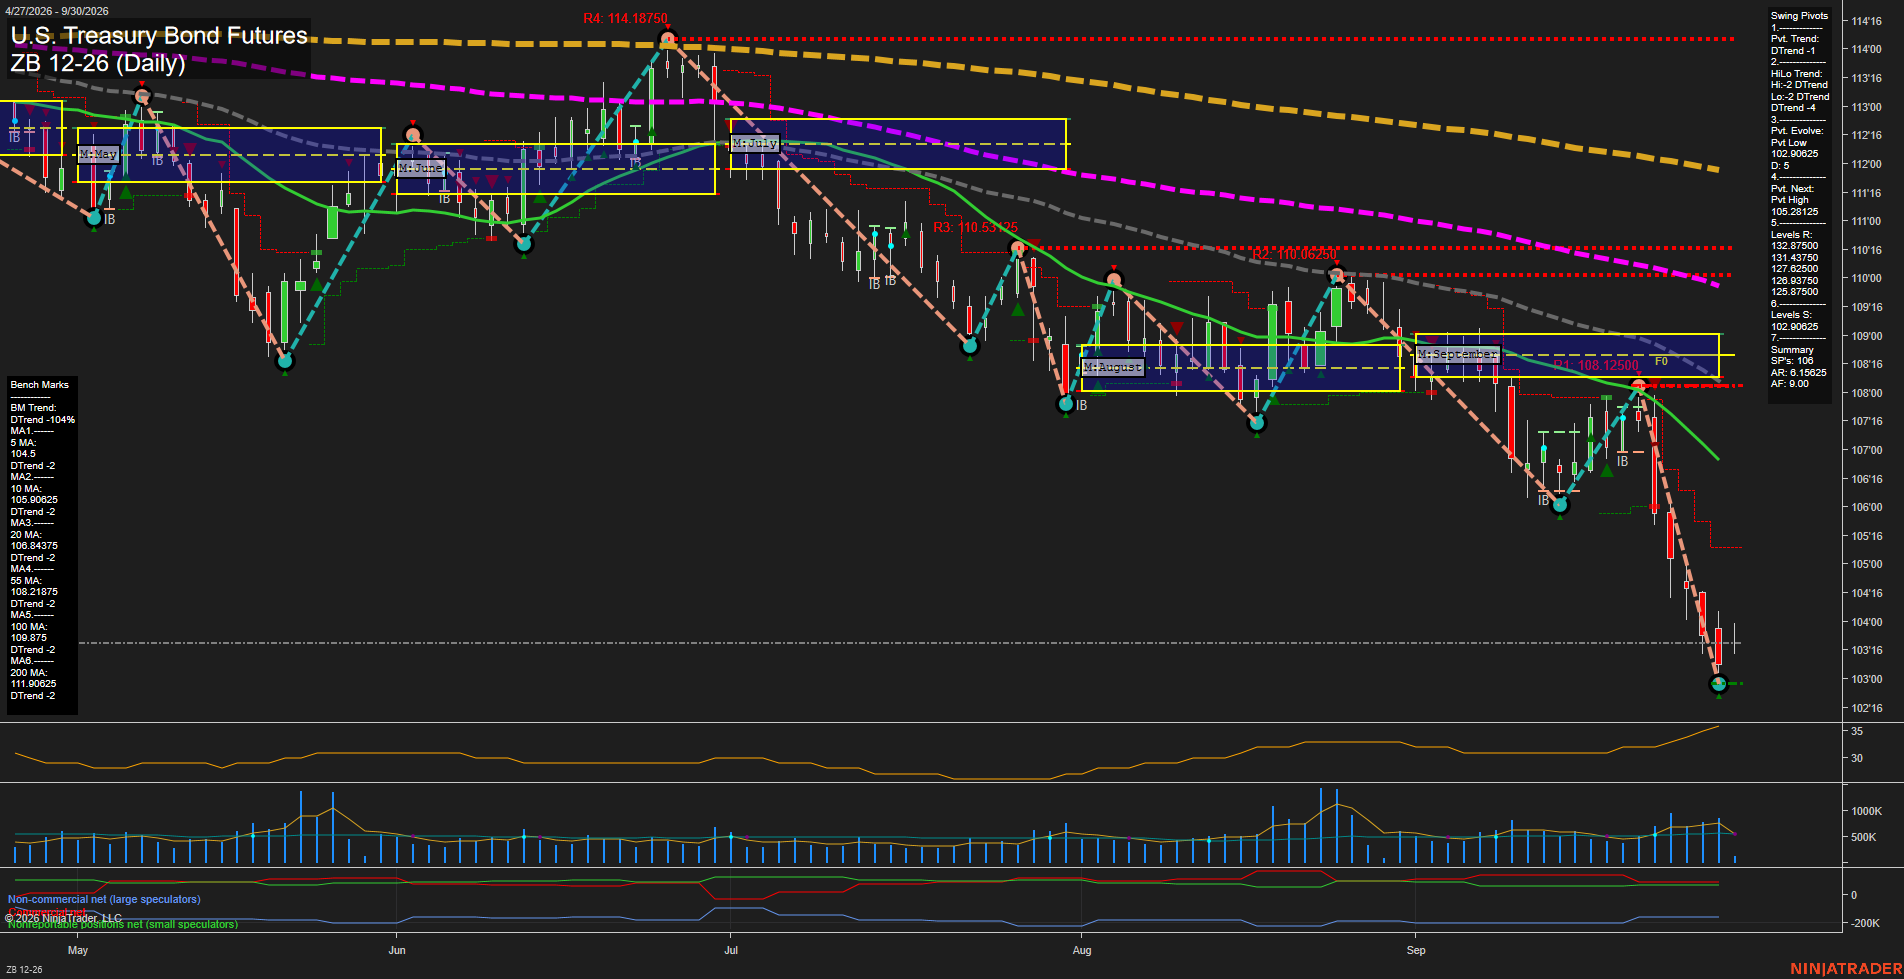
Overall Rating
- Short-Term: Bearish
- Intermediate-Term: Bearish
- Long-Term: Bearish.
Key Insights Summary
ZB is in a broad, synchronized bearish swing structure: price is below the weekly, monthly, and yearly Fib reference zones, the pivot trend and HiLo trend are both down, and all six benchmark averages are declining above price. The recent selloff accelerated through the September MSFG lower area with large-range bars and fast downside momentum, producing a fresh pivot low near 102.90625. The latest small bars near 103'18 reflect a pause following the decline rather than a confirmed reversal, while 105.28125 marks the next pivot-reversal reference. Recent short-, intermediate-, and long-term signal themes remain aligned with the prevailing downtrend.
View charts on: AlphaWebTrader HTF Charts