U.S. futures rise as yields ease before PCE data, while ETF movers, oil shipping risks and mixed tech signals shape the pre-market outlook today.
Fundamentals: U.S. equity futures moved higher in pre-market trading as Treasury yields eased following dovish-leaning Fed remarks. Investors awaited Core PCE inflation and final GDP data, while oil markets balanced recovering Persian Gulf exports against Strait of Hormuz shipping risks. Metals remained under pressure, and technology stocks faced mixed signals from AI spending, regulatory scrutiny and China chip developments.
Technicals: META, GLD and IBIT led prior-session ETF gains, while USO, AAPL and TSLA declined. Futures technicals show bearish short-term and intermediate conditions across ES, YM, EMD, RTY and FDAX, while NQ remains neutral short term. Most contracts retain constructive long-term structures despite corrective price action and nearby support-resistance tests.
Pre-Market Trading 360° view Market Radar of: holidays, earnings, eco-news, market-news summary, news sentiment, prior session major ETFs, MAG7, Higher Time Frame Analysis Indices Futures Summary, and E-mini S&P500, Nasdaq 100, NYMEX Crude, Gold Futures Daily Chart analysis.
As of: September 30, 2026 07:16 CT
Earnings Radar
Monitoring for earnings releases by the Magnificent 7, AI-tech-related firms, and major financial institutions.
- MU Release: 2026-09-30 T:AMC
Conclusion: Micron (MU) reports after the close on 2026-09-30, placing semiconductor and AI-memory earnings in focus for index futures into the next session. Market momentum and volume can slow ahead of this major semiconductor earnings release.
For full details visit: Yahoo Earnings Calendar
EcoNews Radar U.S. Events
| Day | Time | Impact | Event |
|---|---|---|---|
| Wed | 08:30 | High | Core PCE Price Index m/m |
| Wed | 08:30 | High | Final GDP q/q |
| Wed | 08:30 | Medium | Final GDP Price Index q/q |
| Wed | 10:30 | Low | Crude Oil Inventories |
| Wed | 15:30 | Medium | President Trump Speaks |
| Thu | 08:30 | Medium | Unemployment Claims |
| Thu | 10:00 | Medium | FOMC Member Waller Speaks |
| Thu | 10:00 | Medium | ISM Manufacturing PMI |
| Fri | 08:30 | High | Average Hourly Earnings m/m |
| Fri | 08:30 | High | Non-Farm Employment Change |
| Fri | 08:30 | High | Unemployment Rate |
EcoNews Summary
High-impact U.S. inflation, growth, and labor releases dominate the schedule for index futures. Wednesday’s 08:30 releases focus on inflation and economic growth, while Friday’s 08:30 labor data provides the week’s primary market-moving event cluster.
Event Notes:
- Wednesday 08:30 Core PCE Price Index m/m: Measures monthly changes in consumer prices excluding food and energy. It is a key inflation gauge monitored for implications for interest-rate expectations and index-futures valuation.
- Wednesday 08:30 Final GDP q/q: Measures the final estimate of quarterly U.S. economic growth. Traders monitor it for confirmation of changes in economic activity, corporate-demand conditions, and policy expectations.
- Friday 08:30 Average Hourly Earnings m/m: Measures monthly wage growth. It is monitored as an indicator of labor-cost pressure and inflation conditions.
- Friday 08:30 Non-Farm Employment Change: Measures the monthly change in U.S. employment outside the farm sector. It is closely watched as a broad indicator of labor-market strength and economic momentum.
- Friday 08:30 Unemployment Rate: Measures the share of the labor force actively seeking work. It provides context on labor-market slack and household employment conditions.
Conclusion:
The single most important event is Friday at 08:30, Non-Farm Employment Change, within the high-impact employment release cluster. Market momentum and volume often slow ahead of major releases such as Wednesday’s Core PCE and Final GDP data, with increased volatility at release time.
For full details visit: Forex Factory EcoNews
Market News Summary:
Equity futures firmed as Treasury yields retreated on reduced Fed-hike expectations, while PCE inflation data and Gulf oil developments remained key market catalysts.
Primary Drivers & Risks:
- Primary Driver: Reduced Fed rate-hike expectations
- Primary Risk: PCE inflation and Gulf oil disruption
Tone:
Cautiously constructive, with inflation and energy risks limiting conviction.
Stock Market / ETFs / Indices:
U.S. stock futures trended higher early Wednesday as lower Treasury yields eased pressure on risk assets. Asian equities mostly rose on the shift in Fed expectations. AI spending and strong corporate results remained supportive, while scrutiny of large technology companies’ data-center arrangements and China’s development of Huawei chip tools added technology-sector cross-currents.
Geopolitical:
Iran-related sanctions discussions and Qatar-mediated diplomacy remained focused on proposals involving the Strait of Hormuz. Continued shipping risks persisted despite recovering Middle East crude flows.
Oil / Energy:
Oil prices showed mixed movement: prices rose after Trump denied offering Iran sanctions relief, then weakened as Persian Gulf exports recovered toward normal levels. Crude shipments were reported near pre-war levels, while refined-product flows remained lower. OPEC+ producers were reported to be holding output targets steady for November.
Gold / Metals:
Gold and silver remained pressured by elevated Treasury yields and attention on PCE inflation. Gold recorded its steepest one-day decline in over two months, while silver’s extended decline highlighted continued weakness across metals.
Fed / Financials:
Treasury yields retreated from multiyear highs after dovish-leaning Fed remarks reduced near-term rate-hike pricing. The move provided relief to equities, although mortgage rates continued rising, reaching 7.58% in one survey and weighing on refinancing and homebuyer demand.
Macro / Other:
PCE inflation data was the central domestic macro event. Holiday retail sales were projected to exceed $1 trillion, with inflation contributing to nominal growth and consumers emphasizing discounts.
Conclusion:
Lower Fed-hike expectations and falling Treasury yields supported equity futures and broader risk appetite. PCE inflation data remained the immediate macro focus.
Oil markets faced opposing forces from Gulf export recovery and Strait of Hormuz uncertainty. High mortgage rates, weak metals, and technology-sector regulatory and competitive developments remained cross-currents.
Market News Sentiment
Market News Articles: 46
- Neutral: 56.52%
- Negative: 28.26%
- Positive: 15.22%
Sentiment Summary: Of 46 market news articles, 57% were neutral, 28% negative, and 15% positive, indicating predominantly neutral coverage with a negative skew among directional items.
Conclusion: Indices futures day traders face a news backdrop with limited positive sentiment and more negative than positive coverage.
GLD,Gold Articles: 16
- Neutral: 56.25%
- Negative: 25.00%
- Positive: 18.75%
Sentiment Summary: Gold-related coverage is predominantly neutral at 56%, with 25% negative and 19% positive sentiment across 16 articles.
Conclusion: The news tone around GLD and gold is neutral overall, with negative coverage exceeding positive coverage.
USO,Oil Articles: 11
- Negative: 63.64%
- Positive: 18.18%
- Neutral: 18.18%
Sentiment Summary: USO and oil coverage is predominantly negative, with 64% negative, 18% positive, and 18% neutral articles across 11 items.
Conclusion: Oil-related news tone is negative, indicating a potentially unfavorable energy-sector sentiment input for indices futures traders.
Market Data Snapshot
ETF Snapshot of major stock market ETFs, Mag7, and others as of: September 30, 2026 07:16
Top Movers & Losers
- META 738.79 Bullish 3.24% ▲
- GLD 382.89 Bullish 1.32% ▲
- IBIT 47.33 Bullish 0.25% ▲
- TSLA 352.84 Bearish -1.29% ▼
- AAPL 329.40 Bearish -2.66% ▼
- USO 143.35 Bearish -4.44% ▼
Major Index ETFs: SPY, QQQ, DIA, IWM, IJH
- QQQ 737.93 Bullish 0.19% ▲
- IJH 72.37 Bearish -0.10% ▼
- SPY 764.20 Bearish -0.18% ▼
- DIA 512.88 Bearish -0.22% ▼
- IWM 279.01 Bearish -0.36% ▼
Mixed index ETF action: QQQ is the most bullish mover at +0.19%, while IWM is the most bearish mover at -0.36%. SPY is Bearish at -0.18%, DIA is Bearish at -0.22%, and IJH is marginally Bearish at -0.10%.
Mag 7 Stocks: AAPL, MSFT, GOOG, AMZN, META, NVDA, TSLA
- META 738.79 Bullish 3.24% ▲
- AMZN 246.67 Bullish 0.21% ▲
- MSFT 508.96 Bearish -0.05% ▼
- GOOG 337.32 Bearish -0.54% ▼
- NVDA 227.21 Bearish -0.72% ▼
- TSLA 352.84 Bearish -1.29% ▼
- AAPL 329.40 Bearish -2.66% ▼
Mixed: META is the most bullish mover at +3.24%, while AMZN adds a marginal +0.21%. AAPL is the most bearish mover at -2.66%; TSLA declines -1.29%, NVDA -0.72%, and GOOG -0.54%. MSFT is near-flat and Bearish at -0.05%.
Cross-Market ETFs: TLT, GLD, USO, IBIT
- GLD 382.89 Bullish 1.32% ▲
- IBIT 47.33 Bullish 0.25% ▲
- TLT 78.23 Bearish -0.50% ▼
- USO 143.35 Bearish -4.44% ▼
Other ETFs are Mixed: GLD is the most bullish mover at +1.32%, with IBIT also Bullish at +0.25%. USO is the most bearish mover at -4.44%, while TLT is Bearish at -0.50%.
ETF, Mag7, and Cross-Market ETF Insights
Overall Tone
Mixed: META leadership and GLD strength contrast with broadly Bearish index ETFs, Mag7 dispersion, and sharp USO weakness.
Equity ETFs and Mag7:
Major Index ETFs were broadly Bearish, with QQQ marginally Bullish at +0.19%, while SPY fell -0.18%, DIA -0.22%, IWM -0.36%, and IJH was near-flat Bearish at -0.10%; IWM was the most bearish index ETF. Mag7 performance was selective: META was the most bullish equity mover at +3.24%, AMZN gained +0.21%, and MSFT was marginally Bearish at -0.05%. GOOG declined -0.54%, NVDA -0.72%, TSLA -1.29%, and AAPL was the most bearish equity mover at -2.66%.
Cross-Market ETFs:
Cross-market ETFs were Mixed, with GLD the most bullish mover at +1.32% and IBIT modestly Bullish at +0.25%. TLT was Bearish at -0.50%, while USO was the most bearish cross-market mover and the largest decline overall at -4.44%. GLD strength diverged from Bearish equity ETFs, while USO weakness was pronounced.
Futures Indices – Higher Time Frame Analysis
Summary of the current state of US Indices Futures based on higher time-frame (HTF) technical analysis as of: 2026-09-30: 07:16 CT.
US Indices Futures
- ES: YSFG up; MSFG/WSFG below F0%; benchmarks rising longer-term; pivots 7564.75 support, 7906.25 resistance; short-term pullback.
- NQ: YSFG/MSFG up; WSFG below F0%; benchmarks broadly rising; pivots 28728.25 support, 31094.75-31389.25 resistance; neutral short-term consolidation.
- YM: YSFG up; MSFG/WSFG below F0%; short benchmarks lower; pivots 51459-51498 support, 53381 resistance; corrective DTrend.
- EMD: YSFG up; MSFG/WSFG below F0%; benchmarks lower through 100-period; pivots 3617.1-3632.6 support, 3706.0-3896.8 resistance.
- RTY: YSFG up; MSFG/WSFG below centers; short benchmarks lower; pivots 2811.9 support, 2893.5-2975.9 reversal resistance; DTrend.
- FDAX: YSFG up; MSFG/WSFG below F0%; benchmarks lower through 100-period; pivots 25337 support, 25943-25990 resistance, 26847 swing-high.
Overall State
- Short-Term: Bearish
- Intermediate-Term: Bearish
- Long-Term: Bullish
Conclusion
ES, YM, EMD, RTY, and FDAX align below WSFG and MSFG balance areas with lower short-term pivots and benchmarks. NQ remains comparatively firmer, retaining intermediate and long-term upward alignment despite weekly countertrend conditions. YSFG and rising longer-term benchmarks maintain broad bullish structure across most contracts, while defined pivot supports remain the primary downside references and recent swing highs define overhead resistance.
Note: Intra-day counter-trend pullbacks or retracements may occur, HTF is context for informational usage and market structure. Glossary: Session Fib Grids periods of YSFG:’Yearly’, MSFG:’Monthly’, WSFG:’Weekly’
For full details visit: AlphaWebTrader Technicals
ES Daily View
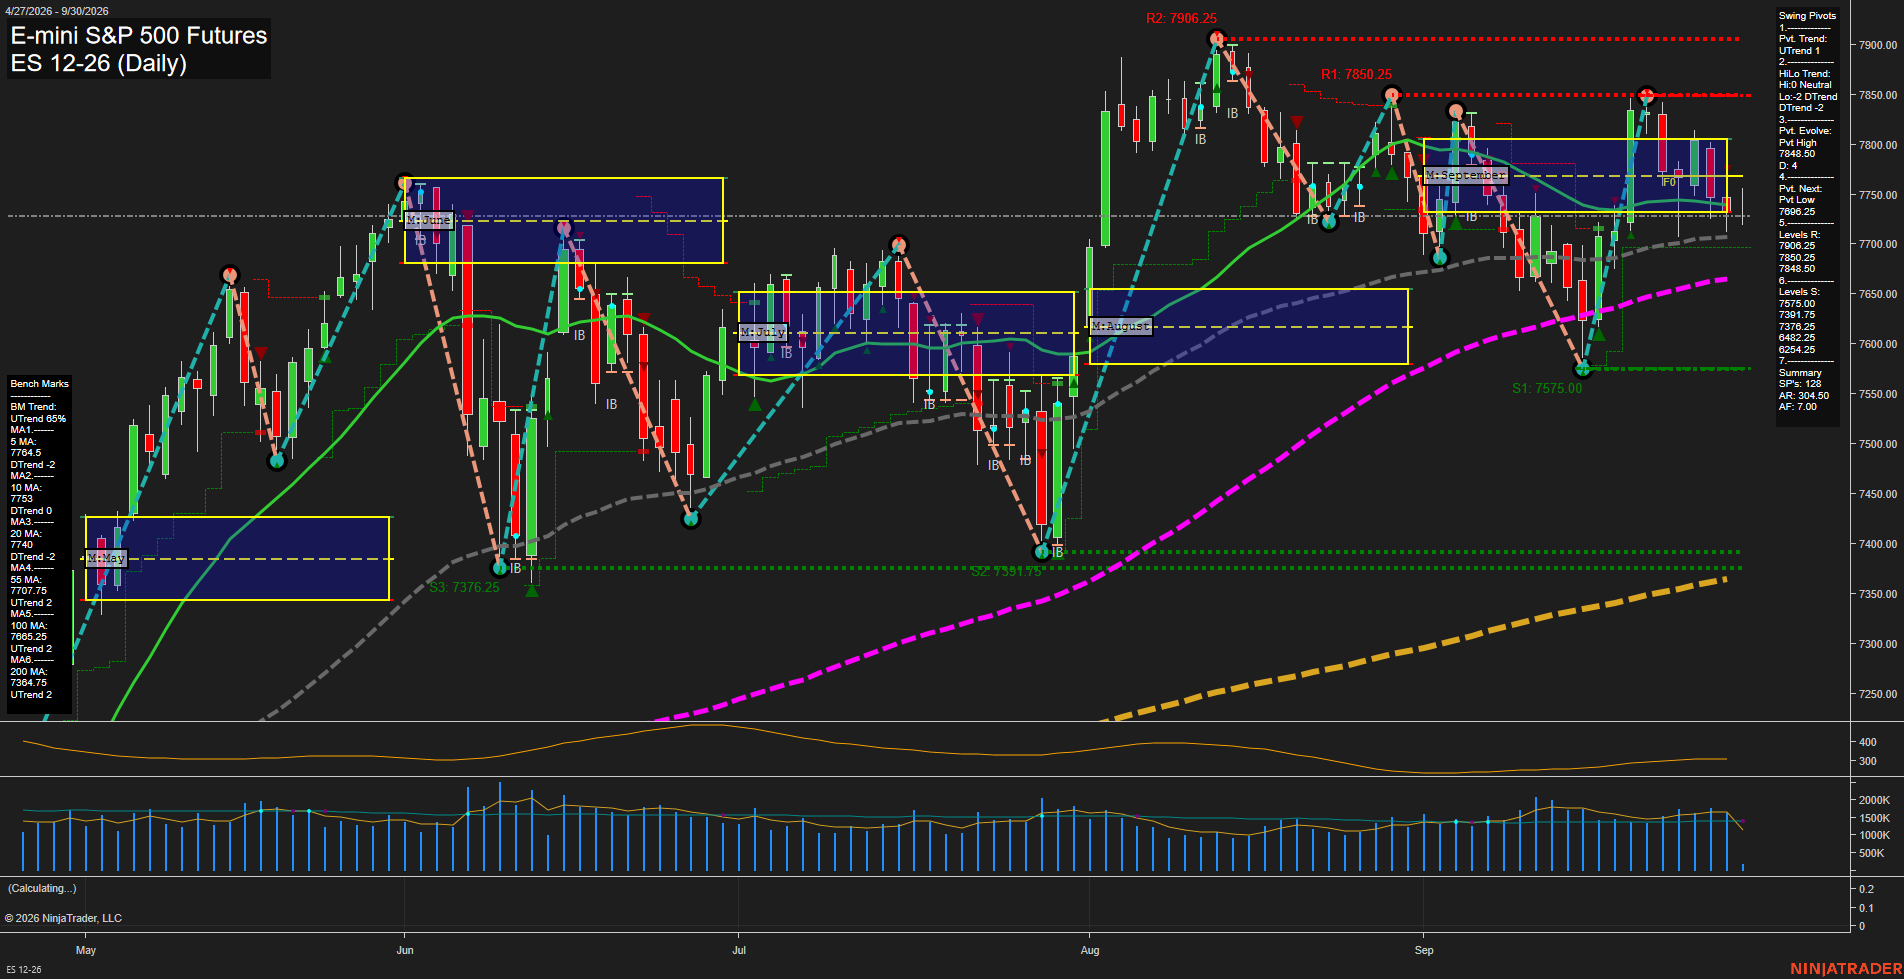
Overall Rating
- Short-Term: Bearish
- Intermediate-Term: Bearish
- Long-Term: Bullish.
Key Insights Summary
Price is consolidating beneath the declining 5-, 10-, and 20-day benchmarks and below both weekly and monthly Fib-grid balance, reflecting a short-term corrective tone following rejection from the 7848.50 to 7850.25 resistance area. The pivot structure retains a short-term UTrend designation, but the intermediate HiLo condition remains down, creating a choppy countertrend environment between 7575.00 support and 7848.50 resistance. The broader structure remains constructive above rising 55-, 100-, and 200-day averages, with the yearly grid still positive; however, elevated ATR and recent lower-high behavior indicate a volatile retracement rather than a smooth directional advance.
View charts on: AlphaWebTrader HTF Charts
NQ Daily View
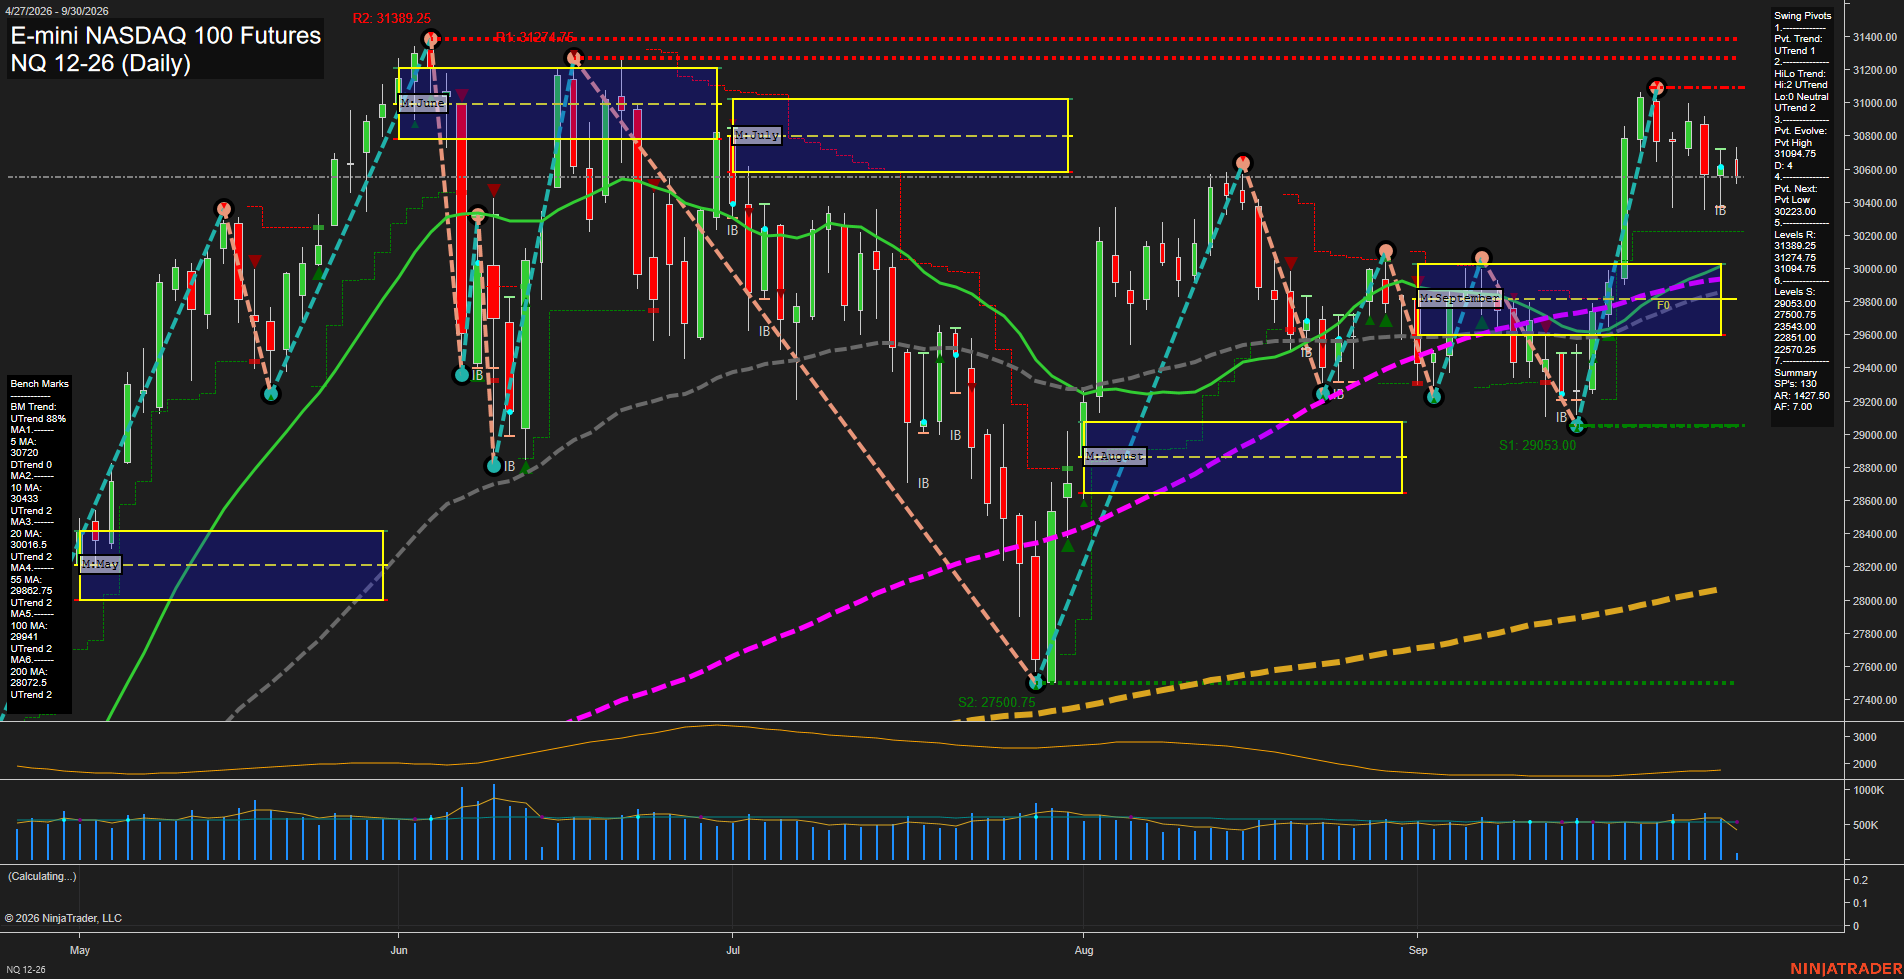
Overall Rating
- Short-Term: Neutral
- Intermediate-Term: Bullish
- Long-Term: Bullish.
Key Insights Summary
Price is consolidating just beneath the 31094.75 pivot-high resistance after a sharp late-September recovery from the 29053.00 support area. The short-term structure is mixed: the pivot trend remains upward and price holds above the 10-day average, while the declining
View charts on: AlphaWebTrader HTF Charts
CL Daily View
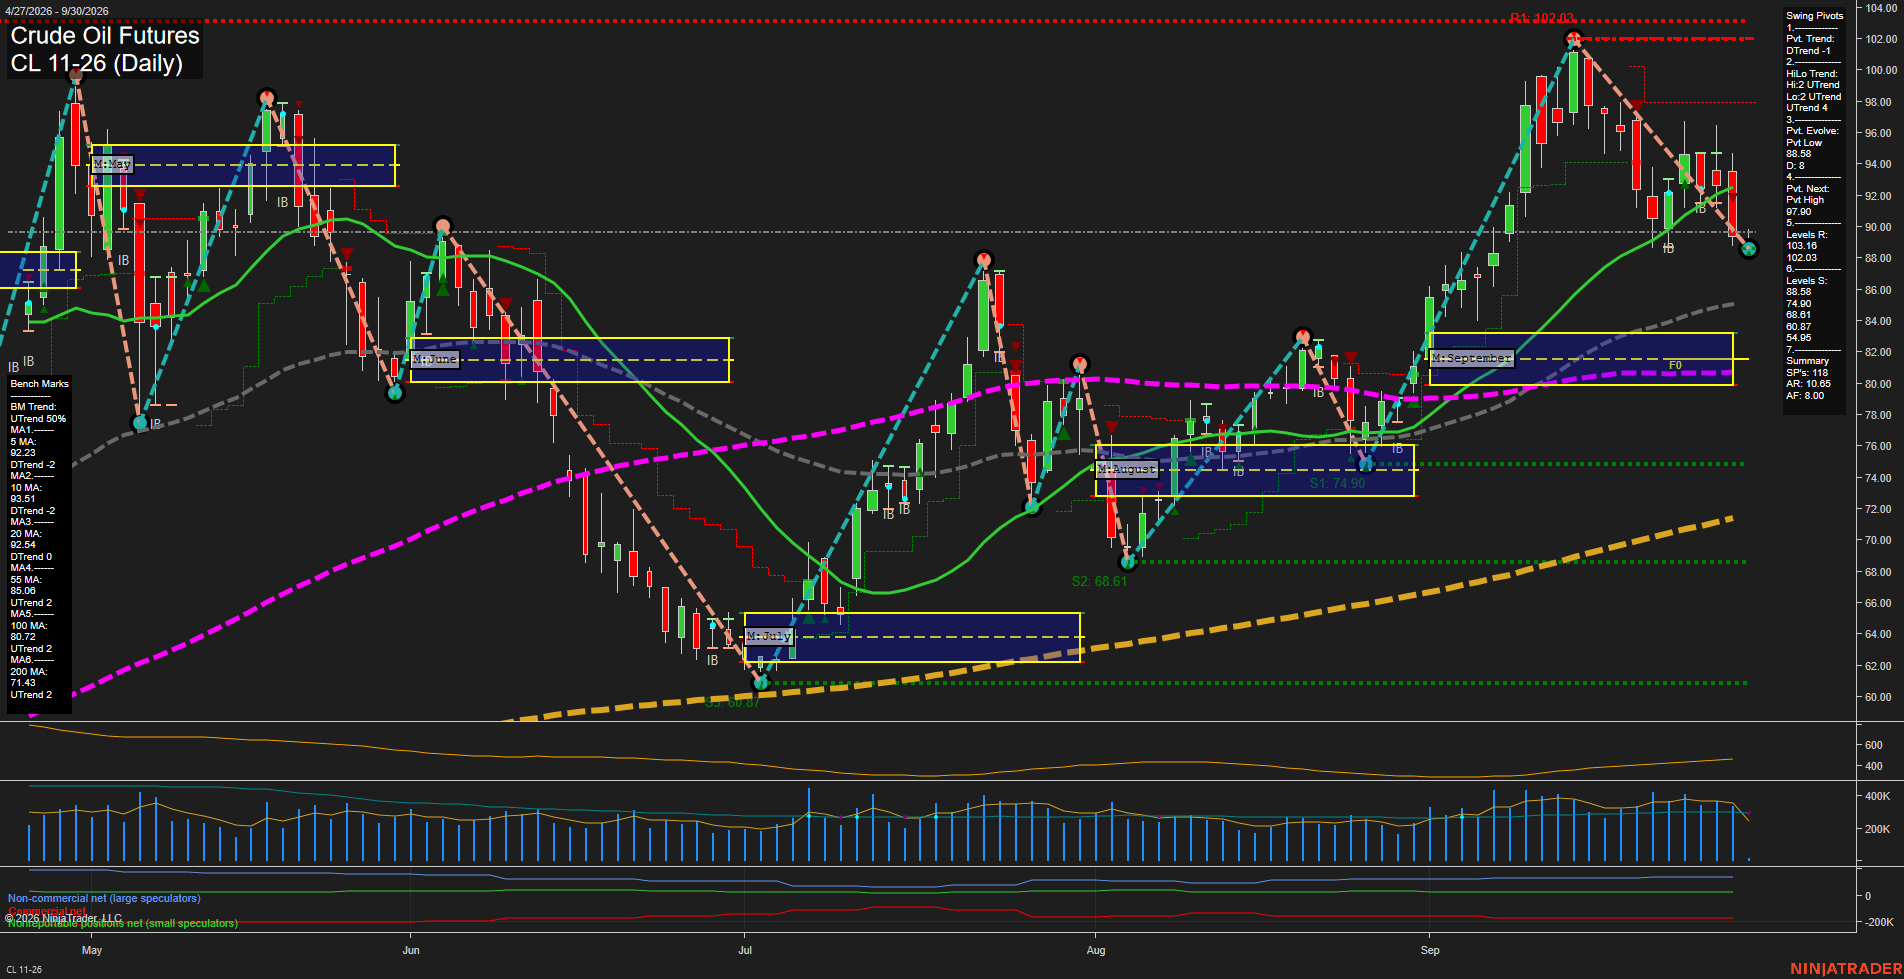
Overall Rating
- Short-Term: Bearish
- Intermediate-Term: Neutral
- Long-Term: Bullish.
Key Insights Summary
Price has undergone a fast, medium-range pullback from the 102.03 swing-high area and has established a short-term DTrend with price below the 5, 10, and 20-day benchmarks. The weekly grid is negative and recent short signals align with the active decline. However, the intermediate HiLo structure remains upward and price holds above the rising 55, 100, and 200-day averages, characterizing the current action as a sharp countertrend retracement within a broader long-term advance. The 88.58 pivot low is the immediate structural reference, while 92.23 to 93.51 marks the nearby short-term moving-average congestion zone.
View charts on: AlphaWebTrader HTF Charts
GC Daily View
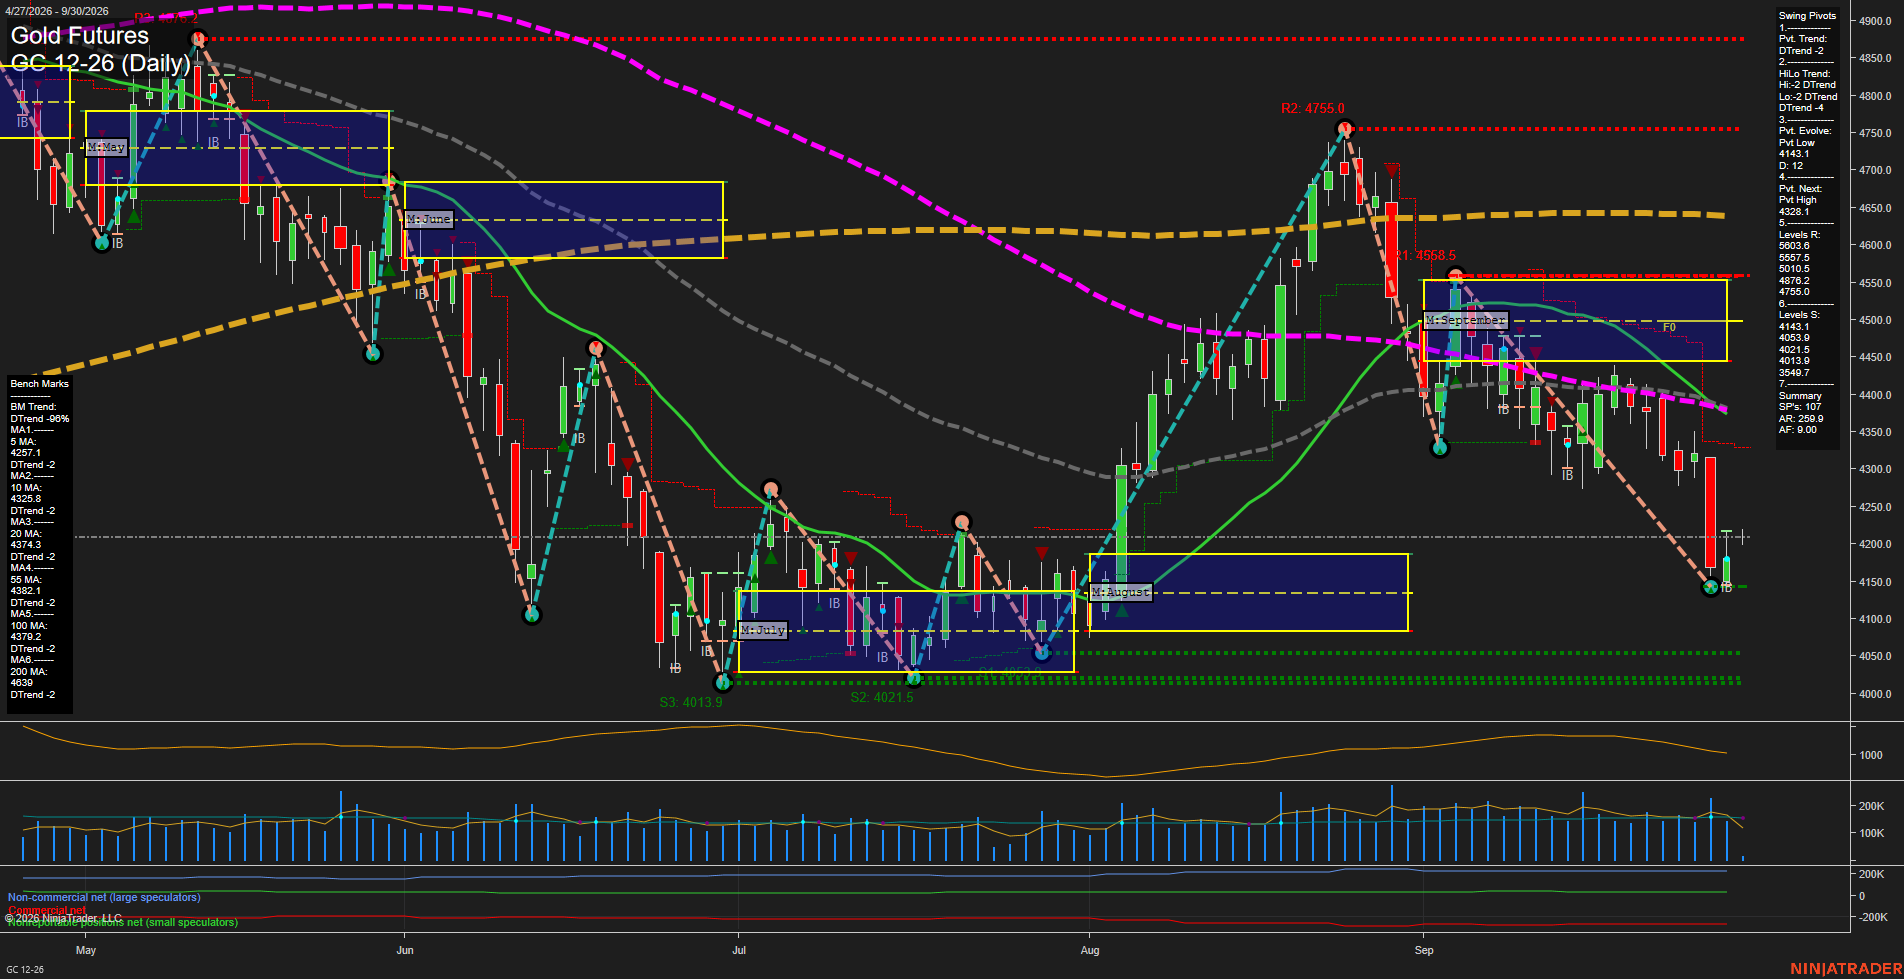
Overall Rating
- Short-Term: Bearish
- Intermediate-Term: Bearish
- Long-Term: Bearish.
Key Insights Summary
Price remains below the weekly, monthly, and yearly Fib-grid centers, while both pivot structures are in DTrend. The sharp September decline has pushed price beneath every daily benchmark, creating broad downside alignment from the 5-day through the 200-day average. The 4143.1 pivot low is the immediate swing reference, with lower support clustered near 4053.9 to 4013.9; 4328.0 is the next pivot-reversal threshold, followed by benchmark resistance in the 4374.3 to 4382.1 area. Large recent ranges and elevated ATR reflect a fast, volatile liquidation phase following the rejection from the 4755.0 swing high.
View charts on: AlphaWebTrader HTF Charts
ZB Daily View
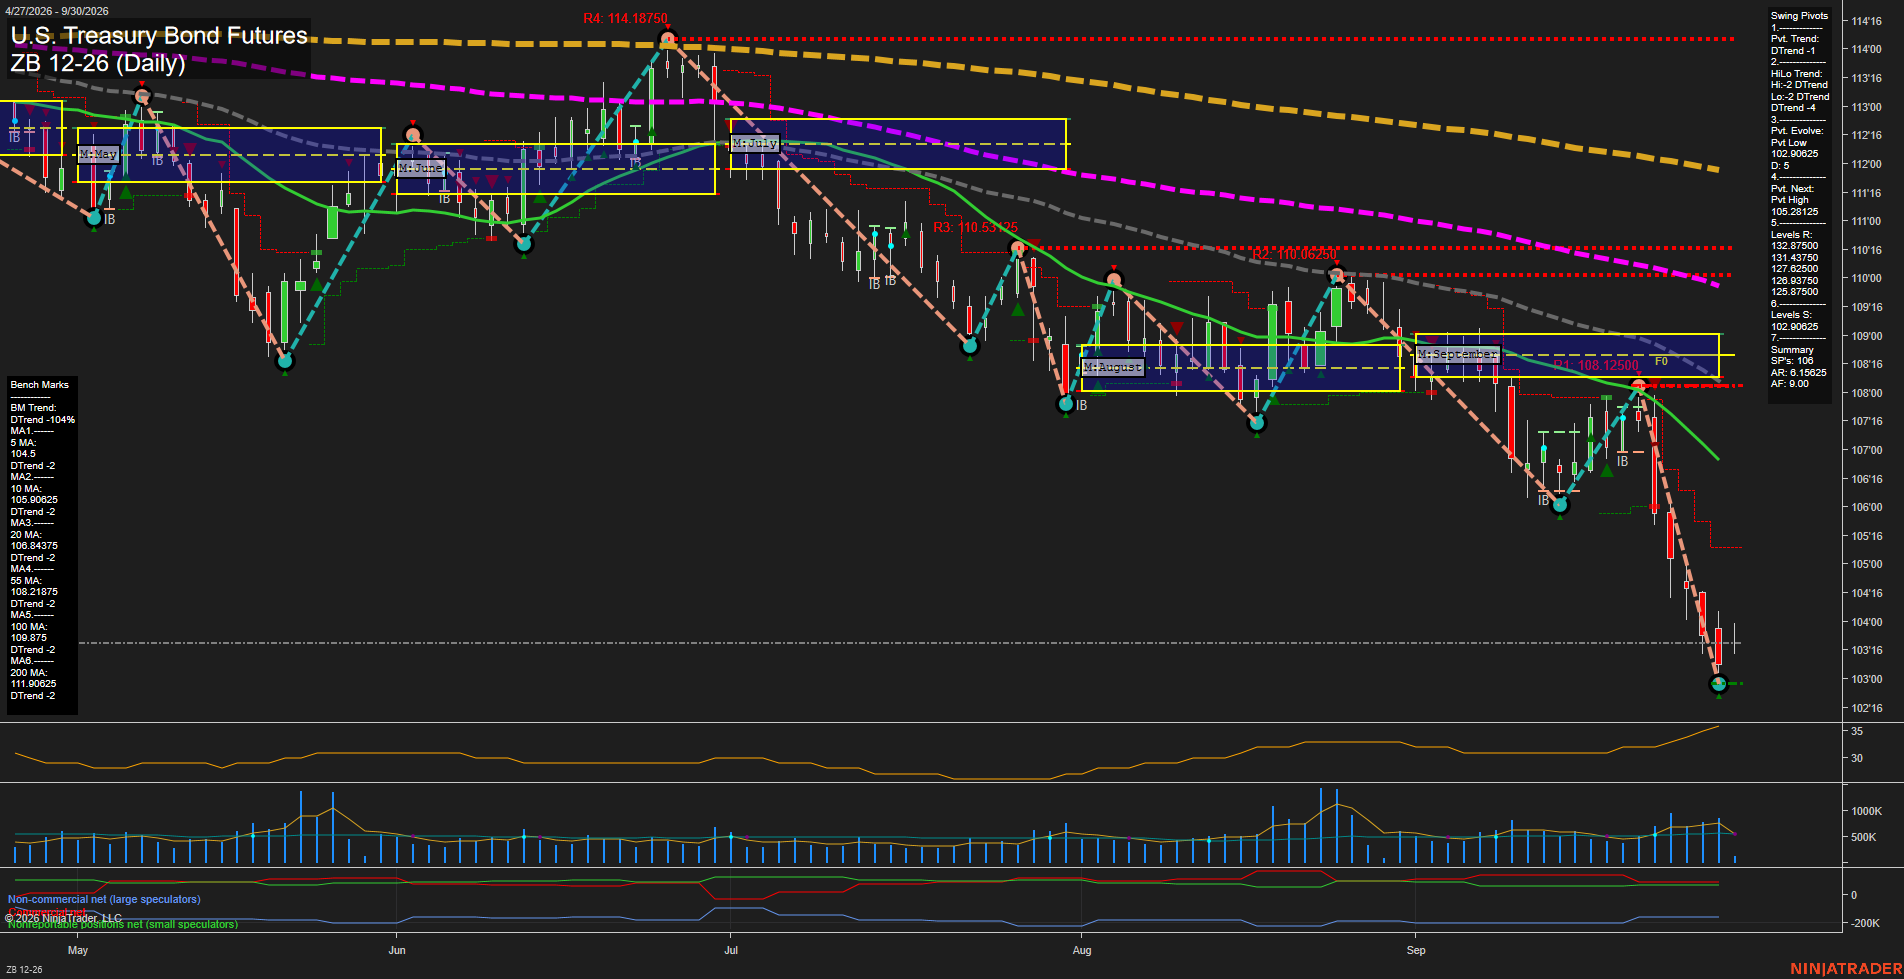
Overall Rating
- Short-Term: Bearish
- Intermediate-Term: Bearish
- Long-Term: Bearish.
Key Insights Summary
ZB is in a broad, synchronized bearish swing structure: price is below the weekly, monthly, and yearly Fib reference zones, the pivot trend and HiLo trend are both down, and all six benchmark averages are declining above price. The recent selloff accelerated through the September MSFG lower area with large-range bars and fast downside momentum, producing a fresh pivot low near 102.90625. The latest small bars near 103'18 reflect a pause following the decline rather than a confirmed reversal, while 105.28125 marks the next pivot-reversal reference. Recent short-, intermediate-, and long-term signal themes remain aligned with the prevailing downtrend.
View charts on: AlphaWebTrader HTF Charts