Nasdaq hits a record after soft payrolls cut rate-hike bets, while rising Treasury yields, bond volatility and weak banks temper risk appetite.
Fundamentals: Soft September hiring and wage data lowered near-term Fed-hike expectations, lifting technology shares and pushing the Nasdaq to a record high. The broader backdrop remained mixed as Treasury yields rebounded, bond volatility stayed elevated and banks lagged. Oil fell after coordinated reserve releases, while gold and silver retreated as yields and the dollar firmed.
Technicals: Tesla, Alphabet and Nvidia led notable ETF-related gains, while Bitcoin, gold and oil funds declined. Futures technical conditions remained mixed at the October 2 close: Nasdaq retained bullish alignment across time frames, while the S&P 500, Dow, Russell 2000 and DAX showed short-term corrective pressure against generally constructive longer-term structures.
After Market Close daily snapshot: market news summary and sentiment, major ETFs, Magnificent 7 analysis, Indices Futures Higher Time Frame Analysis, and E-mini S&P500, Nasdaq 100, NYMEX Crude, Gold Futures Daily Chart analysis.
As of: October 2, 2026 05:00 CT
Market News Summary:
Weak September hiring data lifted rate-sensitive equities, while rising yields and bond-market stress kept broader risk conditions unsettled.
Primary Drivers & Risks:
- Primary Driver: Soft payrolls reduce hike bets
- Primary Risk: Rising yields and bond volatility
Tone:
Risk-on in technology, tempered by fixed-income pressure.
Stock Market / ETFs / Indices:
The Nasdaq reached a record high as weaker payrolls reduced October rate-hike odds, Treasury yields initially retreated, and chip stocks led the advance. The Dow lagged, equal-weight S&P 500 performance marked a seventh weekly loss, and bank stocks posted their weakest monthly relative performance versus the S&P 500 since 1990. Elevated S&P 500 valuations and a divergence between subdued VIX levels and higher MOVE bond volatility remained notable risks.
Oil / Energy:
Oil prices fell after the decision to release 100 million barrels of oil and fuel reserves. G-7 agreement on diesel and crude releases added to the decline.
Gold / Metals:
Gold and silver gave back their payrolls-report gains as Treasury yields rebounded, the dollar remained firm, and oil-market risk persisted. Gold traded near $4,142 late Friday, while reports highlighted bearish pressure below resistance and attention on $4,000 support.
Fed / Financials:
September job growth and wage growth both slowed, prompting traders to reduce near-term Fed-hike expectations and supporting stocks. Yields later climbed, adding to weekly gains, while bond investors’ initial safe-haven response to the labor data faded. French sovereign spreads over German debt widened to their highest level since the euro-area debt crisis, and financial-sector performance remained weak despite strong reported Morgan Stanley results.
Macro / Other:
AI-driven data-center construction continued to support industrial capex and contractor backlogs through 2027, though valuations in several related companies were described as stretched. A pool-supplies retailer filed for Chapter 11 and announced 76 store closures.
Conclusion:
Soft U.S. labor data and reduced rate-hike pricing drove the Nasdaq-led equity rally. Oil declined after coordinated reserve-release decisions.
Higher Treasury yields, elevated bond volatility, and stretched equity valuations remained cross-currents. Weak bank relative performance, French bond stress, and metals weakness underscored uneven market participation.
Market News Sentiment
Market News Articles: 41
- Neutral: 46.34%
- Negative: 29.27%
- Positive: 24.39%
Sentiment Summary: Of 41 market news articles, 46% were neutral, 29% negative, and 24% positive, indicating mixed coverage with a neutral majority.
Conclusion: Indices futures news sentiment is broadly neutral, with negative articles modestly exceeding positive articles.
GLD,Gold Articles: 14
- Negative: 57.14%
- Positive: 28.57%
- Neutral: 14.29%
Sentiment Summary: Gold coverage was predominantly negative at 57%, with 29% positive and 14% neutral across 14 articles.
Conclusion: The gold news tone was net negative, indicating weaker sentiment in this market-related input for indices futures day traders.
USO,Oil Articles: 13
- Negative: 69.23%
- Neutral: 15.38%
- Positive: 15.38%
Sentiment Summary: USO and oil coverage is predominantly negative, with 69% negative, 15% neutral, and 15% positive articles across 13 articles.
Conclusion: The oil news tone is negative, which is a relevant risk-sentiment input for indices futures day traders.
Market Data Snapshot
ETF Snapshot of major stock market ETFs, Mag7, and others as of: October 2, 2026 05:00
Top Movers & Losers
- TSLA 370.59 Bullish 4.65% ▲
- GOOG 340.35 Bullish 1.62% ▲
- NVDA 233.95 Bullish 1.34% ▲
- IBIT 47.73 Bearish -0.48% ▼
- GLD 380.14 Bearish -0.68% ▼
- USO 147.37 Bearish -1.77% ▼
Major Index ETFs: SPY, QQQ, DIA, IWM, IJH
- QQQ 749.58 Bullish 1.02% ▲
- IJH 73.39 Bullish 0.95% ▲
- IWM 281.52 Bullish 0.90% ▲
- SPY 769.64 Bullish 0.74% ▲
- DIA 511.10 Bullish 0.49% ▲
Major Index ETFs were Bullish across the board: QQQ led gains at +1.02%, followed by IJH at +0.95%, IWM at +0.90%, and SPY at +0.74%. DIA was the least positive mover at +0.49%, while remaining Bullish.
Mag 7 Stocks: AAPL, MSFT, GOOG, AMZN, META, NVDA, TSLA
- TSLA 370.59 Bullish 4.65% ▲
- GOOG 340.35 Bullish 1.62% ▲
- NVDA 233.95 Bullish 1.34% ▲
- AMZN 251.52 Bullish 1.33% ▲
- AAPL 333.69 Bullish 1.02% ▲
- MSFT 517.53 Bullish 0.92% ▲
- META 728.08 Bullish 0.30% ▲
Mag7 is Bullish across all names, led by TSLA at +4.65%. GOOG gained +1.62%, while NVDA, AMZN, and AAPL advanced +1.34%, +1.33%, and +1.02%. MSFT added +0.92%. META was the least positive mover at +0.30%.
Cross-Market ETFs: TLT, GLD, USO, IBIT
- TLT 77.48 Bearish -0.30% ▼
- IBIT 47.73 Bearish -0.48% ▼
- GLD 380.14 Bearish -0.68% ▼
- USO 147.37 Bearish -1.77% ▼
Other ETFs were Bearish across the group: USO was the most bearish mover at -1.77%, followed by GLD at -0.68% and IBIT at -0.48%. TLT was the least negative mover at -0.30%.
ETF, Mag7, and Cross-Market ETF Insights
Overall Tone
Bullish equity participation alongside Bearish cross-market ETFs reflects a Mixed tone, with equity strength not confirmed by bonds, gold, oil, or bitcoin.
Equity ETFs and Mag7:
Major Index ETFs were broadly Bullish: QQQ led at +1.02%, followed by IJH at +0.95%, IWM at +0.90%, SPY at +0.74%, and DIA at +0.49%; DIA was the least positive major equity ETF. Mag7 participation was also Bullish, led decisively by TSLA at +4.65%, while META was the least positive at +0.30%; GOOG +1.62%, NVDA +1.34%, AMZN +1.33%, AAPL +1.02%, and MSFT +0.92% supported broad but selective equity leadership.
Cross-Market ETFs:
Cross-market ETFs were broadly Bearish while equities were Bullish, with USO the most bearish mover at -1.77%, followed by GLD at -0.68% and IBIT at -0.48%. TLT was the least negative mover at -0.30%, indicating that bonds, gold, oil, and bitcoin did not align with the equity advance.
Futures Indices – Higher Time Frame Analysis
Summary of the current state of US Indices Futures based on higher time-frame (HTF) technical analysis as of: 2026-10-02: 17:00 CT.
US Indices Futures
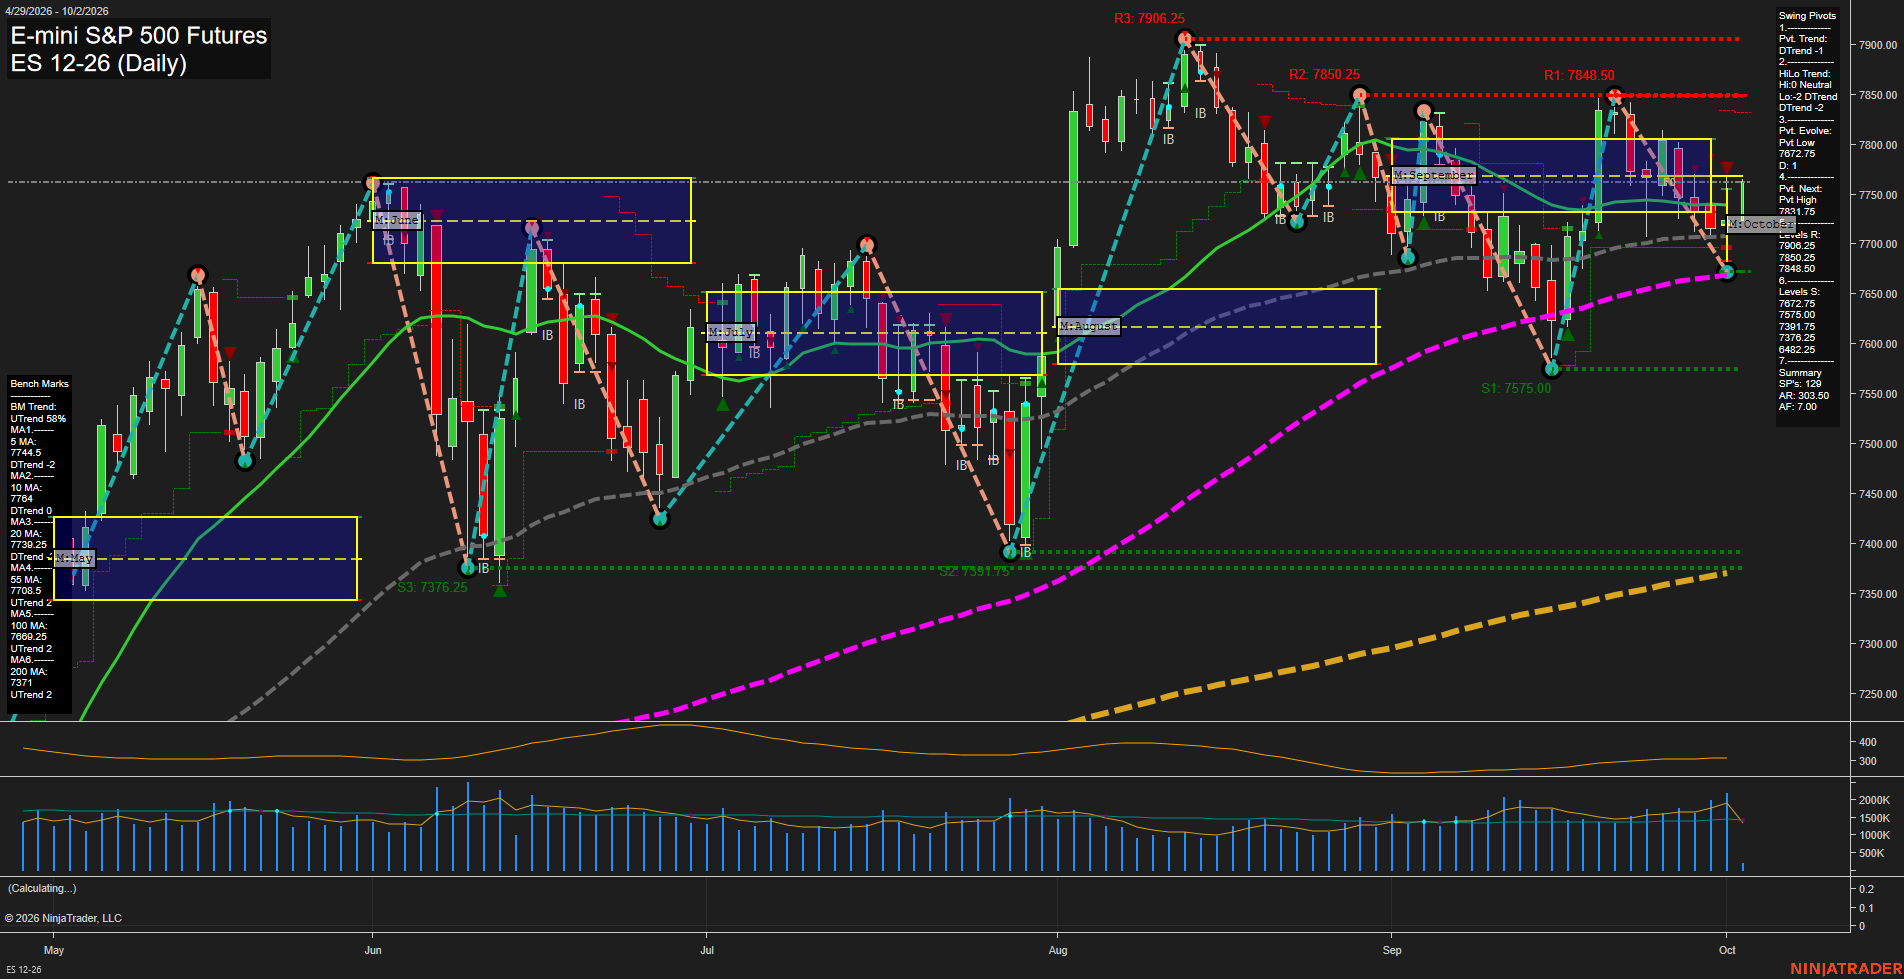
- ES: YSFG/MSFG above F0, WSFG down; above weekly benchmarks; daily DTrend at 7672.75 support; resistance 7848.50-7906.25.
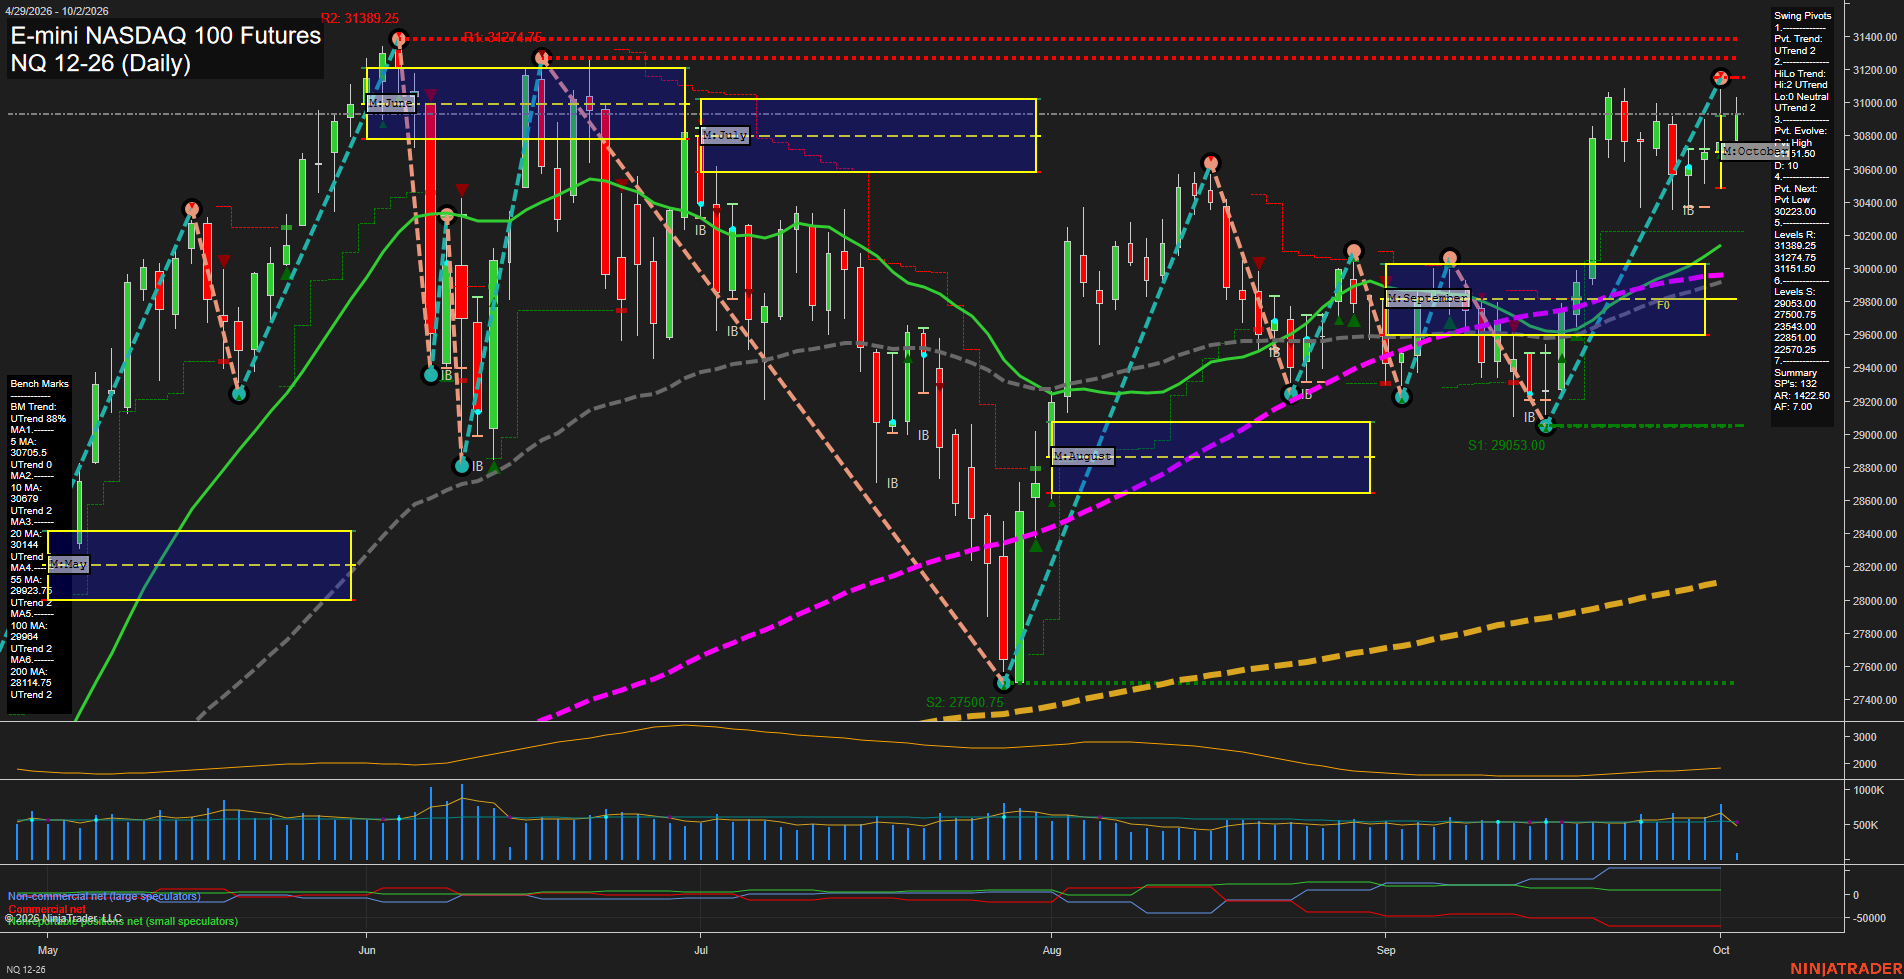
- NQ: YSFG/WSFG above F0, MSFG neutral; above benchmarks, UTrend; testing 31151.50-31389.25 resistance, 29053 support.
- YM: YSFG/MSFG above F0, WSFG below F0; weekly/daily DTrend; 50859-50568 support, 52039-52848 resistance, 55316 pivot high.
- EMD: YSFG/MSFG above F0; weekly DTrend, daily UTrend rebound; 3600.3 support, 3690.3-3797.1 resistance; above long weekly benchmarks.
- RTY: YSFG/MSFG above F0, WSFG below F0; weekly/daily DTrend; 2791.5-2768.4 support, 2872.5-3005.2 resistance.
- FDAX: YSFG/MSFG above F0, WSFG below F0; weekly/daily DTrend; testing 24978 support, 25640-26334 resistance, 22392 lower support.
Overall State
- Short-Term: Bearish
- Intermediate-Term: Neutral
- Long-Term: Bullish
Conclusion
NQ is the strongest directional component, maintaining aligned bullish daily and weekly structure above benchmark averages while testing 31151.50-31389.25 resistance. ES is consolidating within a broader weekly uptrend but carries bearish daily structure. YM, RTY, and FDAX show aligned weekly and daily corrective DTrends below WSFG F0% areas and short-term benchmarks. EMD shows a daily UTrend rebound from 3600.3 within a declining daily intermediate structure. Yearly and monthly grids remain above F0% across the group, preserving broader bullish context; support pivots at YM 50859, RTY 2791.5, FDAX 24978, and EMD 3600.3 define current structural references.
Note: Intra-day counter-trend pullbacks or retracements may occur, HTF is context for informational usage and market structure. Glossary: Session Fib Grids periods of YSFG:’Yearly’, MSFG:’Monthly’, WSFG:’Weekly’
For full details visit: AlphaWebTrader Technicals
ES Daily View
Overall Rating
- Short-Term: Bearish
- Intermediate-Term: Neutral
- Long-Term: Bullish.
Key Insights Summary
The swing structure has shifted lower in the short term, with fast downside momentum, a DTrend pivot condition, and price trading beneath the declining 5-, 10-, and 20-day benchmarks. The latest decline has reached the 7672.75 evolving pivot-low support, while the 7575.00 pivot support is the next lower reference in the current downswing. Intermediate conditions are mixed: October MSFG remains positive and the 55-day average retains an upward trend, but price has slipped below that average and the HiLo structure is weak. Long-term structure remains constructive because the yearly grid is positive and the rising 100- and 200-day averages remain materially below the broader advance. Overhead swing resistance is layered at 7848.50, 7850.25, and 7906.25, defining the recent failed-rally area.
View charts on: AlphaWebTrader HTF Charts
NQ Daily View
Overall Rating
- Short-Term: Bullish
- Intermediate-Term: Bullish
- Long-Term: Bullish.
Key Insights Summary
Price has completed a sharp V-recovery from the August low and is holding above all daily benchmark averages, with the 5, 10, and 20 day averages rising beneath the current swing. The pivot structure remains in UTrend on both short-term and intermediate-term measures, while the latest advance is testing the 31151.50 to 31389.25 resistance band. Weekly and yearly fib-grid structure remain positive, although the October monthly grid is neutral as price consolidates near the upper portion of the recent range. The active swing is characterized by fast upside momentum, higher lows from the 29053 support pivot, and elevated volatility relative to the recent consolidation phase.
View charts on: AlphaWebTrader HTF Charts
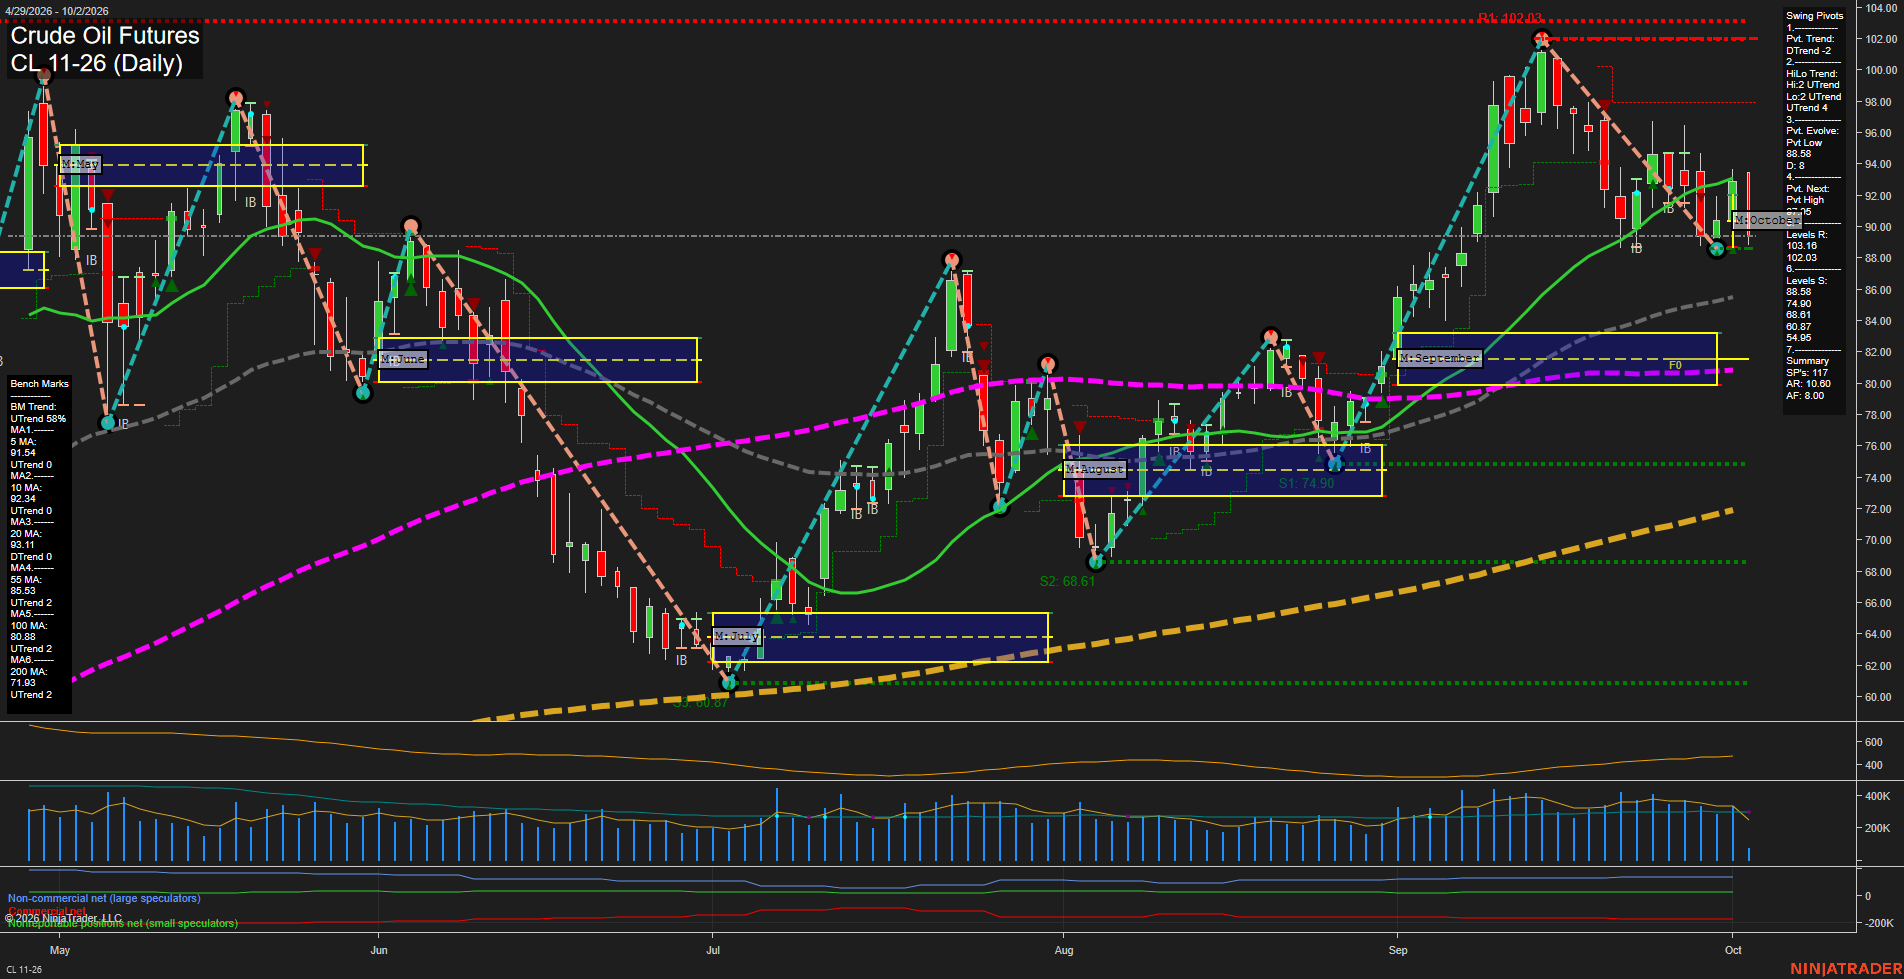
CL Daily View
Overall Rating
- Short-Term: Bearish
- Intermediate-Term: Bullish
- Long-Term: Bullish.
Key Insights Summary
Price is in a short-term corrective downswing from the 102.03 pivot high, marked by lower highs and a break beneath the 5-, 10-, and 20-day benchmarks. The 88.58 pivot low is the immediate structural support, while 91.95 to 93.16 is the nearby rebound-resistance zone. Intermediate and long-term structure remains constructive: price is above the rising 55-, 100-, and 200-day benchmarks, the monthly grid remains positive, and the HiLo pivot trend remains upward. The current pattern reflects a pullback within the broader advance rather than a confirmed long-term trend reversal.
View charts on: AlphaWebTrader HTF Charts
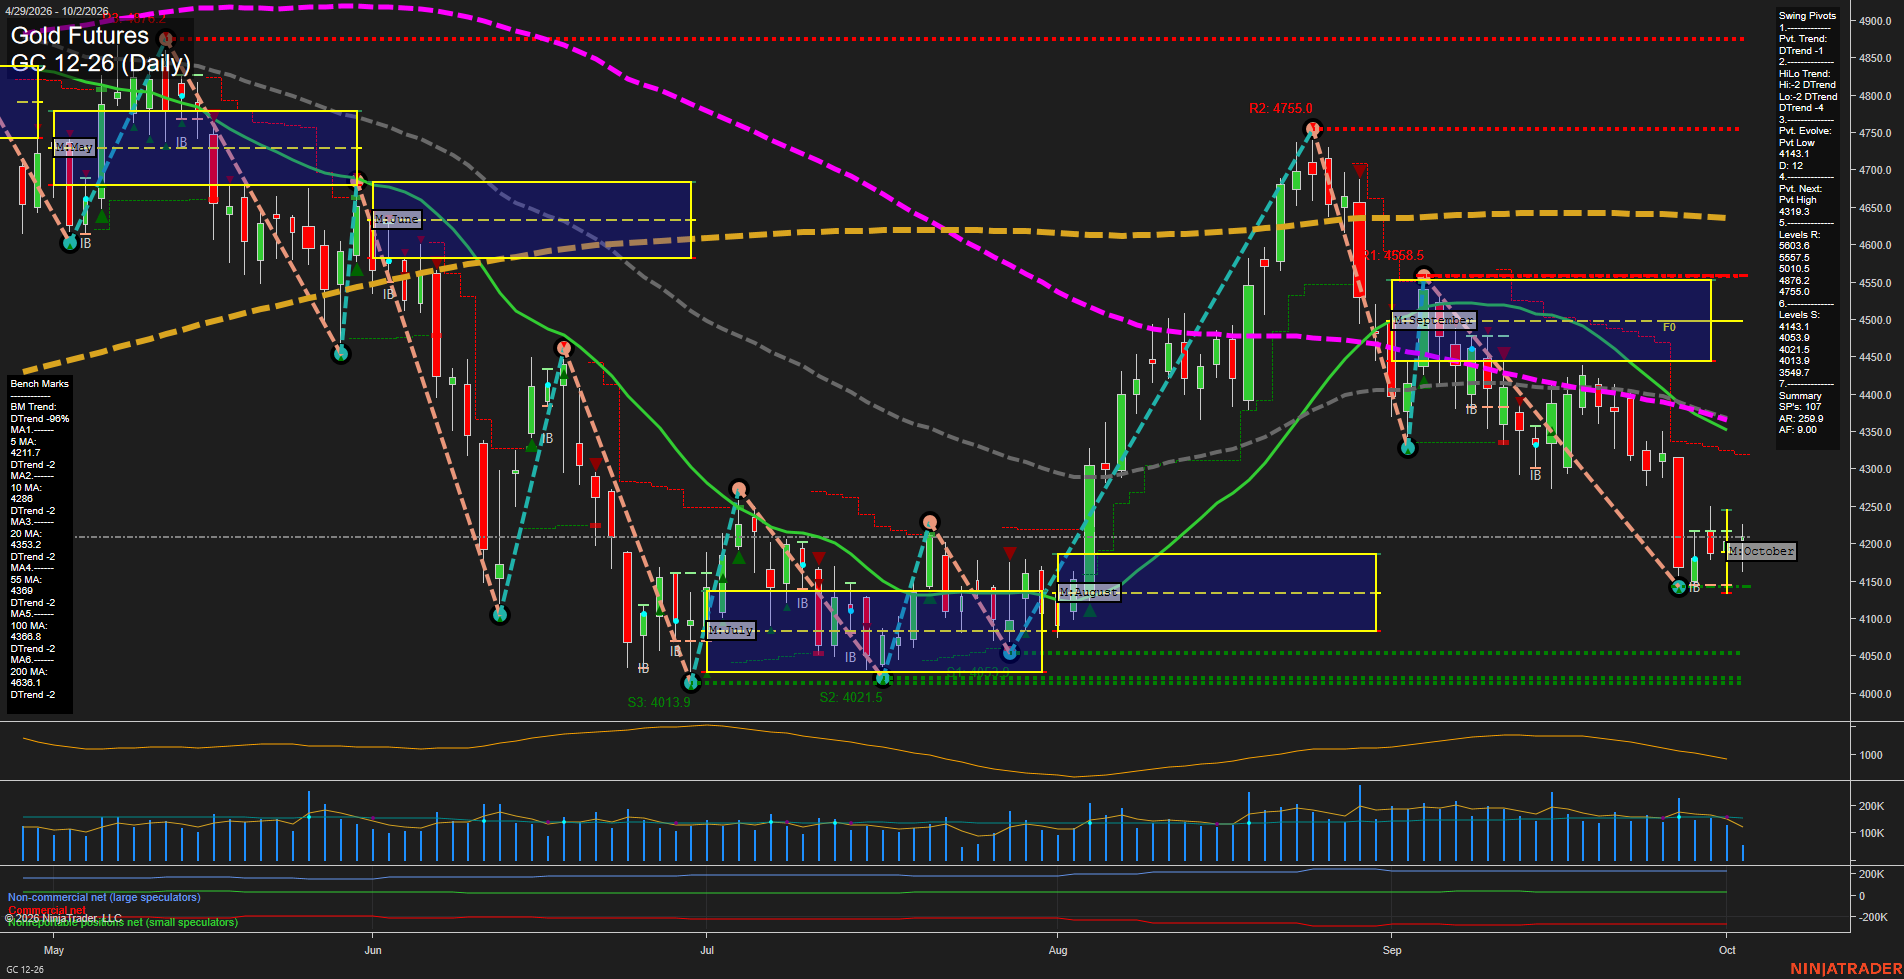
GC Daily View
Overall Rating
- Short-Term: Bearish
- Intermediate-Term: Bearish
- Long-Term: Bearish.
Key Insights Summary
Gold is consolidating just above the 4153.1 pivot low after a sharp September decline, with small daily bars reflecting slower downside momentum. The short-term pivot and HiLo structures remain in DTrend, while price is below every daily benchmark from the 5-day through 200-day average. October MSFG is marginally above its F0% level, creating a counter-trend stabilization theme, but the weekly and yearly Fib-grid readings remain negative. The 4319.3 pivot-high reversal level and clustered 4353-4386 moving-average zone define the nearest overhead trend-recovery area, while 4143.1 and the 4054-4014 support cluster remain the principal downside structure.
View charts on: AlphaWebTrader HTF Charts
ZB Daily View
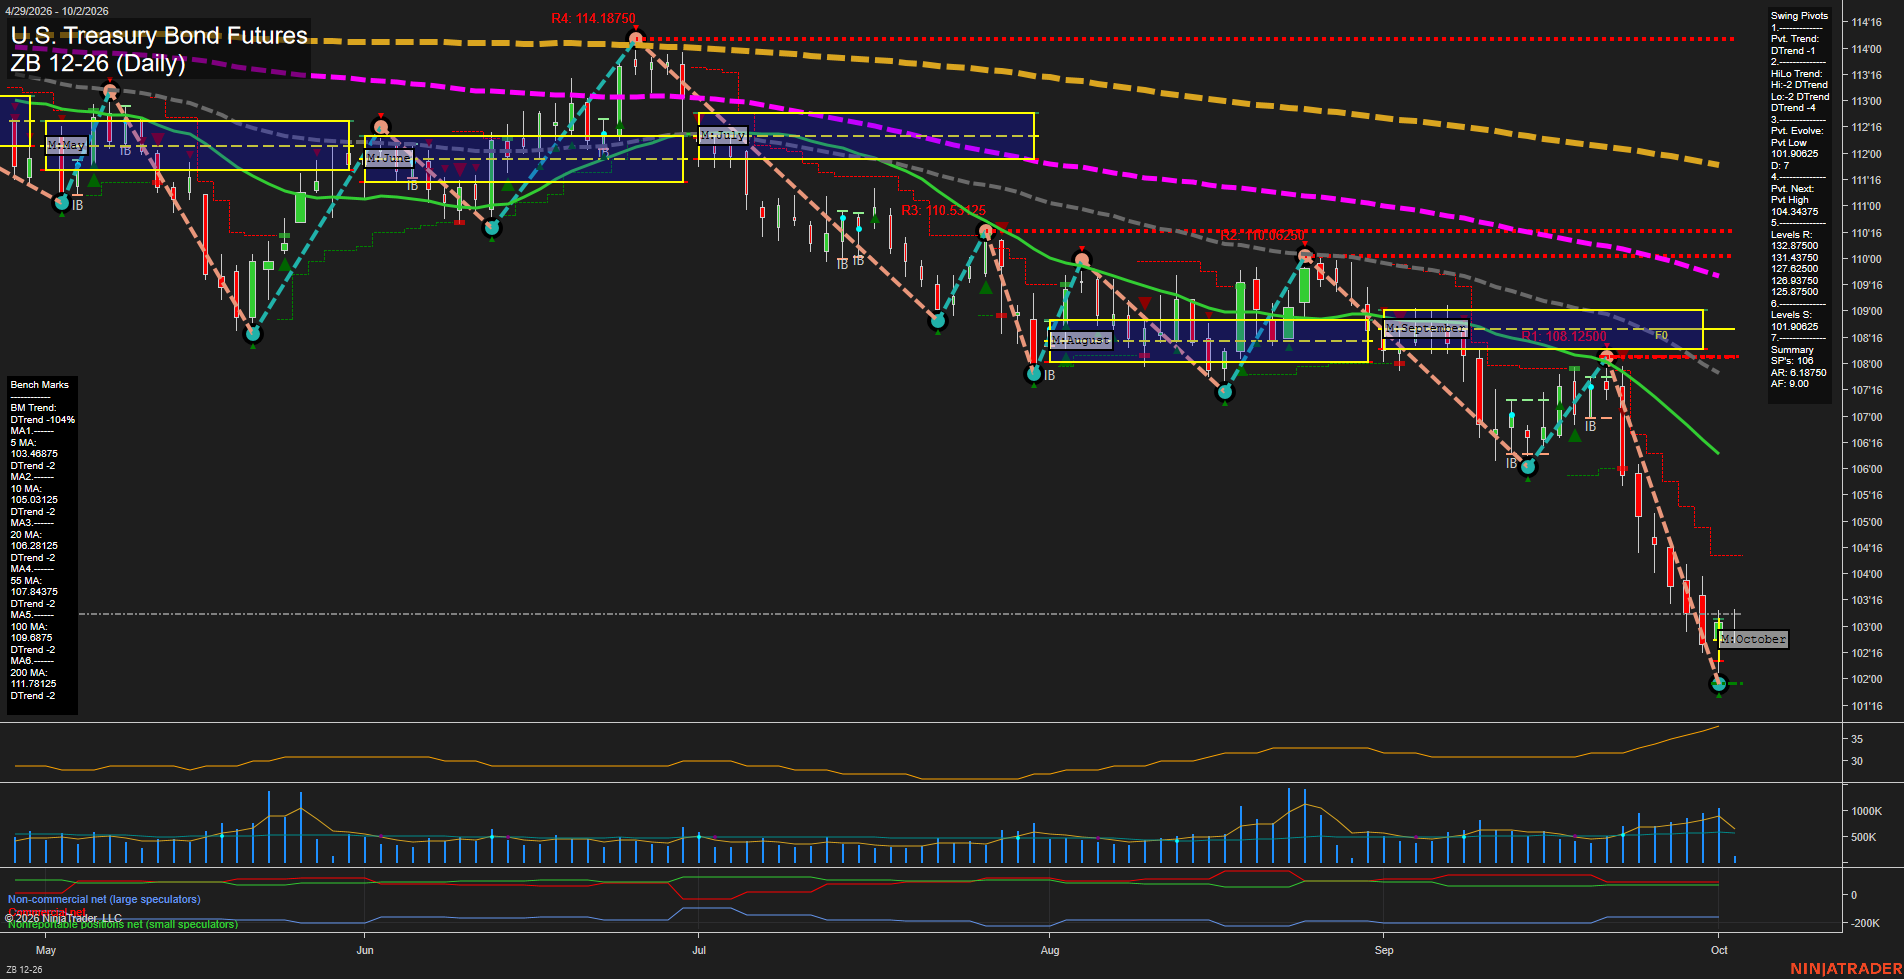
Overall Rating
- Short-Term: Bearish
- Intermediate-Term: Bearish
- Long-Term: Bearish.
Key Insights Summary
The daily structure is decisively bearish: price is below every benchmark average, the pivot and HiLo trends remain in DTrend alignment, and the recent decline has expanded with large bars and elevated volatility. The October monthly grid reflects a local countertrend position above its F0% area, but it has not altered the broader sequence of lower highs and lower lows. The 101.90825 pivot low defines the current downside extreme, while 104.34375 is the first pivot-reversal reference above price. Volume increased into the late-September to early-October selloff, consistent with persistent downside momentum rather than a completed basing pattern.
View charts on: AlphaWebTrader HTF Charts