Pre-market ETF movers and futures trends show NQ strength and corrective pressure elsewhere as jobs data, yields, oil and Middle East risks shape sentiment.
Fundamentals: U.S. index futures advanced ahead of the September employment report, with lower Treasury yields and softer oil supporting risk sentiment. The labor data is the final major release before the Fed’s October meeting. Middle East tensions, Strait of Hormuz disruption concerns, mixed oil-supply signals and broader bond-market stress remained key sources of inflation and volatility risk.
Technicals: Prior-session ETF strength was led by USO, IBIT and NVDA, while GOOG, AAPL and AMZN declined. Futures technical conditions are mixed: NQ retains bullish daily and weekly structures near resistance, while ES, YM, RTY and FDAX remain under short-term corrective pressure. EMD is rebounding from support but remains below key intermediate-term benchmarks.
Pre-Market Trading 360° view Market Radar of: holidays, earnings, eco-news, market-news summary, news sentiment, prior session major ETFs, MAG7, Higher Time Frame Analysis Indices Futures Summary, and E-mini S&P500, Nasdaq 100, NYMEX Crude, Gold Futures Daily Chart analysis.
As of: October 2, 2026 07:16 CT
EcoNews Radar U.S. Events
| Day | Time | Impact | Event |
|---|---|---|---|
| Fri | 08:30 | High | Average Hourly Earnings m/m |
| Fri | 08:30 | High | Non-Farm Employment Change |
| Fri | 08:30 | High | Unemployment Rate |
EcoNews Summary
Friday’s 08:30 USD labor-market releases are the week’s listed high-impact catalysts for index futures. The simultaneous reports cover wage growth, employment change, and the unemployment rate, providing a broad view of labor conditions and inflation-related wage pressure.
Event Notes:
- Friday 08:30 – USD Average Hourly Earnings m/m: Measures the monthly change in average hourly pay. Traders monitor wage growth as an indicator of labor-cost pressure and inflation conditions.
- Friday 08:30 – USD Non-Farm Employment Change: Measures the change in employment outside the farm sector. Traders monitor it for evidence of labor-market strength or weakness.
- Friday 08:30 – USD Unemployment Rate: Measures the percentage of the labor force without work and actively seeking employment. Traders monitor it as a broad gauge of labor-market slack and employment conditions.
Conclusion:
The single most important listed event is Friday’s 08:30 USD Non-Farm Employment Change, released alongside Average Hourly Earnings and the Unemployment Rate. The combined labor data release is a high-impact market event, with price volatility often increasing at release time.
For full details visit: Forex Factory EcoNews
Market News Summary:
U.S. index futures rose before the September jobs report as lower Treasury yields and a pullback in oil offered relief, while Middle East tensions and bond-market stress remained central risks.
Primary Drivers & Risks:
- Primary Driver: Lower yields and softer oil
- Primary Risk: Middle East energy disruption
Tone:
Cautiously constructive, with elevated event and inflation sensitivity.
Stock Market / ETFs / Indices:
Dow futures rose about 0.58%, S&P 500 futures 0.50%, and Nasdaq 100 futures roughly 0.72% ahead of the U.S. open. Technology remained a key prior source of market strength, while Japanese equities fell 1.0% as technology and auto shares weakened on energy-cost concerns. Twilio joins the S&P 500 before the Oct. 6 open, replacing Warner Bros. Discovery.
Geopolitical:
Reports of additional U.S. troops and aircraft carriers heading to the Middle East, widening U.S. sanctions on Iran, and continuing disruption around the Strait of Hormuz kept geopolitical risk elevated. U.S.-India trade negotiations remain active, though no near-term agreement was indicated.
Oil / Energy:
Oil trading reflected conflicting supply signals. China halted fuel exports and Middle East tensions raised disruption concerns, with Brent reported above $100, while discussion of a European diesel-reserve release pressured prices later. OPEC+ delayed a capacity review amid the Iran war, increasing uncertainty around future production capacity.
Gold / Metals:
Gold and silver faced pressure from a stronger U.S. dollar and elevated Treasury yields ahead of the jobs report. Copper-gold producer Bezant began commercial production at its Namibia project.
Fed / Financials:
The September nonfarm payrolls report is the final major labor-market release before the Fed’s October meeting. Treasury yields eased before the open, but broader bond-market stress remained a concern after a deepening selloff linked to high fuel costs. Kashkari stated that inflation is not AI-driven.
Macro / Other:
China’s September auto-sales growth disappointed, signaling softer demand in the world’s largest auto market. The Swiss franc strengthened as the dollar eased and safe-haven demand increased.
Conclusion:
Early gains in U.S. futures were tied to easing Treasury yields and a pullback in oil ahead of the September jobs report. The labor reading remains the main scheduled macro focus before the Fed’s October meeting.
Energy supply concerns tied to Middle East developments remain an inflation and market-volatility cross-current. Oil signals are mixed due to Chinese fuel-export restrictions, OPEC+ capacity uncertainty, and potential European diesel-reserve releases.
Market News Sentiment
Market News Articles: 33
- Neutral: 42.42%
- Negative: 33.33%
- Positive: 24.24%
Sentiment Summary: Of 33 market news articles, 42% were neutral, 33% negative, and 24% positive, indicating mixed coverage with a negative tilt among directional items.
Conclusion: Indices futures traders faced predominantly neutral news flow, while negative articles outnumbered positive articles.
GLD,Gold Articles: 15
- Neutral: 46.67%
- Positive: 33.33%
- Negative: 20.00%
Sentiment Summary: Gold-related coverage is neutral overall, with 47% neutral, 33% positive, and 20% negative sentiment across 15 articles.
Conclusion: The news tone indicates mixed but predominantly neutral gold sentiment, with positive coverage exceeding negative coverage.
USO,Oil Articles: 11
- Neutral: 36.36%
- Positive: 36.36%
- Negative: 27.27%
Sentiment Summary: USO/Oil coverage is balanced, with 36% positive, 36% neutral, and 27% negative articles.
Conclusion: Oil-related news flow presents a mixed tone for indices futures day traders, with positive and neutral coverage jointly outweighing negative coverage.
Market Data Snapshot
ETF Snapshot of major stock market ETFs, Mag7, and others as of: October 2, 2026 07:16
Top Movers & Losers
- USO 150.02 Bullish 2.99% ▲
- IBIT 47.96 Bullish 1.31% ▲
- NVDA 230.86 Bullish 1.09% ▲
- AMZN 248.23 Bearish -0.37% ▼
- AAPL 330.32 Bearish -0.81% ▼
- GOOG 334.93 Bearish -1.71% ▼
Major Index ETFs: SPY, QQQ, DIA, IWM, IJH
- IJH 72.70 Bullish 1.04% ▲
- IWM 279.02 Bullish 0.41% ▲
- QQQ 742.03 Bullish 0.31% ▲
- SPY 763.99 Bullish 0.18% ▲
- DIA 508.62 Bullish 0.01% ▲
Major Index ETFs are Bullish across the group. IJH is the most bullish mover at +1.04%, followed by IWM at +0.41%, QQQ at +0.31%, and SPY at +0.18%. DIA is the least positive mover at a marginal +0.01%.
Mag 7 Stocks: AAPL, MSFT, GOOG, AMZN, META, NVDA, TSLA
- NVDA 230.86 Bullish 1.09% ▲
- META 725.93 Bullish 0.10% ▲
- MSFT 512.80 Bearish -0.02% ▼
- TSLA 354.11 Bearish -0.20% ▼
- AMZN 248.23 Bearish -0.37% ▼
- AAPL 330.32 Bearish -0.81% ▼
- GOOG 334.93 Bearish -1.71% ▼
Mag7 is Mixed: NVDA is the most bullish mover at +1.09%, while GOOG is the most bearish mover at -1.71%. META is marginally Bullish at +0.10%; MSFT is near-flat Bearish at -0.02%. TSLA, AMZN, and AAPL are Bearish at -0.20%, -0.37%, and -0.81%, respectively.
Cross-Market ETFs: TLT, GLD, USO, IBIT
- USO 150.02 Bullish 2.99% ▲
- IBIT 47.96 Bullish 1.31% ▲
- GLD 382.76 Bullish 0.50% ▲
- TLT 77.71 Bearish -0.09% ▼
Other ETFs are Mixed: USO is the most bullish mover at +2.99%, followed by IBIT at +1.31% and GLD at +0.50%. TLT is the most bearish mover, though marginally lower at -0.09%.
ETF, Mag7, and Cross-Market ETF Insights
Overall Tone
Mixed conditions: equity ETFs were broadly Bullish while Mag7 participation was selective, alongside strong Bullish energy and digital-asset moves.
Equity ETFs and Mag7:
Major Index ETFs were broadly Bullish, led by IJH at +1.04%, followed by IWM at +0.41%, QQQ at +0.31%, SPY at +0.18%, and marginal DIA at +0.01%. Mag7 action was selective: NVDA led gains at +1.09%, while GOOG was the most bearish mover at -1.71%; AAPL declined -0.81% and AMZN fell -0.37%. META was marginally Bullish at +0.10%, while MSFT was near-flat Bearish at -0.02% and TSLA declined -0.20%.
Cross-Market ETFs:
Cross-market ETFs were mostly Bullish, with USO the most bullish mover at +2.99%, followed by IBIT at +1.31% and GLD at +0.50%. TLT was the most bearish mover at -0.09%, a marginal decline, while commodity and digital-asset strength diverged from the near-flat bond ETF.
Futures Indices – Higher Time Frame Analysis
Summary of the current state of US Indices Futures based on higher time-frame (HTF) technical analysis as of: 2026-10-02: 07:16 CT.
US Indices Futures
- ES: YSFG/MSFG bullish, WSFG down; above weekly benchmarks, daily DTrend; support 7672.75/7575.00, resistance 7848.50-7906.25.
- NQ: YSFG/WSFG bullish, MSFG neutral; UTrend above benchmarks; resistance 31151.50-31389.25, pivot support 29053.
- YM: YSFG/MSFG bullish, WSFG below F0%; daily/weekly DTrend; support 50859/50568, resistance 52039-53253.
- EMD: YSFG/MSFG bullish, weekly DTrend and daily UTrend; support 3600.3, resistance 3690.3/3797.1/3825.3.
- RTY: YSFG/MSFG bullish, WSFG below F0%; daily/weekly DTrend; support 2791.5-2768.4, resistance 2872.5/2956.3/3005.2.
- FDAX: YSFG/MSFG bullish, WSFG below F0%; daily/weekly DTrend; support 24978/22392, resistance 25640/26334.
Overall State
- Short-Term: Bearish
- Intermediate-Term: Bullish
- Long-Term: Bullish
Conclusion
NQ remains the aligned HTF leader, with bullish YSFG, WSFG, pivot structure, and benchmark positioning. ES is consolidating after its advance. YM, RTY, and FDAX show correlated short-term corrective structures beneath weekly F0% and short-term benchmarks, while EMD is in a daily rebound within a broader decline. Monthly and yearly grids retain bullish longer-cycle context across the group; nearby pivot supports define current pullback boundaries and overhead pivots define recovery structure.
Note: Intra-day counter-trend pullbacks or retracements may occur, HTF is context for informational usage and market structure. Glossary: Session Fib Grids periods of YSFG:’Yearly’, MSFG:’Monthly’, WSFG:’Weekly’
For full details visit: AlphaWebTrader Technicals
ES Daily View
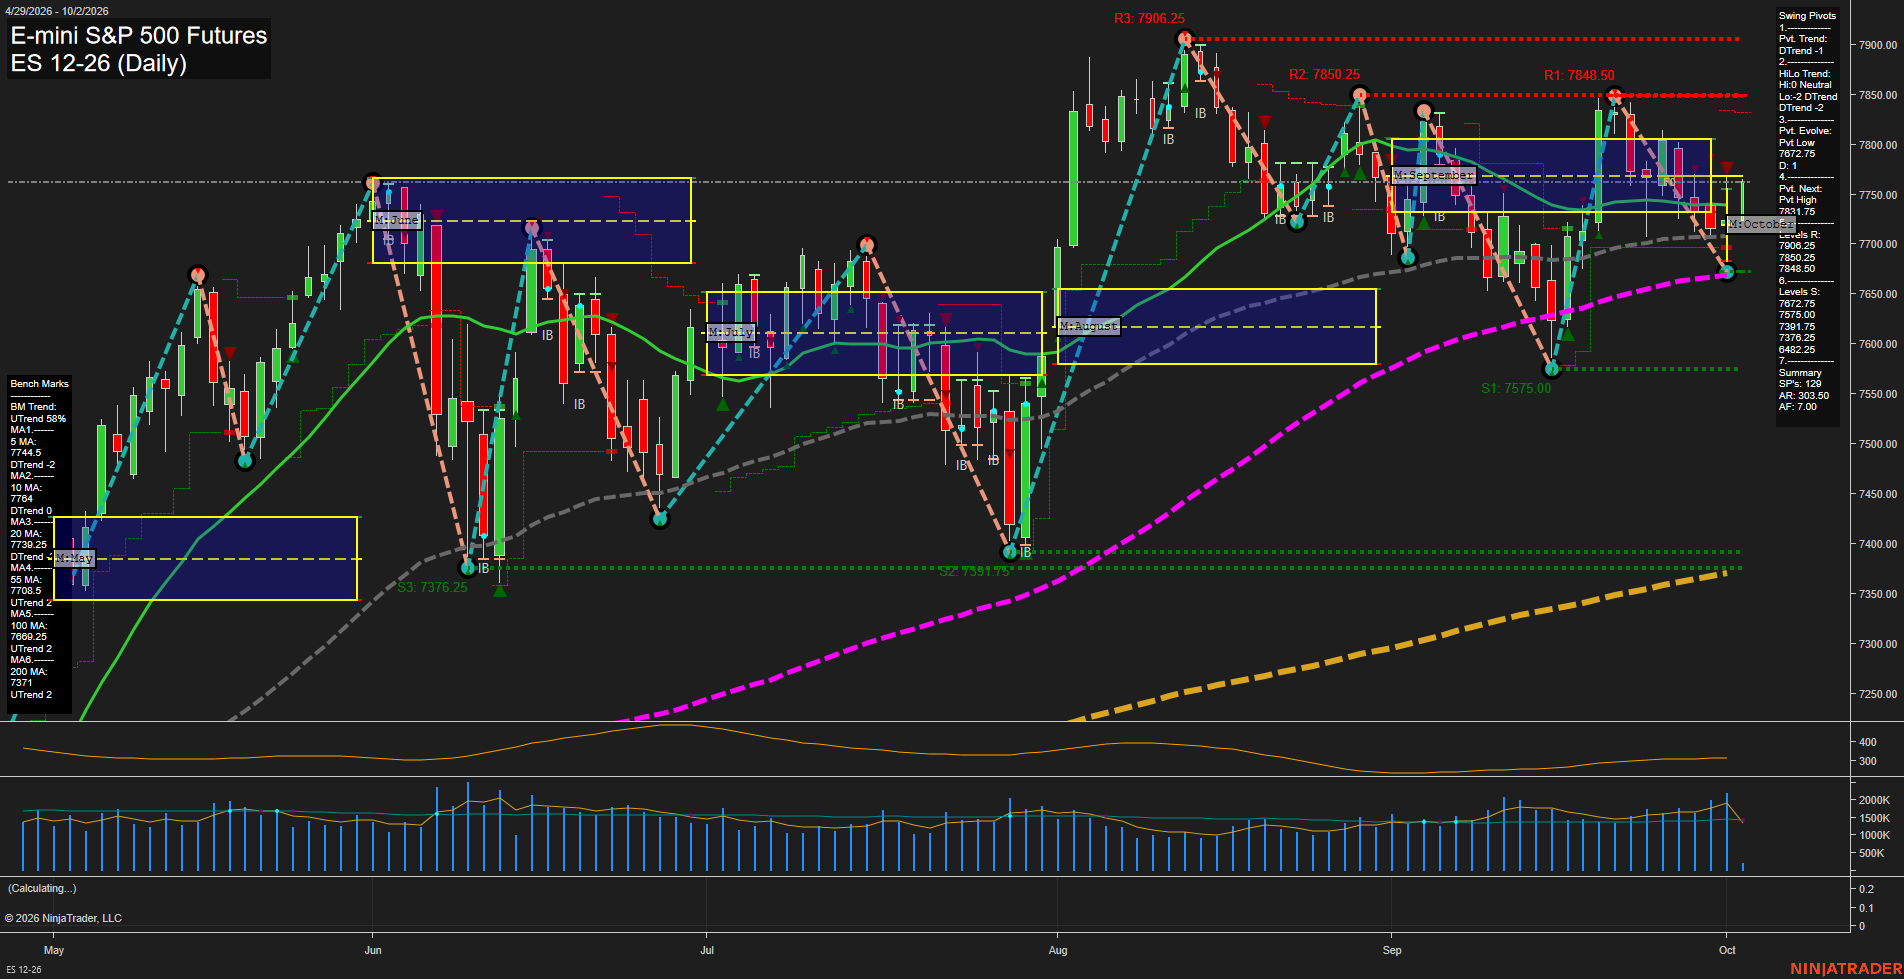
Overall Rating
- Short-Term: Bearish
- Intermediate-Term: Neutral
- Long-Term: Bullish.
Key Insights Summary
The swing structure has shifted lower in the short term, with fast downside momentum, a DTrend pivot condition, and price trading beneath the declining 5-, 10-, and 20-day benchmarks. The latest decline has reached the 7672.75 evolving pivot-low support, while the 7575.00 pivot support is the next lower reference in the current downswing. Intermediate conditions are mixed: October MSFG remains positive and the 55-day average retains an upward trend, but price has slipped below that average and the HiLo structure is weak. Long-term structure remains constructive because the yearly grid is positive and the rising 100- and 200-day averages remain materially below the broader advance. Overhead swing resistance is layered at 7848.50, 7850.25, and 7906.25, defining the recent failed-rally area.
View charts on: AlphaWebTrader HTF Charts
NQ Daily View
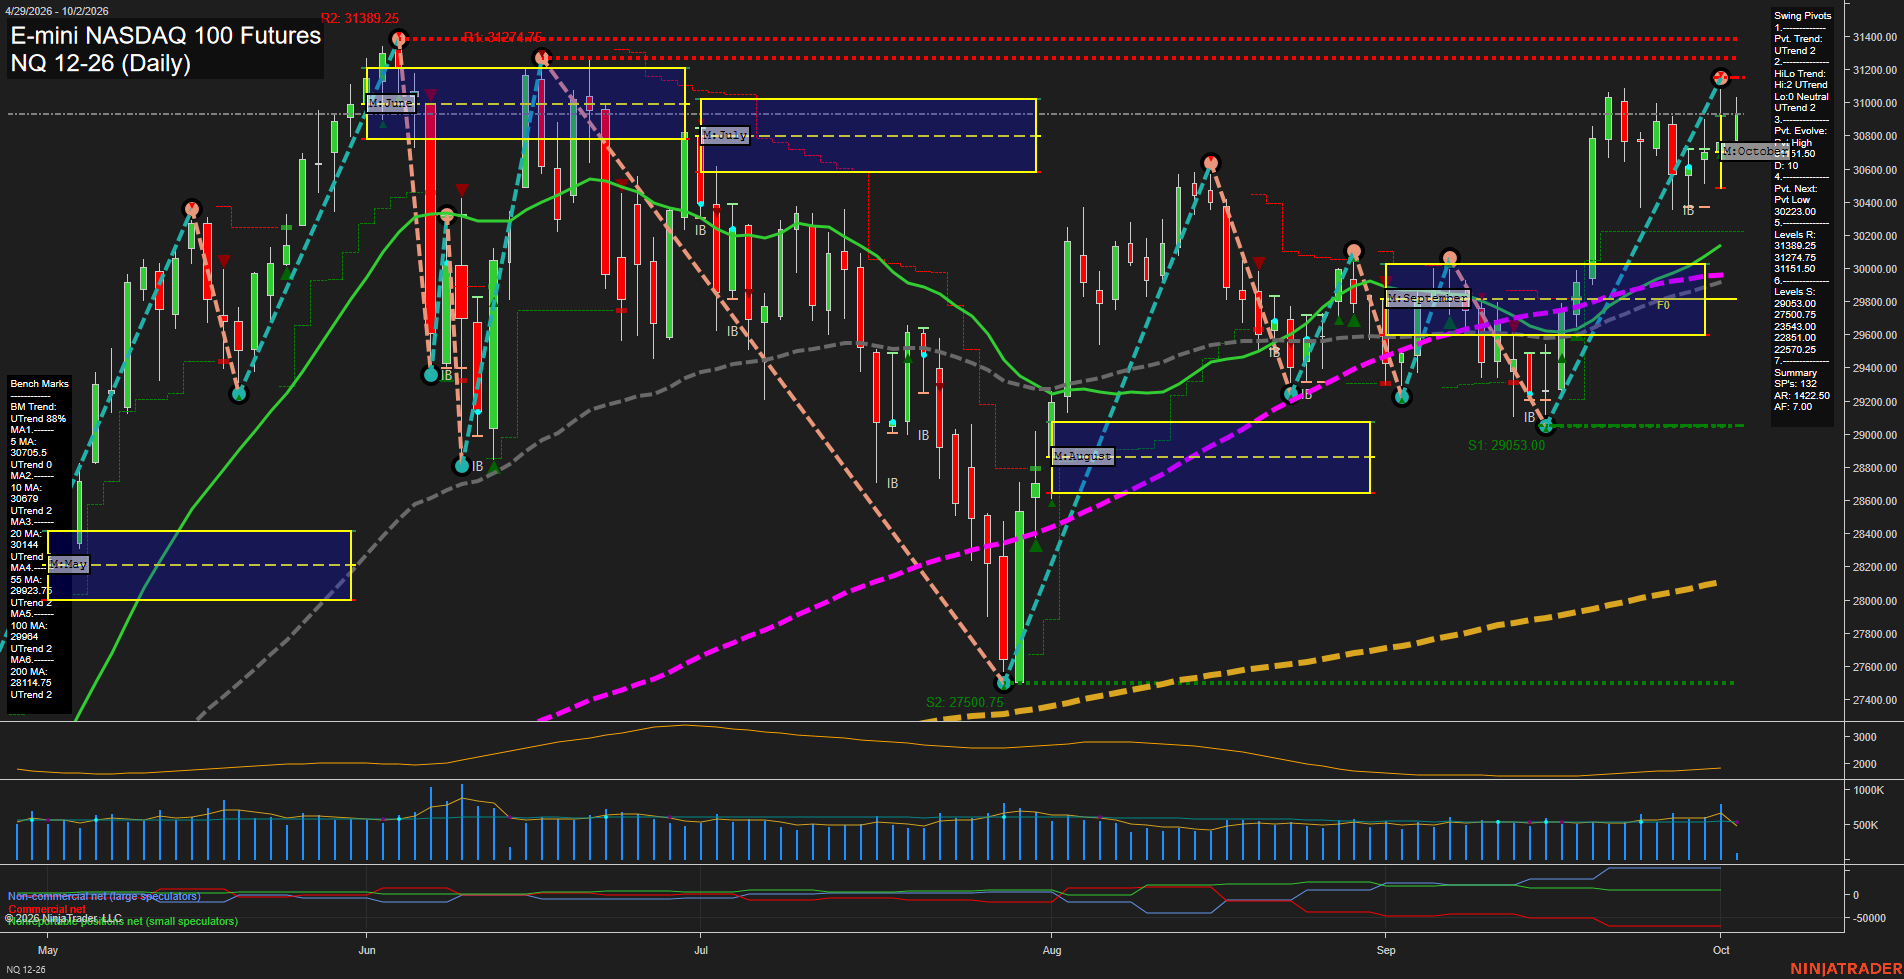
Overall Rating
- Short-Term: Bullish
- Intermediate-Term: Bullish
- Long-Term: Bullish.
Key Insights Summary
Price has completed a sharp V-recovery from the August low and is holding above all daily benchmark averages, with the 5, 10, and 20 day averages rising beneath the current swing. The pivot structure remains in UTrend on both short-term and intermediate-term measures, while the latest advance is testing the 31151.50 to 31389.25 resistance band. Weekly and yearly fib-grid structure remain positive, although the October monthly grid is neutral as price consolidates near the upper portion of the recent range. The active swing is characterized by fast upside momentum, higher lows from the 29053 support pivot, and elevated volatility relative to the recent consolidation phase.
View charts on: AlphaWebTrader HTF Charts
CL Daily View
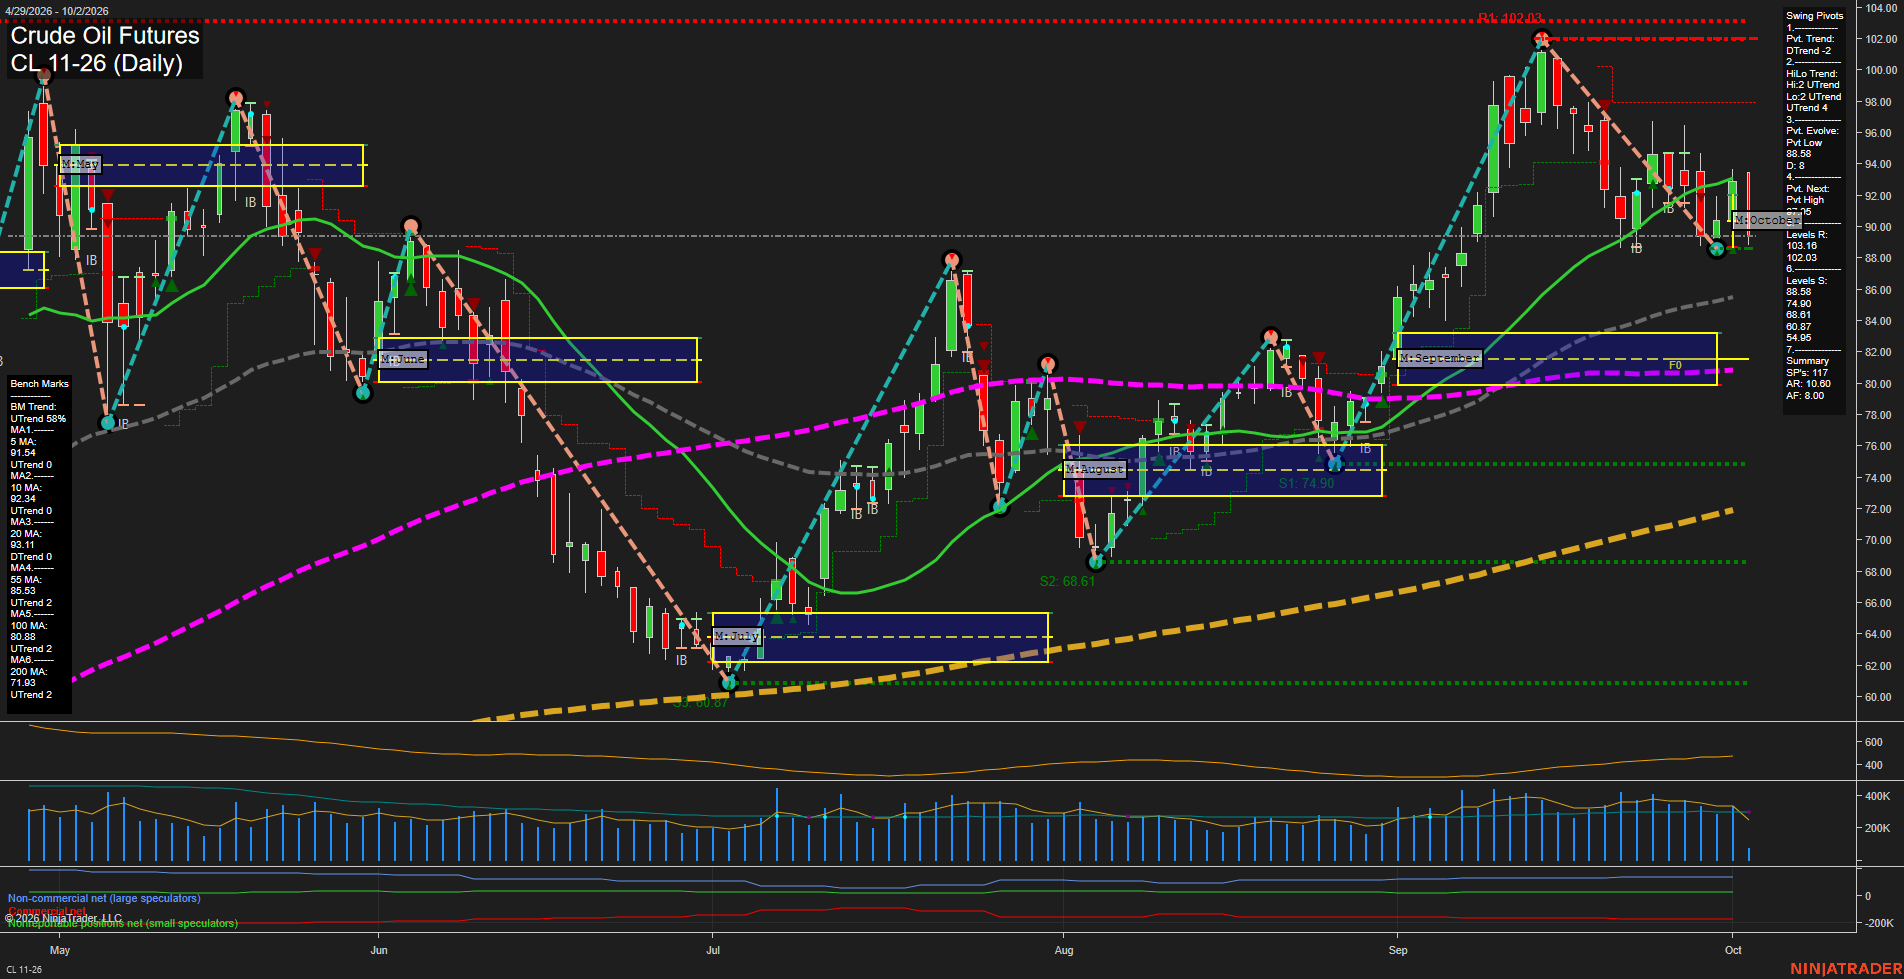
Overall Rating
- Short-Term: Bearish
- Intermediate-Term: Bullish
- Long-Term: Bullish.
Key Insights Summary
Price is in a short-term corrective downswing from the 102.03 pivot high, marked by lower highs and a break beneath the 5-, 10-, and 20-day benchmarks. The 88.58 pivot low is the immediate structural support, while 91.95 to 93.16 is the nearby rebound-resistance zone. Intermediate and long-term structure remains constructive: price is above the rising 55-, 100-, and 200-day benchmarks, the monthly grid remains positive, and the HiLo pivot trend remains upward. The current pattern reflects a pullback within the broader advance rather than a confirmed long-term trend reversal.
View charts on: AlphaWebTrader HTF Charts
GC Daily View
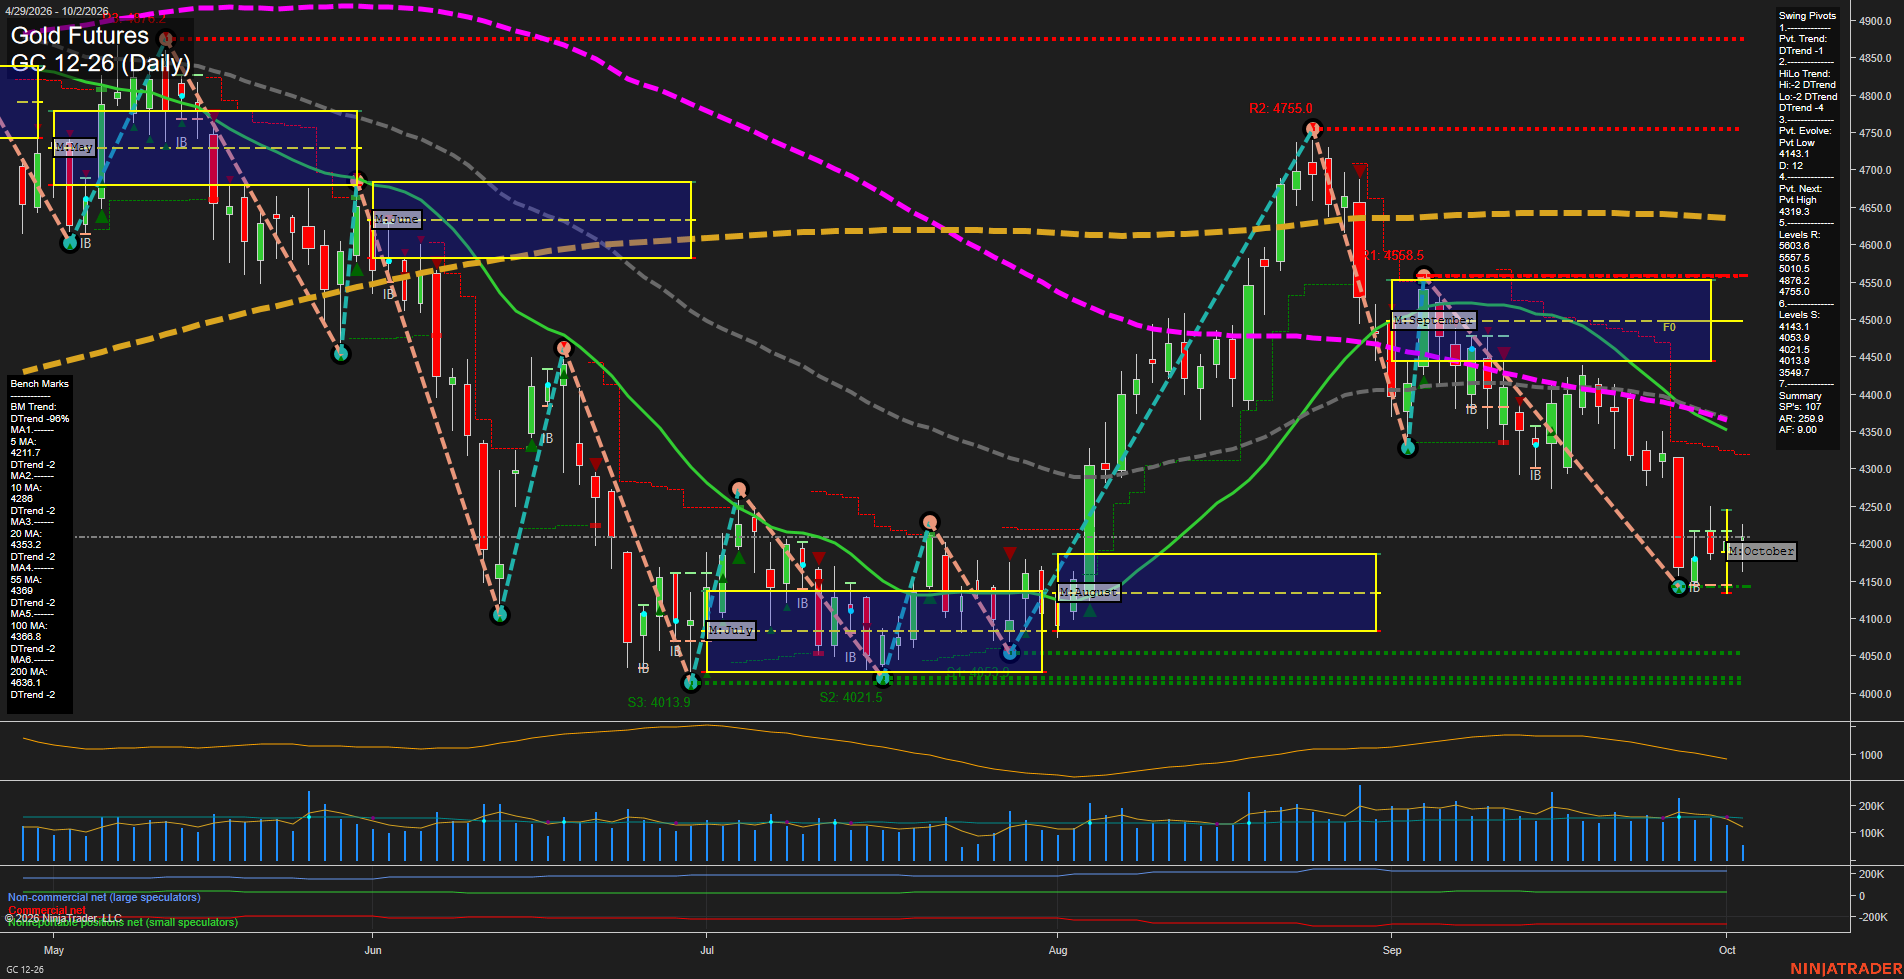
Overall Rating
- Short-Term: Bearish
- Intermediate-Term: Bearish
- Long-Term: Bearish.
Key Insights Summary
Gold is consolidating just above the 4153.1 pivot low after a sharp September decline, with small daily bars reflecting slower downside momentum. The short-term pivot and HiLo structures remain in DTrend, while price is below every daily benchmark from the 5-day through 200-day average. October MSFG is marginally above its F0% level, creating a counter-trend stabilization theme, but the weekly and yearly Fib-grid readings remain negative. The 4319.3 pivot-high reversal level and clustered 4353-4386 moving-average zone define the nearest overhead trend-recovery area, while 4143.1 and the 4054-4014 support cluster remain the principal downside structure.
View charts on: AlphaWebTrader HTF Charts
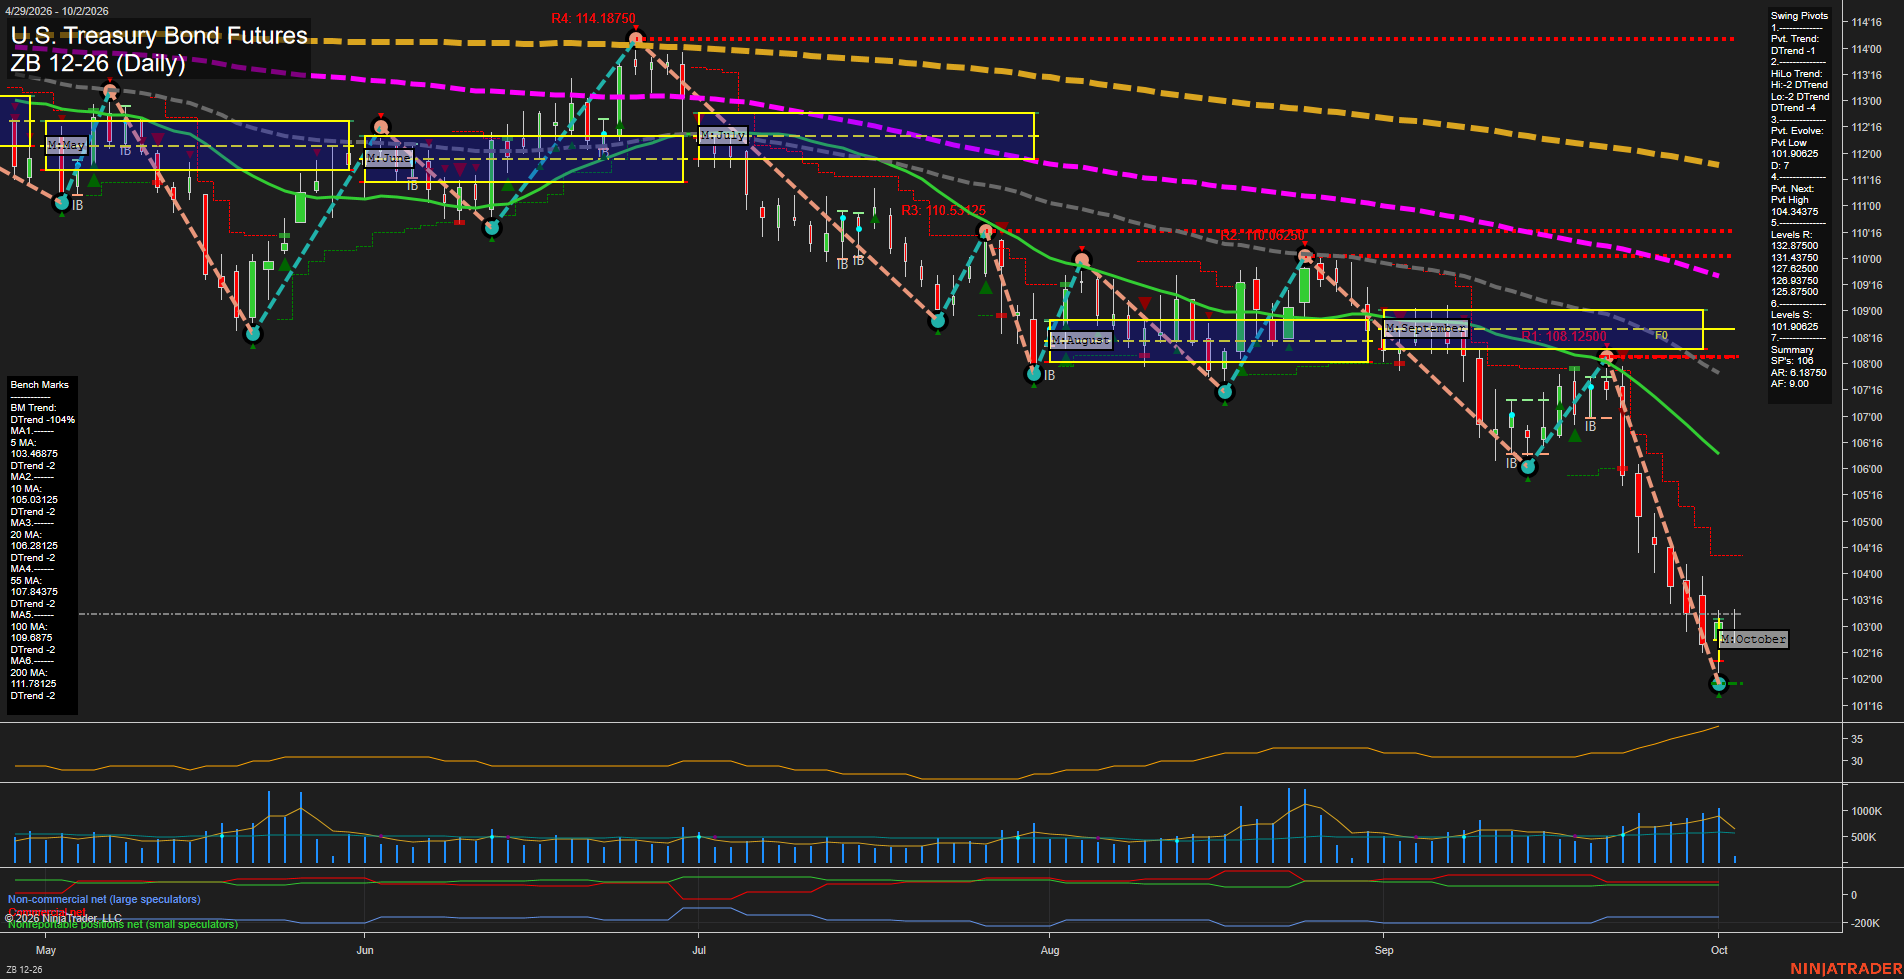
ZB Daily View
Overall Rating
- Short-Term: Bearish
- Intermediate-Term: Bearish
- Long-Term: Bearish.
Key Insights Summary
The daily structure is decisively bearish: price is below every benchmark average, the pivot and HiLo trends remain in DTrend alignment, and the recent decline has expanded with large bars and elevated volatility. The October monthly grid reflects a local countertrend position above its F0% area, but it has not altered the broader sequence of lower highs and lower lows. The 101.90825 pivot low defines the current downside extreme, while 104.34375 is the first pivot-reversal reference above price. Volume increased into the late-September to early-October selloff, consistent with persistent downside momentum rather than a completed basing pattern.
View charts on: AlphaWebTrader HTF Charts