Nasdaq hit a record as technology shares lifted indexes, while rising global yields, high energy prices and weak S&P 500 breadth tempered sentiment.
Fundamentals: U.S. equities closed higher, led by a record Nasdaq and continued strength in megacap technology, software deal activity and bullish S&P 500 flows. The advance masked narrow participation, with more than half of S&P 500 companies below their 200-day averages. Rising global bond yields, Brent crude near $100 and a firm dollar remained key pressures, while lower October rate-hike pricing offered some support.
Technicals: Tesla, Nvidia and Meta led top movers, while Apple, TLT and USO declined. ES and NQ retained bullish intermediate- and long-term readings while consolidating below nearby resistance. YM showed the clearest daily weakness, while EMD, RTY and FDAX displayed varied short-term rebounds or corrections within mixed broader technical structures.
After Market Close daily snapshot: market news summary and sentiment, major ETFs, Magnificent 7 analysis, Indices Futures Higher Time Frame Analysis, and E-mini S&P500, Nasdaq 100, NYMEX Crude, Gold Futures Daily Chart analysis.
As of: October 5, 2026 05:00 CT
Market News Summary:
Equity indexes advanced despite a broad bond-market selloff, elevated energy prices, and narrow market breadth.
Primary Drivers & Risks:
- Primary Driver: Record Nasdaq amid technology strength
- Primary Risk: Rising global yields and weak breadth
Tone:
Mixed: index strength contrasts with significant rate and breadth pressure.
Stock Market / ETFs / Indices:
The Nasdaq reached a record high, supported by software deal activity, upgrades, megacap technology strength, and bullish SPX flows. The Dow lagged, while more than half of S&P 500 constituents were reported below their 200-day moving averages, underscoring weak participation beneath elevated index levels.
Oil / Energy:
Brent crude approached $100 and diesel prices remained elevated. Global fuel inventories were described as thin and shrinking, with estimates that replenishment could take up to two years; the administration prepared an order expanding access to tax-exempt diesel fuel.
Gold / Metals:
Gold faced pressure from high bond yields, a stronger dollar, and elevated oil prices, after breaking technical support. Spot gold held near $4,138 late in U.S. trading as reduced October rate-hike pricing supported metals, while silver and platinum gained despite dollar strength.
Fed / Financials:
Global bond yields rose as French fiscal concerns pushed its 10-year yield toward 5%, affecting Japanese, European, and U.S. markets. The U.S. 10-year Treasury yield touched a fresh two-decade high, while 30-year municipal yields exceeded 5%; FedWatch indicated unchanged rates, with October hike odds below 20% and December pricing still reflecting a hike.
Macro / Other:
ISM services and composite PMI readings broadly matched estimates while confirming rising prices. Core PCE and employment data contributed to reduced near-term Federal Reserve tightening expectations, although inflation scrutiny remained high.
Conclusion:
Record Nasdaq performance and technology leadership supported equity indexes. In-line services data and lower October rate-hike pricing also provided support.
Rising global yields, France’s fiscal concerns, and costly energy remained key cross-currents. Narrow breadth, elevated long-term borrowing costs, and dollar strength constrained broader risk appetite and metals.
Market News Sentiment
Market News Articles: 33
- Neutral: 54.55%
- Positive: 33.33%
- Negative: 12.12%
Sentiment Summary: Of 33 market news articles, 55% were neutral, 33% positive, and 12% negative, indicating predominantly neutral coverage with a positive tilt.
Conclusion: Indices futures day traders are facing a news backdrop with limited negative sentiment and more positive than negative articles.
GLD,Gold Articles: 10
- Positive: 40.00%
- Neutral: 40.00%
- Negative: 20.00%
Sentiment Summary: GLD/Gold coverage is balanced to mildly positive, with 40% positive, 40% neutral, and 20% negative articles.
Conclusion: Gold-related news tone shows limited directional consensus for indices futures day traders.
USO,Oil Articles: 13
- Negative: 53.85%
- Neutral: 38.46%
- Positive: 7.69%
Sentiment Summary: USO and oil coverage is predominantly negative (54%), with 38% neutral and 8% positive across 13 articles.
Conclusion: Oil-related news tone is negative overall, which may be relevant to energy-sector sensitivity in index futures.
Market Data Snapshot
ETF Snapshot of major stock market ETFs, Mag7, and others as of: October 5, 2026 05:00
Top Movers & Losers
- TSLA 378.73 Bullish 2.20% ▲
- NVDA 238.90 Bullish 2.12% ▲
- META 741.90 Bullish 1.90% ▲
- AAPL 332.89 Bearish -0.24% ▼
- TLT 77.11 Bearish -0.48% ▼
- USO 143.99 Bearish -2.29% ▼
Major Index ETFs: SPY, QQQ, DIA, IWM, IJH
- QQQ 756.20 Bullish 0.88% ▲
- SPY 774.83 Bullish 0.67% ▲
- IWM 283.38 Bullish 0.66% ▲
- IJH 73.68 Bullish 0.40% ▲
- DIA 512.11 Bullish 0.20% ▲
Major index ETFs were Bullish across the board. QQQ led as the most bullish mover at +0.88%, followed by SPY at +0.67% and IWM at +0.66%. IJH gained +0.40%, while DIA was the least positive mover at +0.20%.
Mag 7 Stocks: AAPL, MSFT, GOOG, AMZN, META, NVDA, TSLA
- TSLA 378.73 Bullish 2.20% ▲
- NVDA 238.90 Bullish 2.12% ▲
- META 741.90 Bullish 1.90% ▲
- MSFT 525.18 Bullish 1.48% ▲
- GOOG 343.83 Bullish 1.02% ▲
- AMZN 251.40 Bearish -0.05% ▼
- AAPL 332.89 Bearish -0.24% ▼
Mixed: TSLA is the most bullish mover at +2.20%, followed by NVDA +2.12%, META +1.90%, MSFT +1.48%, and GOOG +1.02%. AAPL is the most bearish mover at -0.24%, while AMZN is marginally Bearish at -0.05%.
Cross-Market ETFs: TLT, GLD, USO, IBIT
- IBIT 48.56 Bullish 1.74% ▲
- GLD 379.55 Bearish -0.16% ▼
- TLT 77.11 Bearish -0.48% ▼
- USO 143.99 Bearish -2.29% ▼
Mixed cross-market snapshot: IBIT is the most bullish mover at +1.74%. USO is the most bearish mover at -2.29%, while TLT declined -0.48% and GLD was marginally lower at -0.16%.
ETF, Mag7, and Cross-Market ETF Insights
Overall Tone
Mixed, with broadly Bullish equity ETFs and Mag7 leadership contrasted by Bearish moves in bonds, gold, and especially oil.
Equity ETFs and Mag7:
Major Index ETFs were broadly Bullish: QQQ led at +0.88%, followed by SPY at +0.67%, IWM at +0.66%, IJH at +0.40%, and DIA as the least positive mover at +0.20%. Mag7 performance was selective but Bullish overall, led by TSLA—the most bullish mover—at +2.20%, with NVDA at +2.12% and META at +1.90%; AAPL was the most bearish Mag7 mover at -0.24%, while AMZN was marginally Bearish at -0.05%.
Cross-Market ETFs:
Cross-Market ETFs were Mixed versus the Bullish equity complex, with IBIT advancing +1.74% as the most bullish cross-market mover. GLD was marginally Bearish at -0.16% and TLT declined -0.48%, while USO was the most bearish mover across the snapshot at -2.29%.
Futures Indices – Higher Time Frame Analysis
Summary of the current state of US Indices Futures based on higher time-frame (HTF) technical analysis as of: 2026-10-05: 17:00 CT.
US Indices Futures
- ES: YSFG/MSFG up, WSFG down; above benchmarks; 7906.25 resistance, 7828.75 reversal, 7672.75 support; consolidation within higher-timeframe uptrend.
- NQ: YSFG/MSFG up, WSFG down; above rising benchmarks; 31282.50-31389.25 resistance, 30326.50 reversal, 29033.00 support; pivot structure up.
- YM: YSFG/MSFG up, WSFG near F0%; below short benchmarks; 50859-50896 support, 52027/53223 resistance, 55316 major resistance; sharp correction.
- EMD: YSFG/MSFG up, WSFG down; weekly below short benchmarks; 3600.3 support, 3699.6/3713.1 resistance; daily V-rebound within mixed intermediate structure.
- RTY: YSFG/MSFG up, WSFG corrective; below short weekly benchmarks; 2791.5 support, 2875.3/2952.9 resistance, 3101.8 major resistance; recovery remains constrained.
- FDAX: YSFG/MSFG up, WSFG down; below short benchmarks; 24978/24897 support, 25640/25990 resistance, 26847 major resistance; broader structure remains up.
Overall State
- Short-Term: Bearish
- Intermediate-Term: Neutral
- Long-Term: Bullish
Conclusion
ES and NQ retain the strongest higher-timeframe alignment, with YSFG and MSFG trends up and price above key benchmarks; both are consolidating beneath pivot-high resistance. YM, EMD, RTY, and FDAX display short-term corrective structures against broadly rising yearly and monthly frameworks. WSFG conditions are generally down or below F0% references, aligning with near-term retracement pressure. Pivot-low supports define current structural references, while nearby pivot-high thresholds and benchmark clusters define overhead resistance.
Note: Intra-day counter-trend pullbacks or retracements may occur, HTF is context for informational usage and market structure. Glossary: Session Fib Grids periods of YSFG:’Yearly’, MSFG:’Monthly’, WSFG:’Weekly’
For full details visit: AlphaWebTrader Technicals
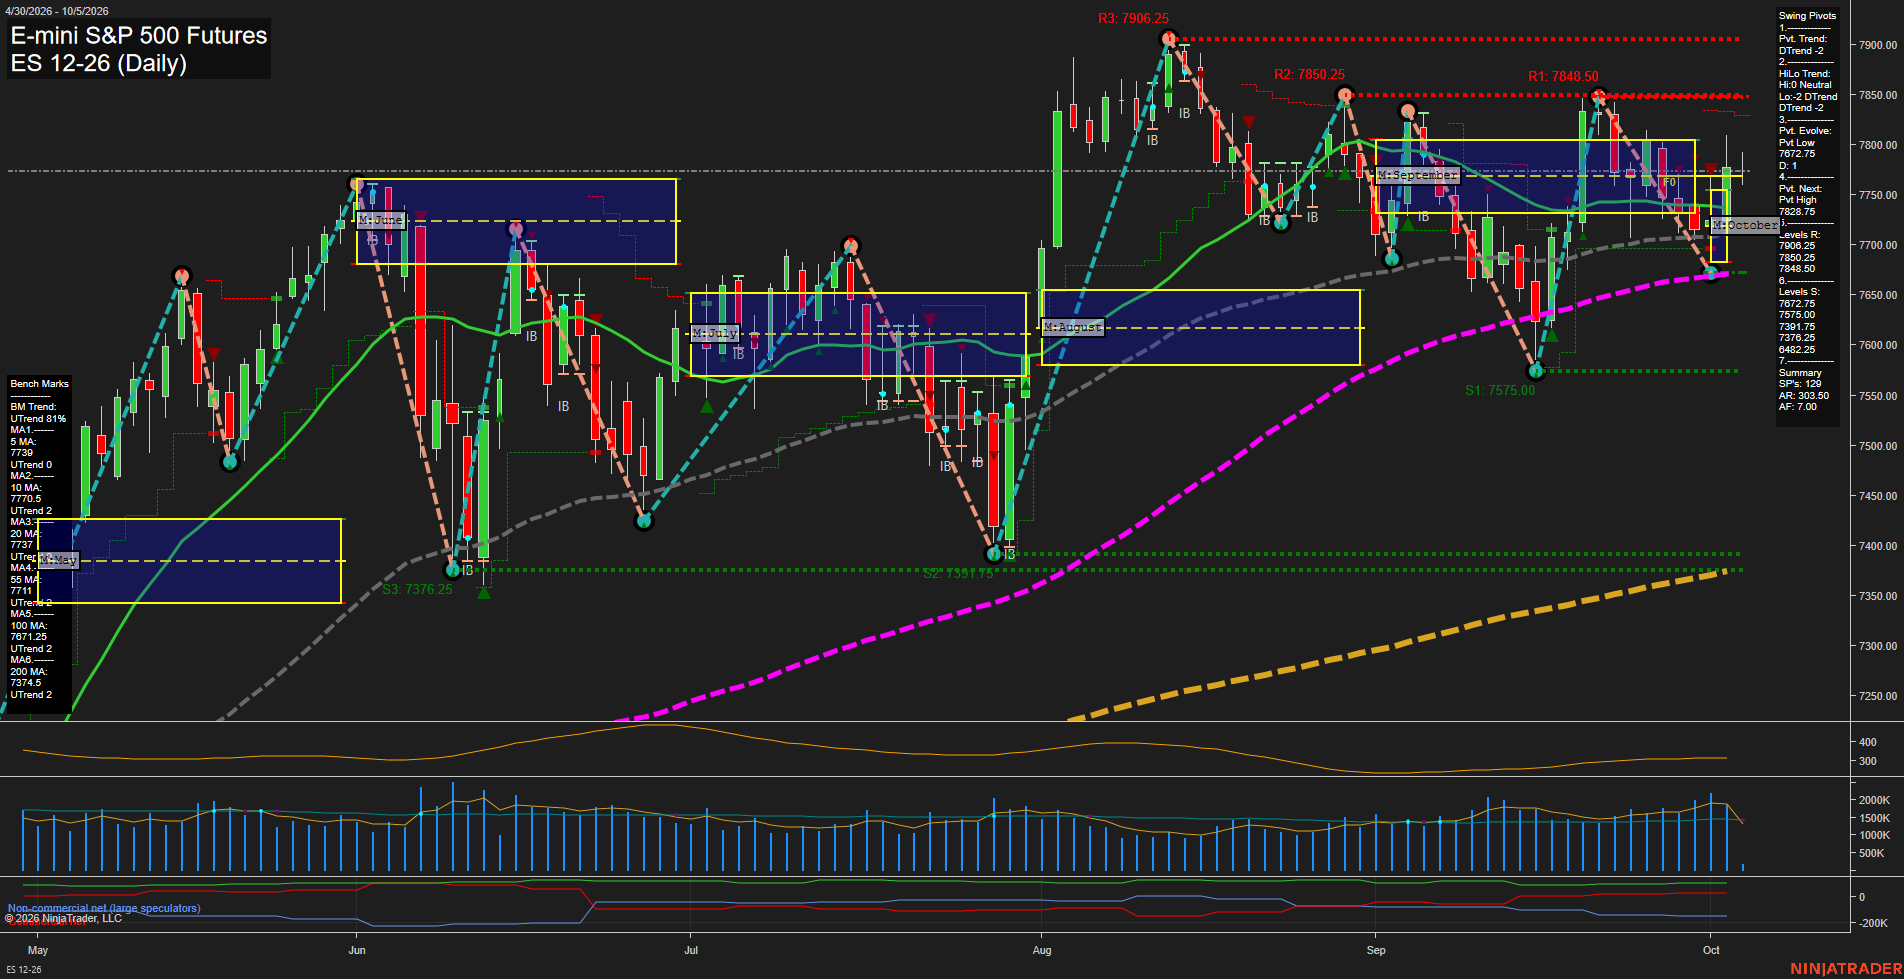
ES Daily View
Overall Rating
- Short-Term: Neutral
- Intermediate-Term: Bullish
- Long-Term: Bullish.
Key Insights Summary
The daily structure remains broadly constructive above the rising 20, 55, 100, and 200-day benchmarks, while the monthly and yearly fib grids retain an upside bias. Short-term action is less decisive: the weekly grid is negative, the active pivot trend is down, and price is consolidating beneath the 7828.75 pivot reversal level and the 7848.50-7850.25 resistance cluster. The recent decline from 7906.25 has the character of a retracement within the larger advance, with 7672.75 defining the key nearby swing-low support. Small recent bars and slower momentum reflect a compression phase following elevated volatility rather than a broad long-term trend reversal.
View charts on: AlphaWebTrader HTF Charts
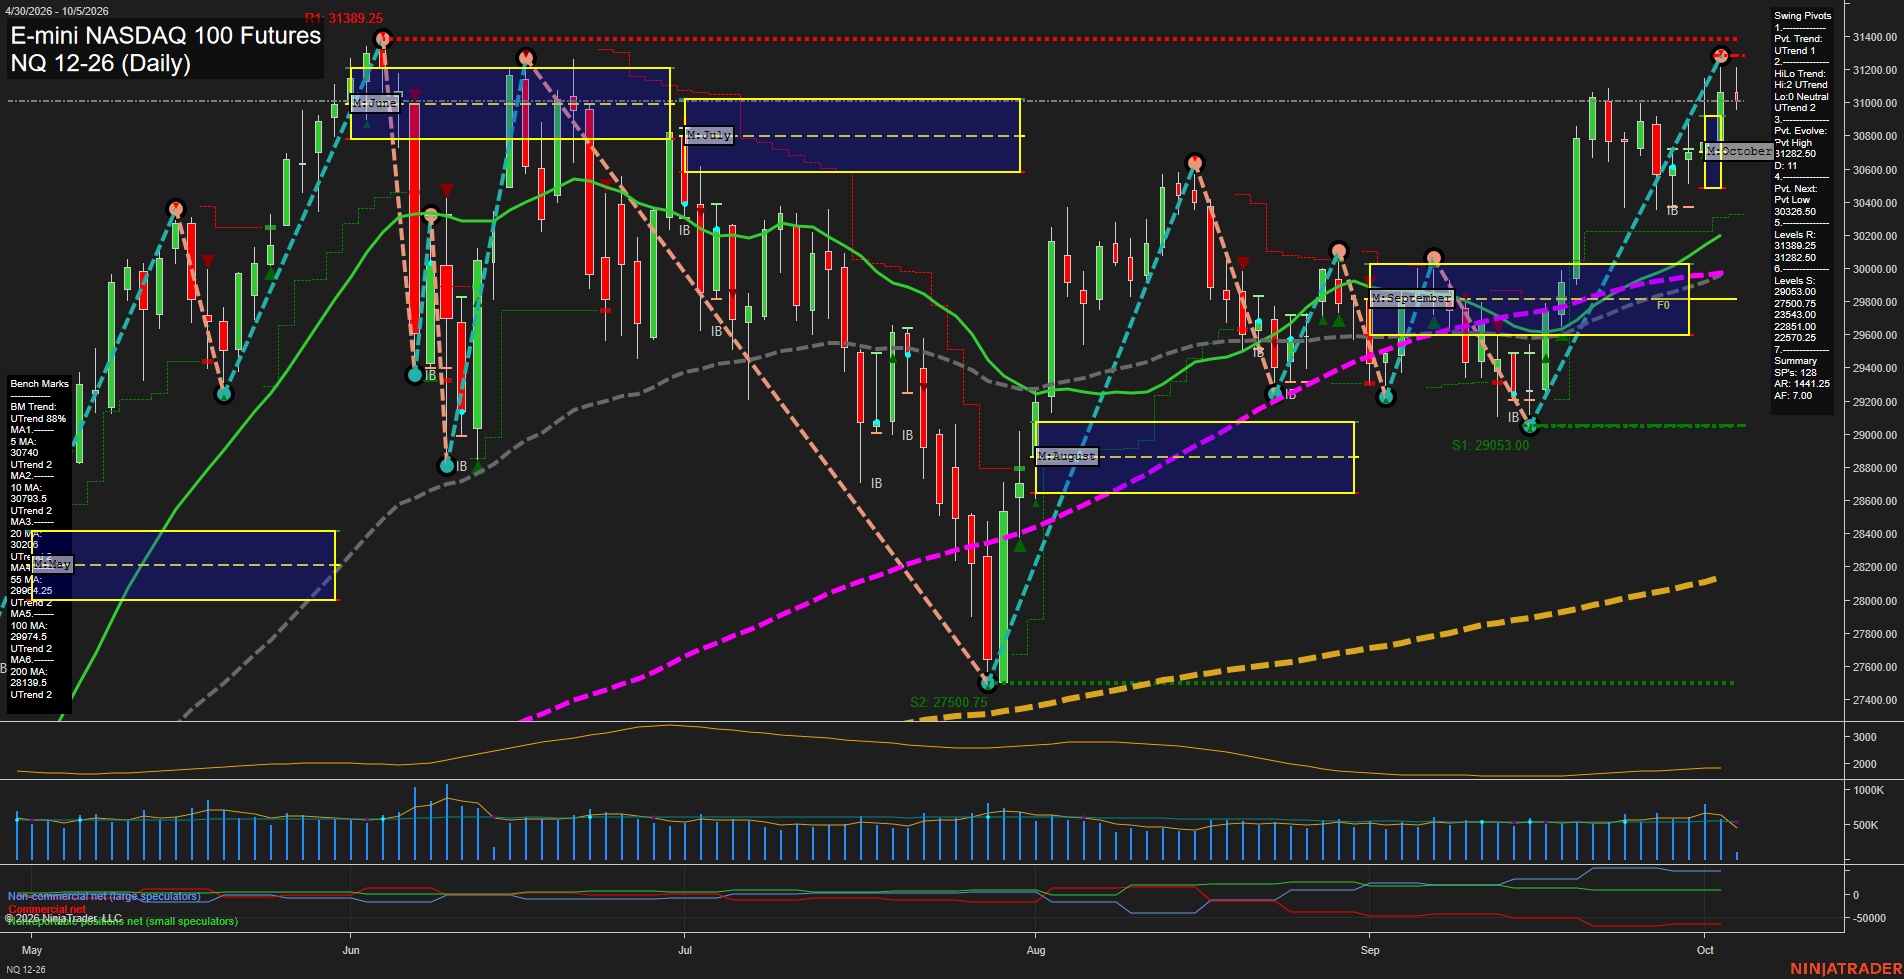
NQ Daily View
Overall Rating
- Short-Term: Neutral
- Intermediate-Term: Bullish
- Long-Term: Bullish.
Key Insights Summary
Price remains in a broad bullish swing structure, holding above all displayed daily benchmarks and maintaining both UTrend pivot readings. The recovery from the September 29053.00 swing low produced higher lows and a strong advance into the 31282.50 to 31389.25 resistance zone. Short-term conditions are mixed because price is below the weekly F0% area and the latest bars show consolidation beneath resistance, while the monthly and yearly fib-grid positions remain positive. The 30326.50 pivot-low reversal level defines the nearby swing structure, with the 20-day and 55-day averages clustered beneath price and reinforcing the intermediate trend recovery.
View charts on: AlphaWebTrader HTF Charts
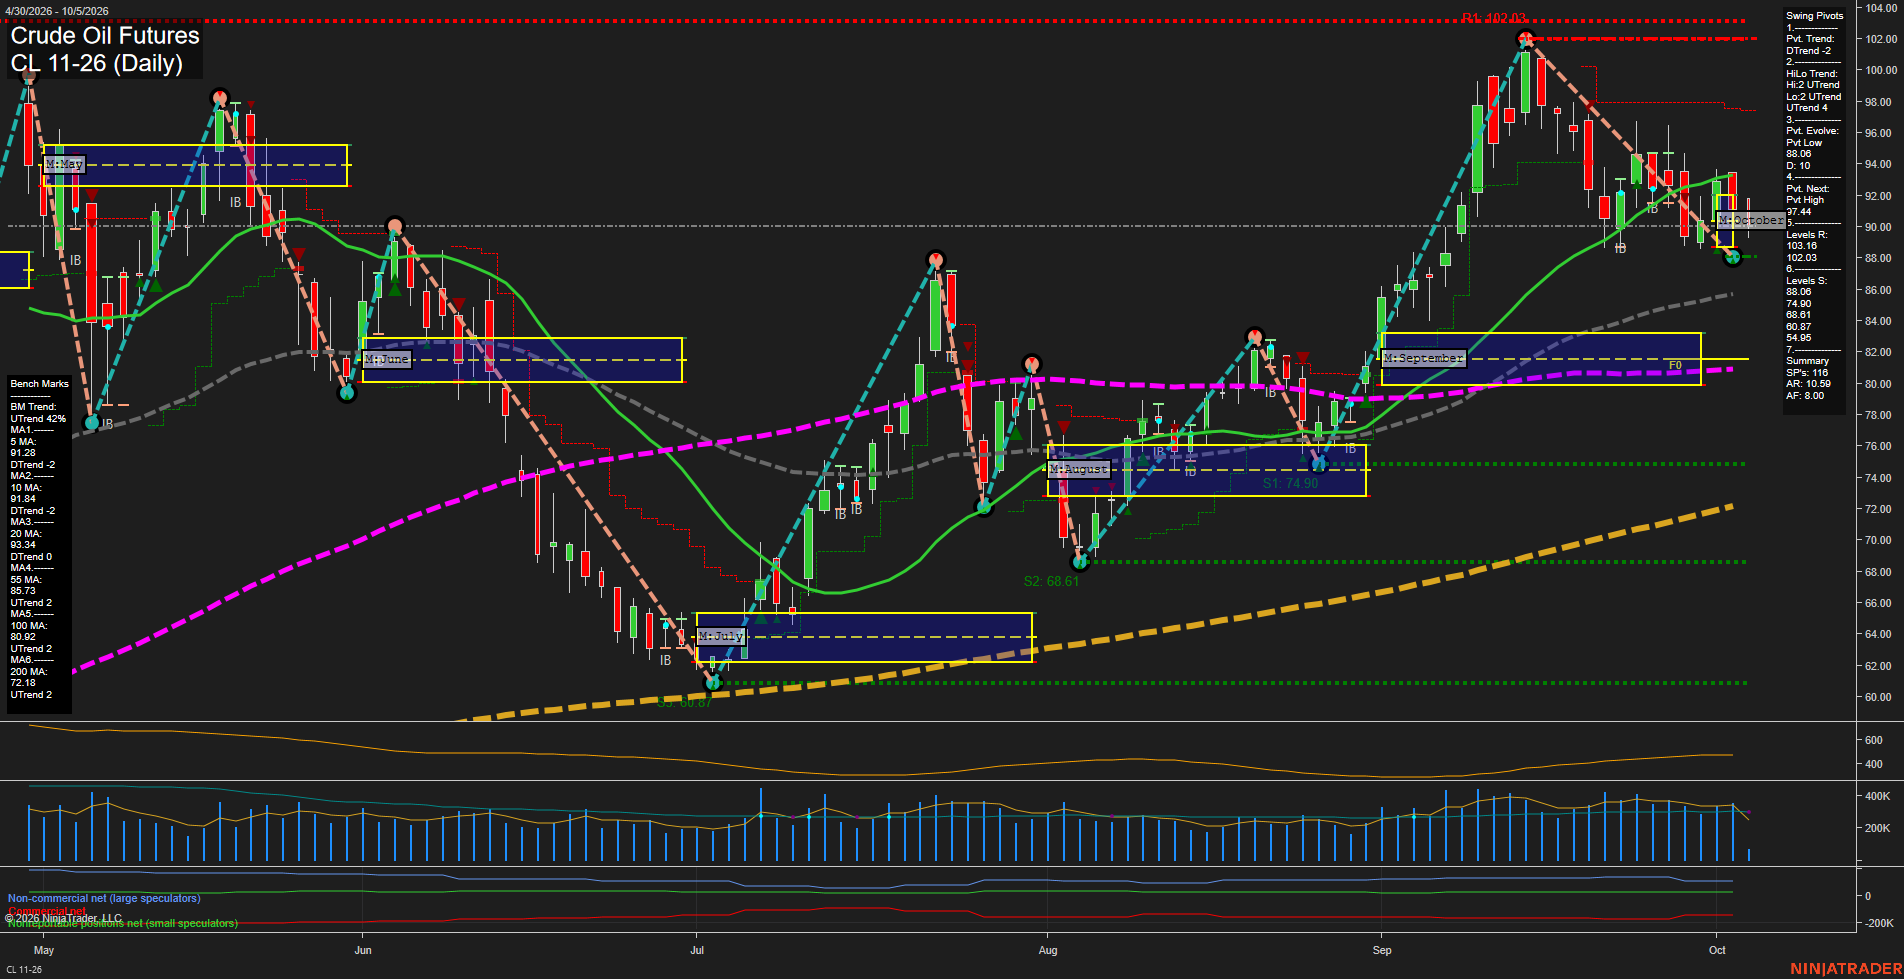
CL Daily View
Overall Rating
- Short-Term: Bearish
- Intermediate-Term: Bullish
- Long-Term: Bullish.
Key Insights Summary
CL is in a short-term pullback following the September rally toward 102.03. Price is below the falling 5, 10, and 20-day benchmarks, below the weekly F0% area, and the active pivot trend remains down. The 88.06 pivot low is the immediate structural support, while 94.18 is the first overhead pivot resistance. Intermediate and long-term structure remain constructive: price holds above the rising 55, 100, and 200-day benchmarks, while the monthly and yearly Fib-grid biases remain positive. The current pattern reflects a countertrend retracement within the broader recovery phase, with medium-sized bars and average momentum indicating consolidation rather than a decisive volatility expansion.
View charts on: AlphaWebTrader HTF Charts
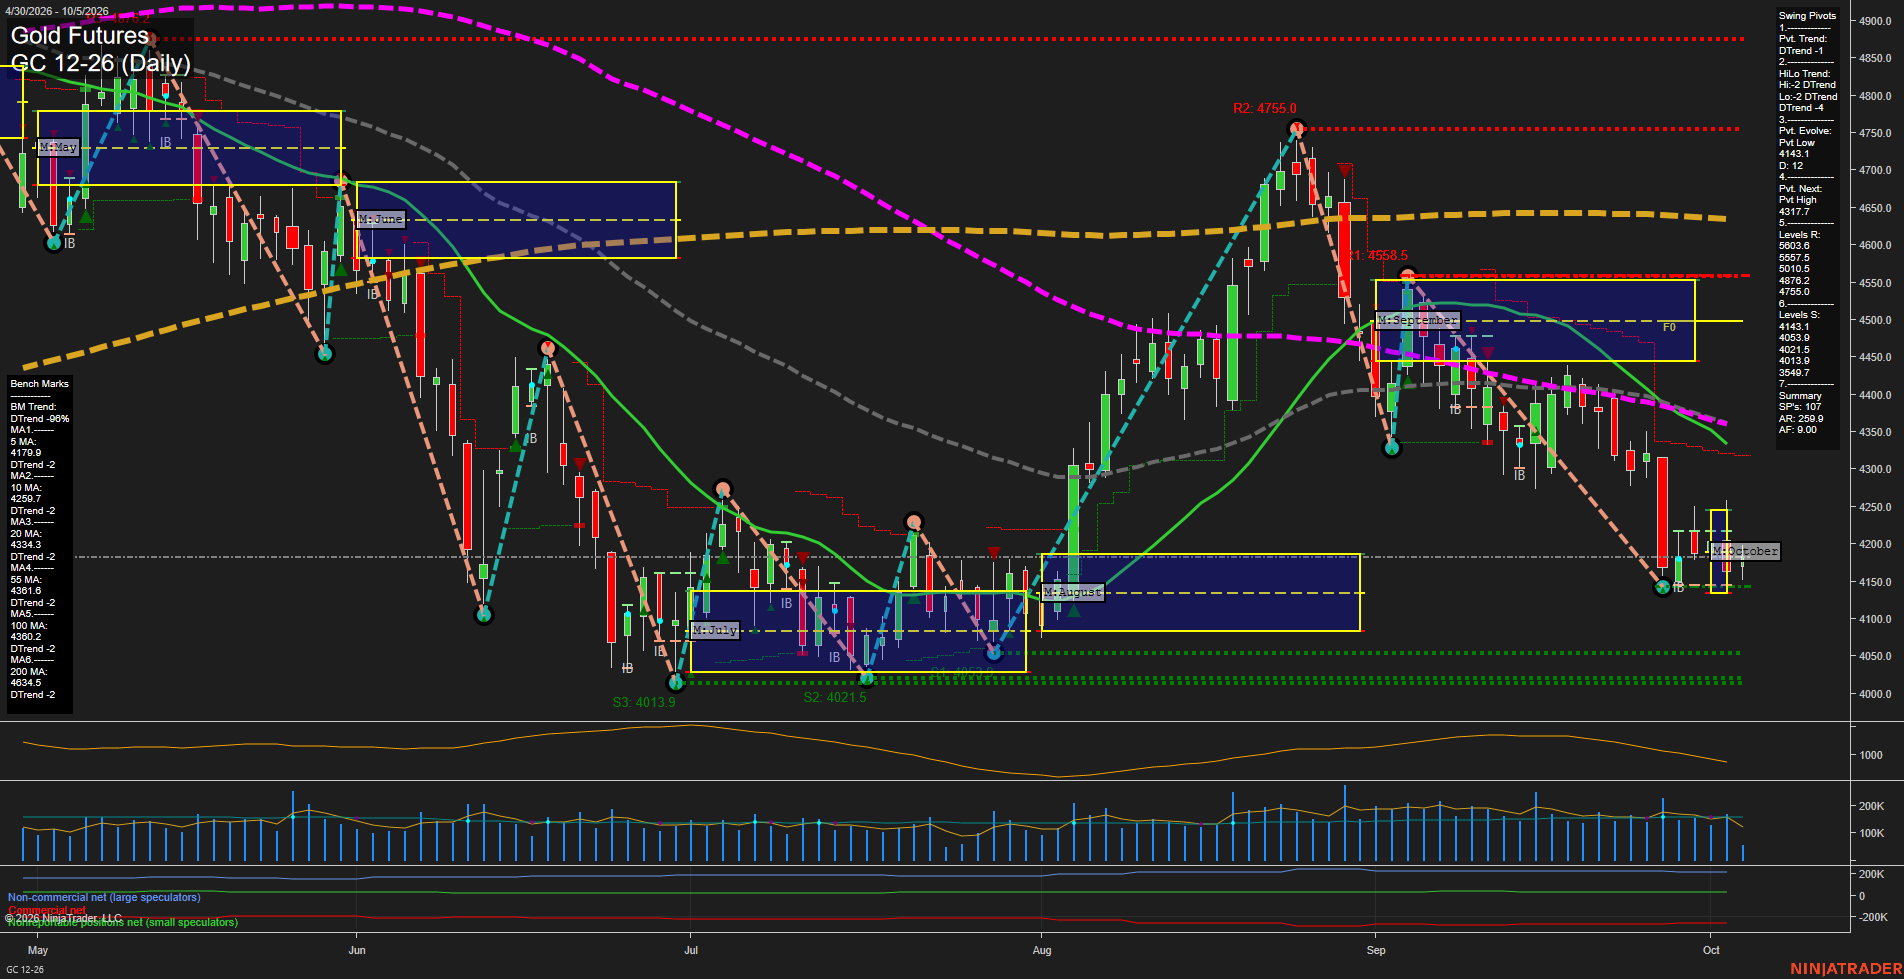
GC Daily View
Overall Rating
- Short-Term: Bearish
- Intermediate-Term: Bearish
- Long-Term: Bearish.
Key Insights Summary
Gold is consolidating with small daily bars near 4197 after a sharp September decline and a test of the 4143.1 swing-low area. The weekly grid remains constructive, but price is below the October monthly F0%/NTZ zone and beneath the 10-, 20-, 55-, 100-, and 200-day benchmarks, which remain aligned in down trends. The active pivot structure remains DTrend/DTrend, with 4317.7 defining the next pivot-high reversal threshold and 4143.1, then the clustered 4053.9 to 4013.9 area, defining the nearby downside structure. The current action reflects a low-momentum pause within the larger bearish swing sequence rather than a confirmed trend reversal.
View charts on: AlphaWebTrader HTF Charts
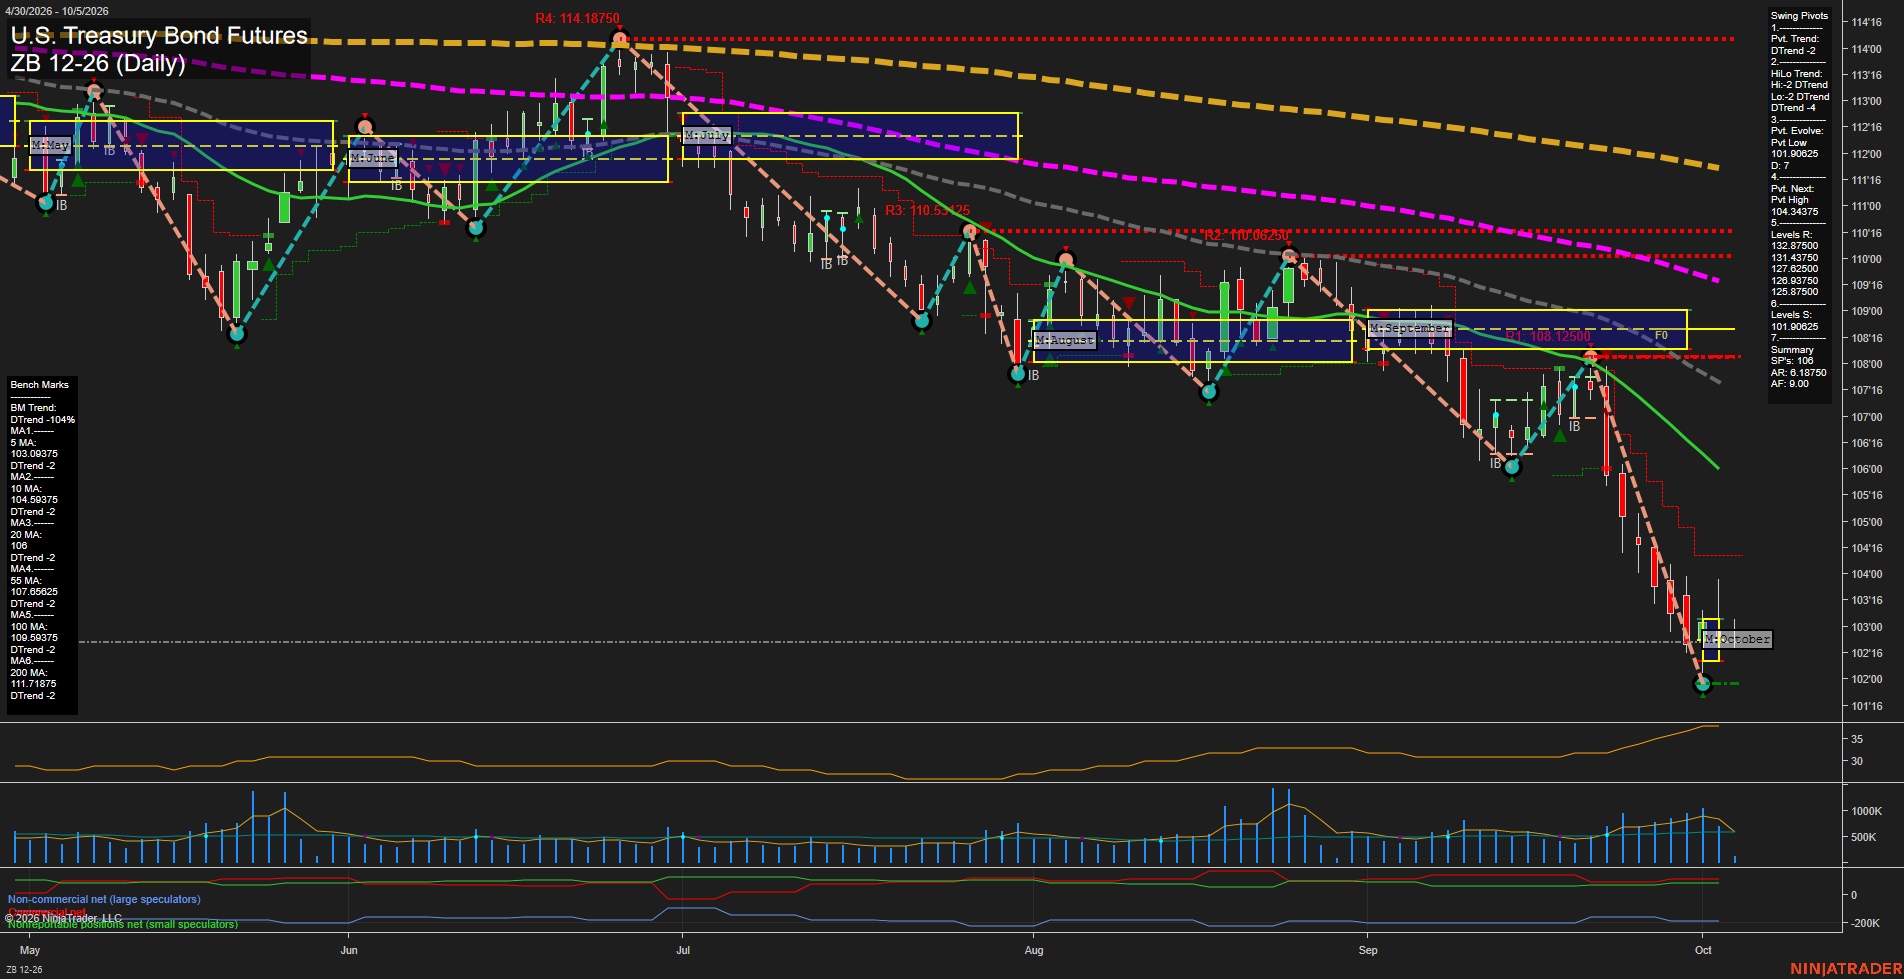
ZB Daily View
Overall Rating
- Short-Term: Bearish
- Intermediate-Term: Bearish
- Long-Term: Bearish.
Key Insights Summary
Price is in a broad, accelerating daily decline, with a sequence of lower highs and lower lows confirmed by bearish short-term and intermediate-term pivot structures. The contract is below every benchmark average and below the October monthly grid, while the 5-day average remains beneath the 10-day average and both slope lower. The recent selloff expanded daily ranges and lifted ATR toward 35, indicating elevated directional volatility. The 101.90625 pivot low is the nearest structural support, while 104.34375 is the first pivot-reversal threshold and the 5-day average near 103.09375 is the closest benchmark overhead. The technical backdrop remains trend-continuation bearish rather than a completed base or recovery pattern.
View charts on: AlphaWebTrader HTF Charts