U.S. futures rise after softer jobs data as ETF movers, index-futures trends, oil disruptions and high Treasury yields shape key market risks.
Fundamentals: U.S. index futures moved higher in early trading as softer September jobs data and cooling inflation indicators reduced expectations for further Federal Reserve rate increases. Asian equities advanced, while oil, gold and currencies reacted to shifting rate expectations. Shipping risks around the Strait of Hormuz, attacks on energy infrastructure and Treasury yields above 5% remained key market cross-currents.
Technicals: Pre-market analysis highlights gains in Tesla, Alphabet and Nvidia, while bitcoin, gold and oil ETFs declined in the prior session. ES and NQ retain bullish intermediate and long-term structures despite consolidation near resistance. YM shows sharper near-term weakness, while EMD, RTY and FDAX remain in corrective or mixed short-term phases within broader trends.
Pre-Market Trading 360° view Market Radar of: holidays, earnings, eco-news, market-news summary, news sentiment, prior session major ETFs, MAG7, Higher Time Frame Analysis Indices Futures Summary, and E-mini S&P500, Nasdaq 100, NYMEX Crude, Gold Futures Daily Chart analysis.
As of: October 5, 2026 07:16 CT
EcoNews Radar U.S. Events
| Day | Time | Impact | Event |
|---|---|---|---|
| Mon | 10:00 | Medium | ISM Services PMI |
| Wed | 10:30 | Low | Crude Oil Inventories |
| Wed | 14:00 | High | FOMC Meeting Minutes |
| Thu | 08:30 | Medium | Unemployment Claims |
| Fri | 10:00 | Medium | Prelim UoM Consumer Sentiment |
| Fri | 10:00 | Medium | Prelim UoM Inflation Expectations |
EcoNews Summary
Wednesday carries the key scheduled release: FOMC Meeting Minutes. The record of the Federal Reserve’s policy discussion provides context on inflation, interest rates, growth, and financial conditions. No qualifying medium-impact EcoNews events are listed; the crude oil inventories release is classified as low impact.
Event Notes:
- Wednesday 14:00 FOMC Meeting Minutes: A detailed record of the Federal Reserve’s most recent policy meeting, covering policymakers’ views on inflation, labor conditions, economic activity, and interest-rate policy. Indices futures traders monitor the language for changes in policy tone and financial-conditions context.
Conclusion:
The single most important event is Wednesday’s 14:00 FOMC Meeting Minutes. Market momentum and volume often slow ahead of major FOMC events, with increased volatility at release time.
For full details visit: Forex Factory EcoNews
Market News Summary:
U.S. index futures moved higher early Monday as soft jobs data eased rate-hike pressure, while Middle East energy disruptions sustained cross-market risk.
Primary Drivers & Risks:
- Primary Driver: Softer jobs data eases Fed pressure
- Primary Risk: Hormuz shipping disruptions and high yields
Tone:
Cautiously constructive for equities, with significant energy and geopolitical cross-currents.
Stock Market / ETFs / Indices:
U.S. stock futures trended higher early Monday following the soft September jobs report. Japan’s Nikkei rose 2.0%, led by electronics and machinery stocks. The Dow has declined for five consecutive weeks, while S&P 500 technical commentary cited resilient price action despite elevated yields and oil prices. AI-spending scrutiny into earnings season remains a stated equity-market concern.
Geopolitical:
Iran has not reopened the Strait of Hormuz without preconditions, while attacks on vessels and energy facilities remain active risks. Tankers continue moving Middle East crude through costly and dangerous shuttle routes. U.S. pressure on South Korea regarding the Alaska LNG project added a separate trade and energy-policy issue.
Oil / Energy:
Brent crude climbed above $103 after Houthi attacks on Saudi Aramco sites, then oil prices fell as traders weighed a planned G-7 emergency crude and diesel release. OPEC+ kept November output unchanged, while a potential Apache worker strike threatened disruption to the UK Forties pipeline. Middle East exports exceeded pre-war levels during parts of late September despite tanker attacks.
Gold / Metals:
Gold rose as softer U.S. inflation and weak payrolls tempered rate-hike bets, with gold testing $4,160 and silver near $61.34. High Treasury yields kept the metals rebound fragile, alongside ongoing Middle East developments.
Fed / Financials:
Weak payrolls and softer personal-consumption expenditures data reduced expectations for additional Fed rate increases. Asian currencies consolidated against the dollar as reduced rate-hike prospects diminished the appeal of U.S. fixed-income assets. Treasury yields above 5% remain a market concern, although commentary said a fiscal crisis is not imminent.
Macro / Other:
U.S. consumer spending continues to rise despite persistent inflation and weak consumer views on the economy. The midterm-election backdrop is gaining attention, with historical commentary noting S&P 500 gains in the 12 months after prior midterm elections.
Conclusion:
Soft U.S. labor data and reduced Fed-tightening expectations supported early index-futures sentiment. Asian equities also advanced on the changing rate outlook.
Hormuz disruption, attacks on energy infrastructure, and volatile oil prices remain major cross-currents. Elevated Treasury yields, narrow market breadth, and AI-spending scrutiny add equity-market risks.
Market News Sentiment
Market News Articles: 19
- Neutral: 73.68%
- Positive: 21.05%
- Negative: 5.26%
Sentiment Summary: Market news sentiment is predominantly neutral at 74%, with 21% positive and 5% negative coverage across 19 articles.
Conclusion: Indices futures day traders are facing a largely balanced news tone, with positive coverage exceeding negative coverage.
GLD,Gold Articles: 3
- Positive: 33.33%
- Neutral: 33.33%
- Negative: 33.33%
Sentiment Summary: GLD/Gold coverage is evenly split, with 33% positive, 33% neutral, and 33% negative sentiment across 3 articles.
Conclusion: Gold-related news tone is balanced, providing no clear directional sentiment signal for indices futures traders.
USO,Oil Articles: 10
- Negative: 60.00%
- Positive: 20.00%
- Neutral: 20.00%
Sentiment Summary: USO/Oil coverage is predominantly negative, with 60% negative, 20% positive, and 20% neutral articles.
Conclusion: The oil-news tone is negative, which may be relevant context for energy-linked components of index futures.
Market Data Snapshot
ETF Snapshot of major stock market ETFs, Mag7, and others as of: October 5, 2026 07:16
Top Movers & Losers
- TSLA 370.59 Bullish 4.65% ▲
- GOOG 340.35 Bullish 1.62% ▲
- NVDA 233.95 Bullish 1.34% ▲
- IBIT 47.73 Bearish -0.48% ▼
- GLD 380.14 Bearish -0.68% ▼
- USO 147.37 Bearish -1.77% ▼
Major Index ETFs: SPY, QQQ, DIA, IWM, IJH
- QQQ 749.58 Bullish 1.02% ▲
- IJH 73.39 Bullish 0.95% ▲
- IWM 281.52 Bullish 0.90% ▲
- SPY 769.64 Bullish 0.74% ▲
- DIA 511.10 Bullish 0.49% ▲
Major index ETFs are Bullish across the group: QQQ leads as the most bullish mover at +1.02%, followed by IJH at +0.95% and IWM at +0.90%. SPY gains +0.74%, while DIA is the least positive mover at +0.49%.
Mag 7 Stocks: AAPL, MSFT, GOOG, AMZN, META, NVDA, TSLA
- TSLA 370.59 Bullish 4.65% ▲
- GOOG 340.35 Bullish 1.62% ▲
- NVDA 233.95 Bullish 1.34% ▲
- AMZN 251.52 Bullish 1.33% ▲
- AAPL 333.69 Bullish 1.02% ▲
- MSFT 517.53 Bullish 0.92% ▲
- META 728.08 Bullish 0.30% ▲
Mag7 breadth is Bullish, with all constituents positive. TSLA is the most bullish mover at +4.65%, followed by GOOG at +1.62%, NVDA at +1.34%, and AMZN at +1.33%. AAPL gained +1.02% and MSFT added +0.92%. META is the least positive mover at +0.30%.
Cross-Market ETFs: TLT, GLD, USO, IBIT
- TLT 77.48 Bearish -0.30% ▼
- IBIT 47.73 Bearish -0.48% ▼
- GLD 380.14 Bearish -0.68% ▼
- USO 147.37 Bearish -1.77% ▼
Other ETFs were Bearish across the snapshot: USO led losses at -1.77%, while GLD declined -0.68% and IBIT fell -0.48%. TLT was the least negative mover at -0.30%.
ETF, Mag7, and Cross-Market ETF Insights
Overall Tone
Risk On tone: equity ETFs and all Mag7 components are Bullish, while cross-market ETFs are Bearish.
Equity ETFs and Mag7:
Major Index ETFs are broadly Bullish, led by QQQ at +1.02%, followed by IJH at +0.95%, IWM at +0.90%, SPY at +0.74%, and DIA at +0.49%; QQQ is the most bullish ETF mover and DIA is the least positive. Mag7 participation is also broadly Bullish, with TSLA the most bullish mover at +4.65%, while META is the least positive at +0.30%. GOOG at +1.62%, NVDA at +1.34%, AMZN at +1.33%, AAPL at +1.02%, and MSFT at +0.92% support aligned equity leadership.
Cross-Market ETFs:
Cross-market ETFs are uniformly Bearish, diverging from Bullish equities. USO is the most bearish mover at -1.77%, followed by GLD at -0.68% and IBIT at -0.48%. TLT is the least negative mover at -0.30%, while commodity, gold, bond, and bitcoin ETF weakness contrasts with the equity advance.
Futures Indices – Higher Time Frame Analysis
Summary of the current state of US Indices Futures based on higher time-frame (HTF) technical analysis as of: 2026-10-05: 07:16 CT.
US Indices Futures
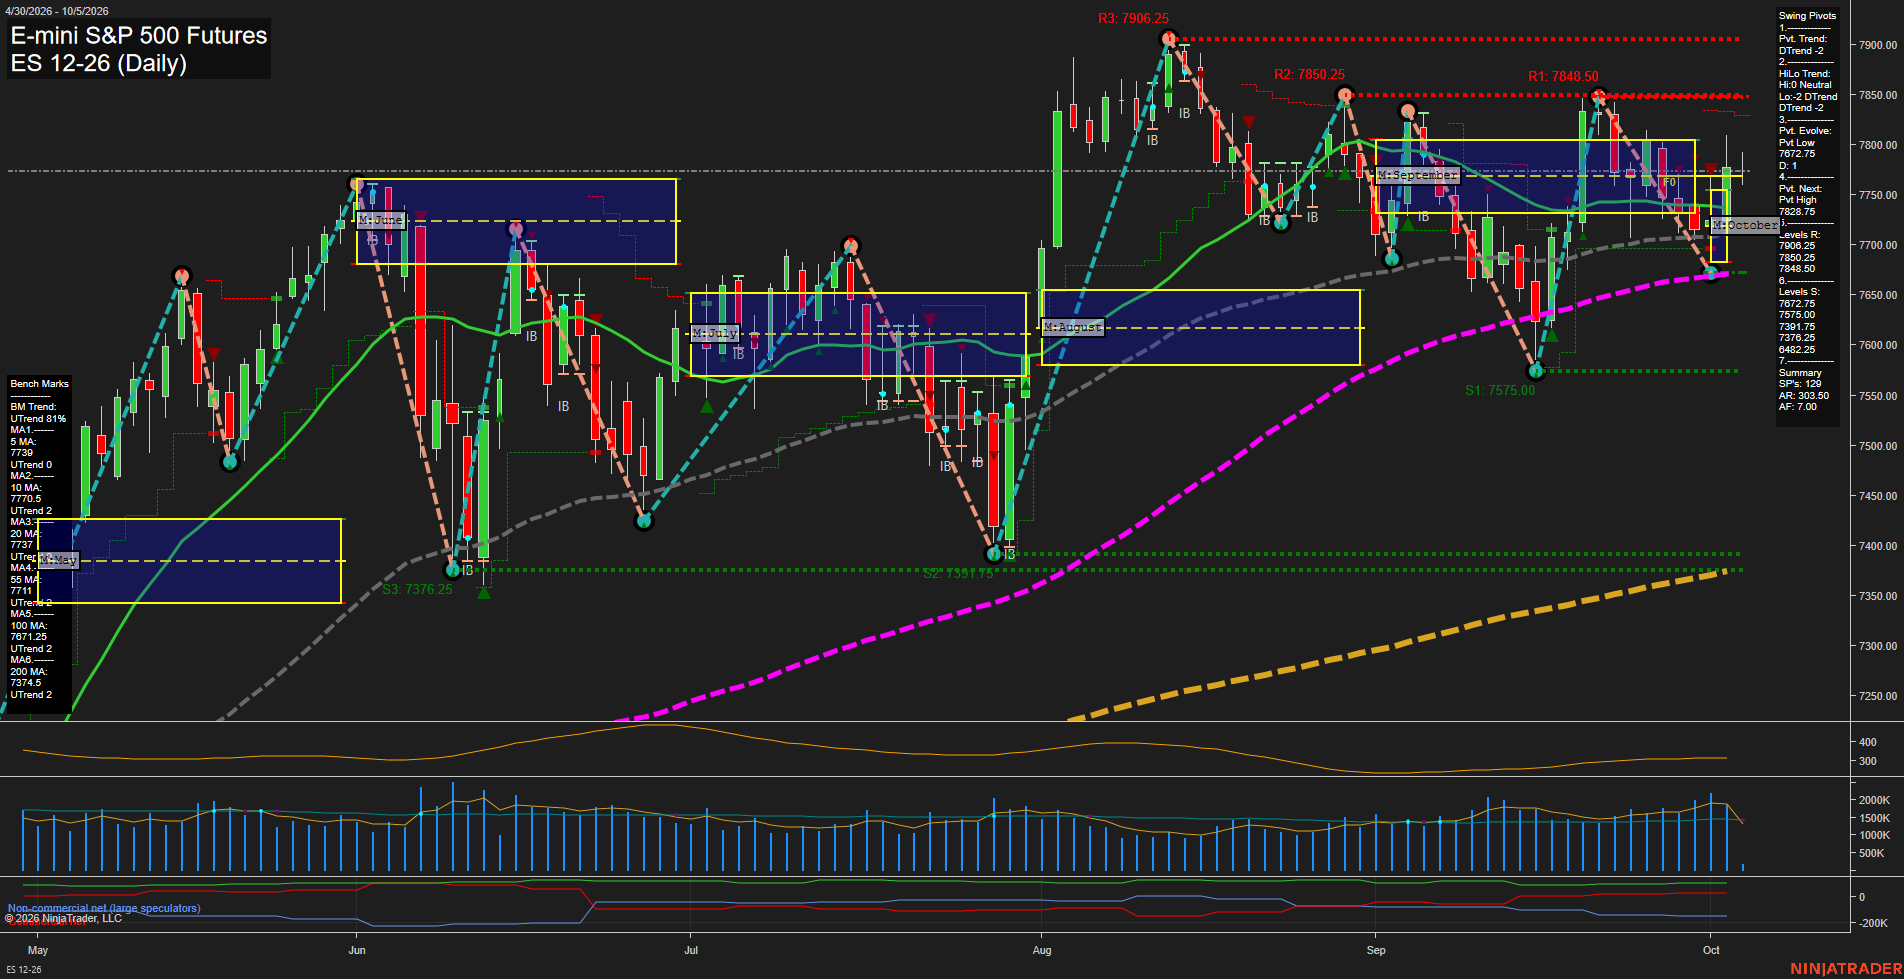
- ES YSFG/MSFG up, WSFG down; above benchmarks; 7906.25 resistance, 7575.75 pivot support; consolidation beneath pivot-high.
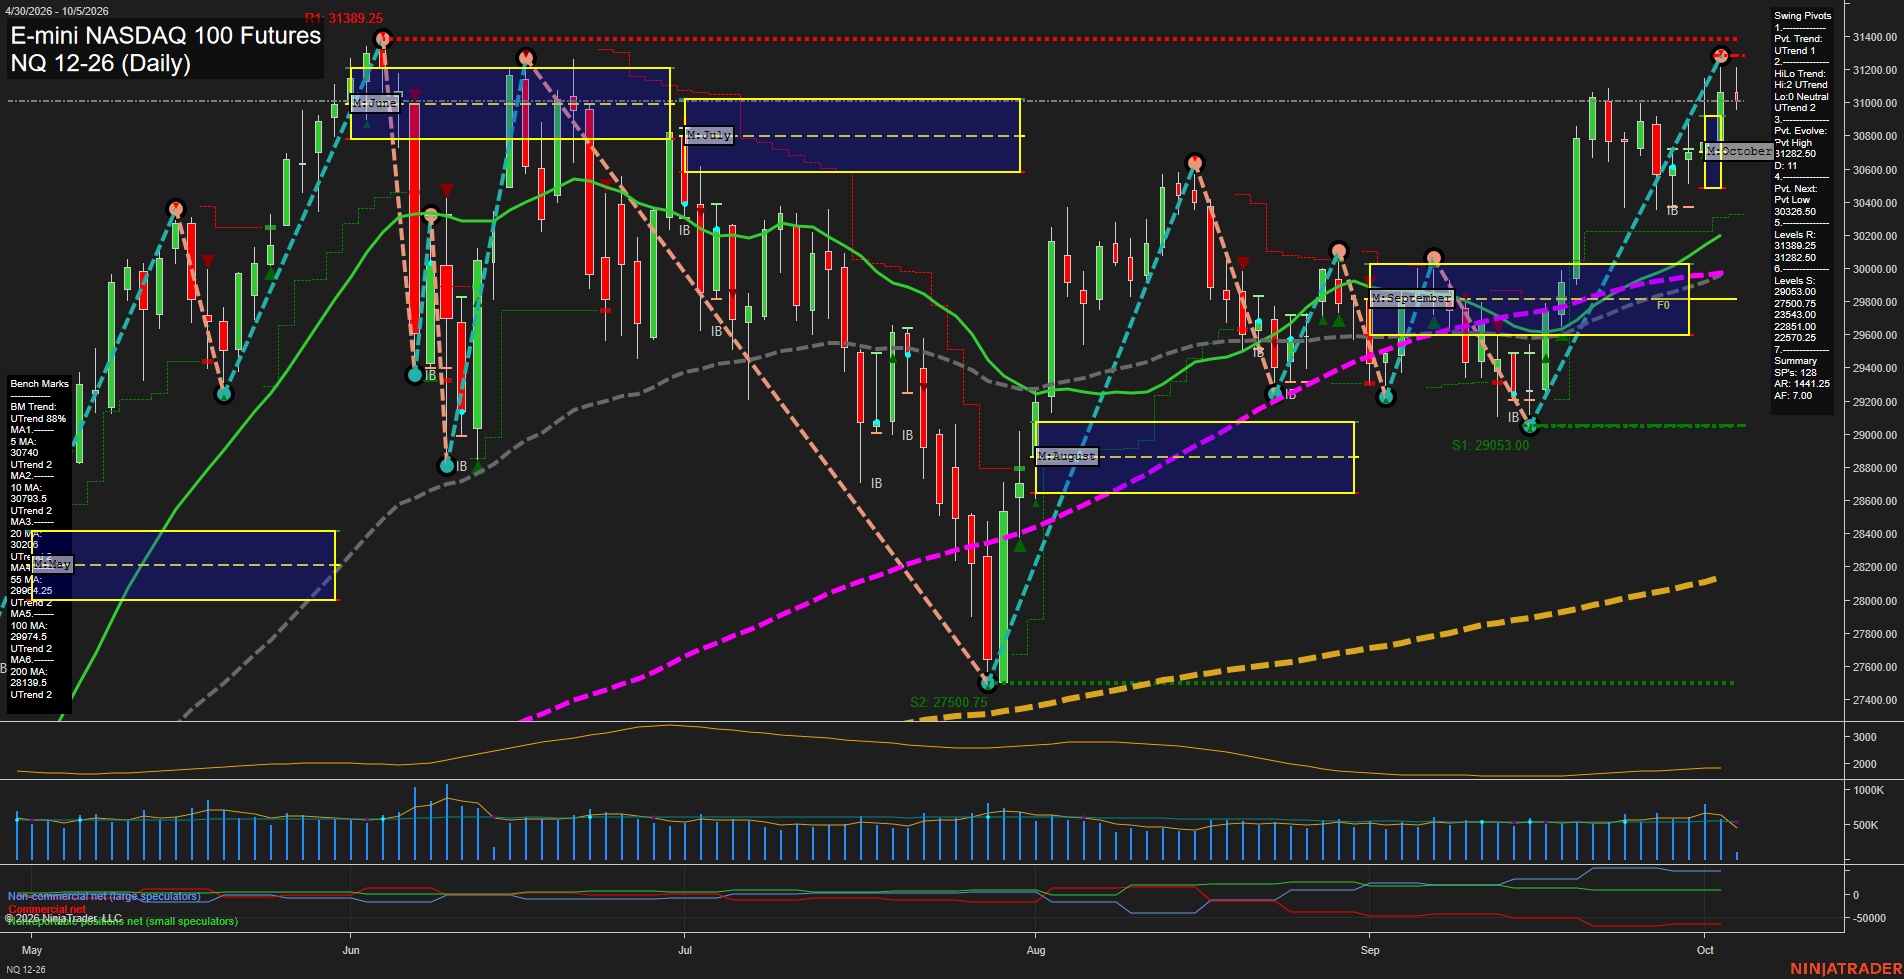
- NQ YSFG/MSFG up, WSFG down; above rising benchmarks; 31282.50-31389.25 resistance, 30326.50 pivot support; short-term pivot up.
- YM YSFG/MSFG up, WSFG near F0%; declining short benchmarks; 50859 support, 52027/53223 resistance; sharp corrective downswing.
- EMD YSFG/MSFG up, WSFG down; below weekly short benchmarks; 3600.3 support, 3699.6/3713.1 resistance; volatile daily rebound.
- RTY YSFG/MSFG up, WSFG corrective; below short weekly benchmarks; 2791.5 support, 2875.3/2952.9 resistance; rebound remains intermediate downtrend.
- FDAX YSFG/MSFG constructive, WSFG down; below short benchmarks; 24978 support, 25640/26030 resistance; daily and weekly corrective structure.
Overall State
- Short-Term: Neutral
- Intermediate-Term: Bullish
- Long-Term: Bullish
Conclusion
YSFG and MSFG structure remains upward across ES, NQ, YM, EMD, RTY, and FDAX, with longer benchmarks generally rising. ES and NQ hold above benchmark clusters, while YM, EMD, RTY, and FDAX retain weekly corrective conditions beneath short-term benchmarks. WSFG readings are predominantly down or below F0%/NTZ references, aligning with consolidation or retracement phases. NQ leads at prior swing-high resistance; ES is consolidating below 7906.25. YM, EMD, RTY, and FDAX are positioned around identified swing-support and reversal thresholds within broader higher-time-frame structures.
Note: Intra-day counter-trend pullbacks or retracements may occur, HTF is context for informational usage and market structure. Glossary: Session Fib Grids periods of YSFG:’Yearly’, MSFG:’Monthly’, WSFG:’Weekly’
For full details visit: AlphaWebTrader Technicals
ES Daily View
Overall Rating
- Short-Term: Neutral
- Intermediate-Term: Bullish
- Long-Term: Bullish.
Key Insights Summary
The daily structure remains broadly constructive above the rising 20, 55, 100, and 200-day benchmarks, while the monthly and yearly fib grids retain an upside bias. Short-term action is less decisive: the weekly grid is negative, the active pivot trend is down, and price is consolidating beneath the 7828.75 pivot reversal level and the 7848.50-7850.25 resistance cluster. The recent decline from 7906.25 has the character of a retracement within the larger advance, with 7672.75 defining the key nearby swing-low support. Small recent bars and slower momentum reflect a compression phase following elevated volatility rather than a broad long-term trend reversal.
View charts on: AlphaWebTrader HTF Charts
NQ Daily View
Overall Rating
- Short-Term: Neutral
- Intermediate-Term: Bullish
- Long-Term: Bullish.
Key Insights Summary
Price remains in a broad bullish swing structure, holding above all displayed daily benchmarks and maintaining both UTrend pivot readings. The recovery from the September 29053.00 swing low produced higher lows and a strong advance into the 31282.50 to 31389.25 resistance zone. Short-term conditions are mixed because price is below the weekly F0% area and the latest bars show consolidation beneath resistance, while the monthly and yearly fib-grid positions remain positive. The 30326.50 pivot-low reversal level defines the nearby swing structure, with the 20-day and 55-day averages clustered beneath price and reinforcing the intermediate trend recovery.
View charts on: AlphaWebTrader HTF Charts
CL Daily View
Overall Rating
- Short-Term: Bearish
- Intermediate-Term: Bullish
- Long-Term: Bullish.
Key Insights Summary
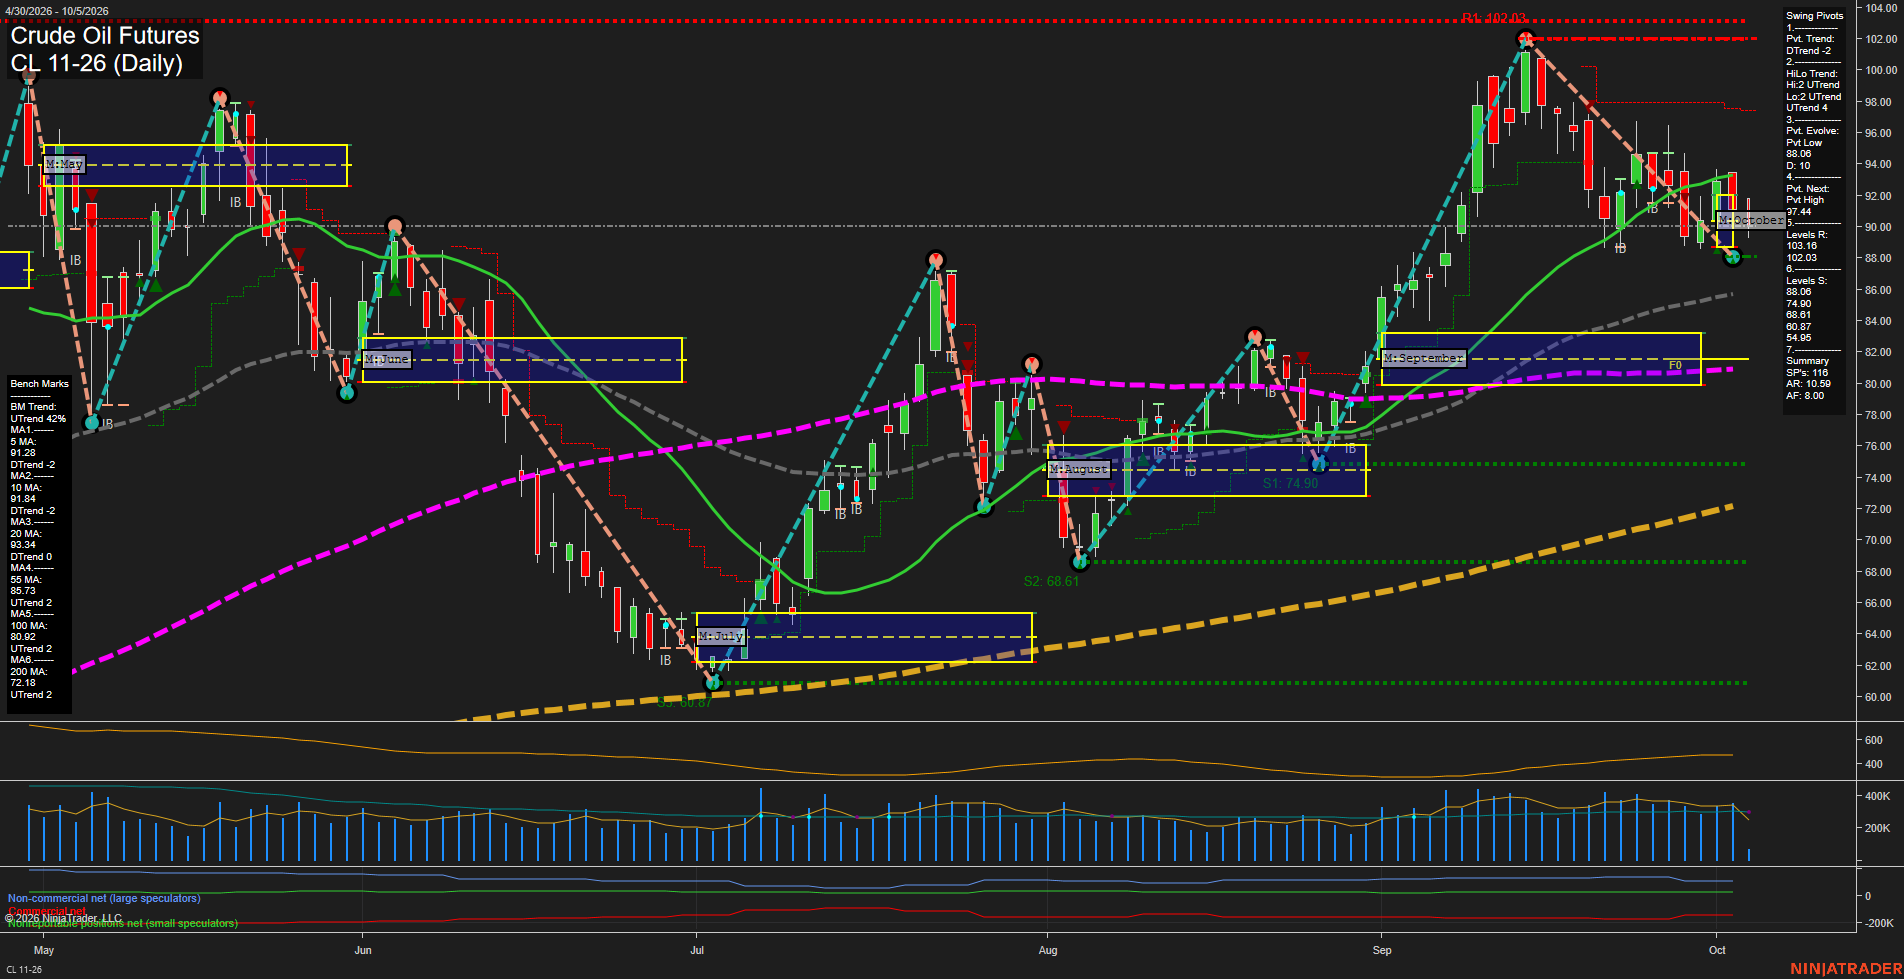
CL is in a short-term pullback following the September rally toward 102.03. Price is below the falling 5, 10, and 20-day benchmarks, below the weekly F0% area, and the active pivot trend remains down. The 88.06 pivot low is the immediate structural support, while 94.18 is the first overhead pivot resistance. Intermediate and long-term structure remain constructive: price holds above the rising 55, 100, and 200-day benchmarks, while the monthly and yearly Fib-grid biases remain positive. The current pattern reflects a countertrend retracement within the broader recovery phase, with medium-sized bars and average momentum indicating consolidation rather than a decisive volatility expansion.
View charts on: AlphaWebTrader HTF Charts
GC Daily View
Overall Rating
- Short-Term: Bearish
- Intermediate-Term: Bearish
- Long-Term: Bearish.
Key Insights Summary
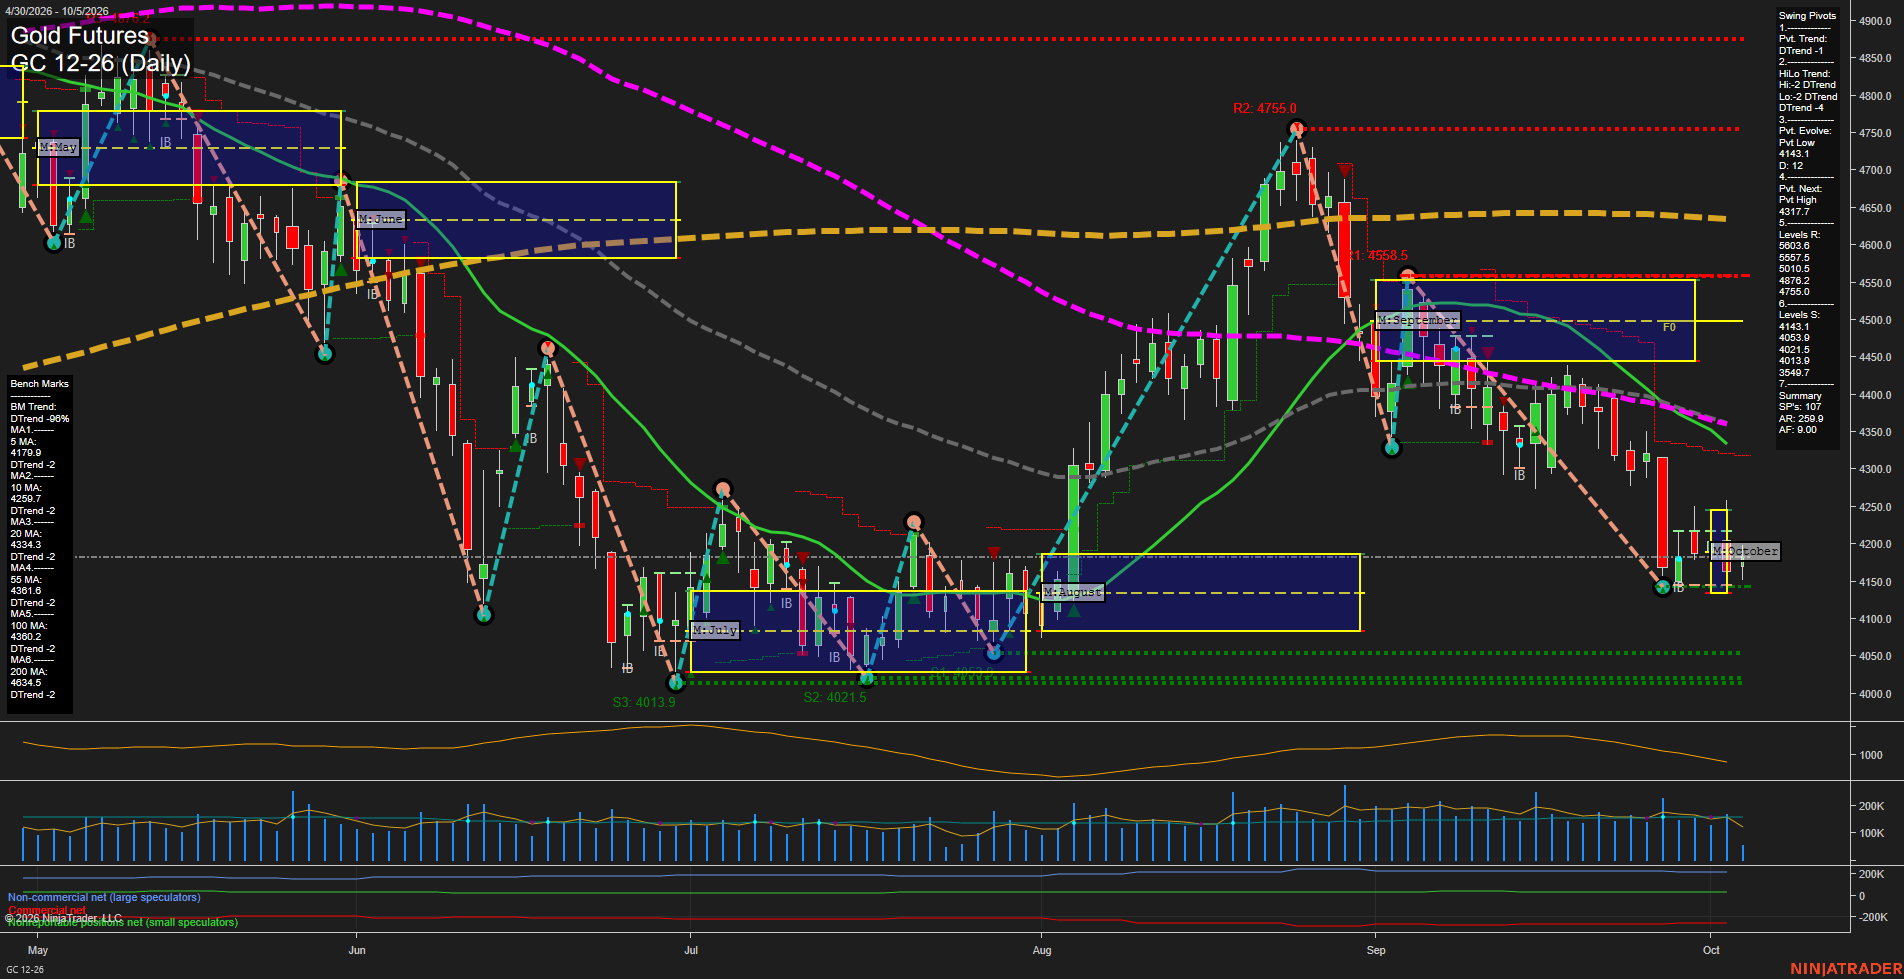
Gold is consolidating with small daily bars near 4197 after a sharp September decline and a test of the 4143.1 swing-low area. The weekly grid remains constructive, but price is below the October monthly F0%/NTZ zone and beneath the 10-, 20-, 55-, 100-, and 200-day benchmarks, which remain aligned in down trends. The active pivot structure remains DTrend/DTrend, with 4317.7 defining the next pivot-high reversal threshold and 4143.1, then the clustered 4053.9 to 4013.9 area, defining the nearby downside structure. The current action reflects a low-momentum pause within the larger bearish swing sequence rather than a confirmed trend reversal.
View charts on: AlphaWebTrader HTF Charts
ZB Daily View
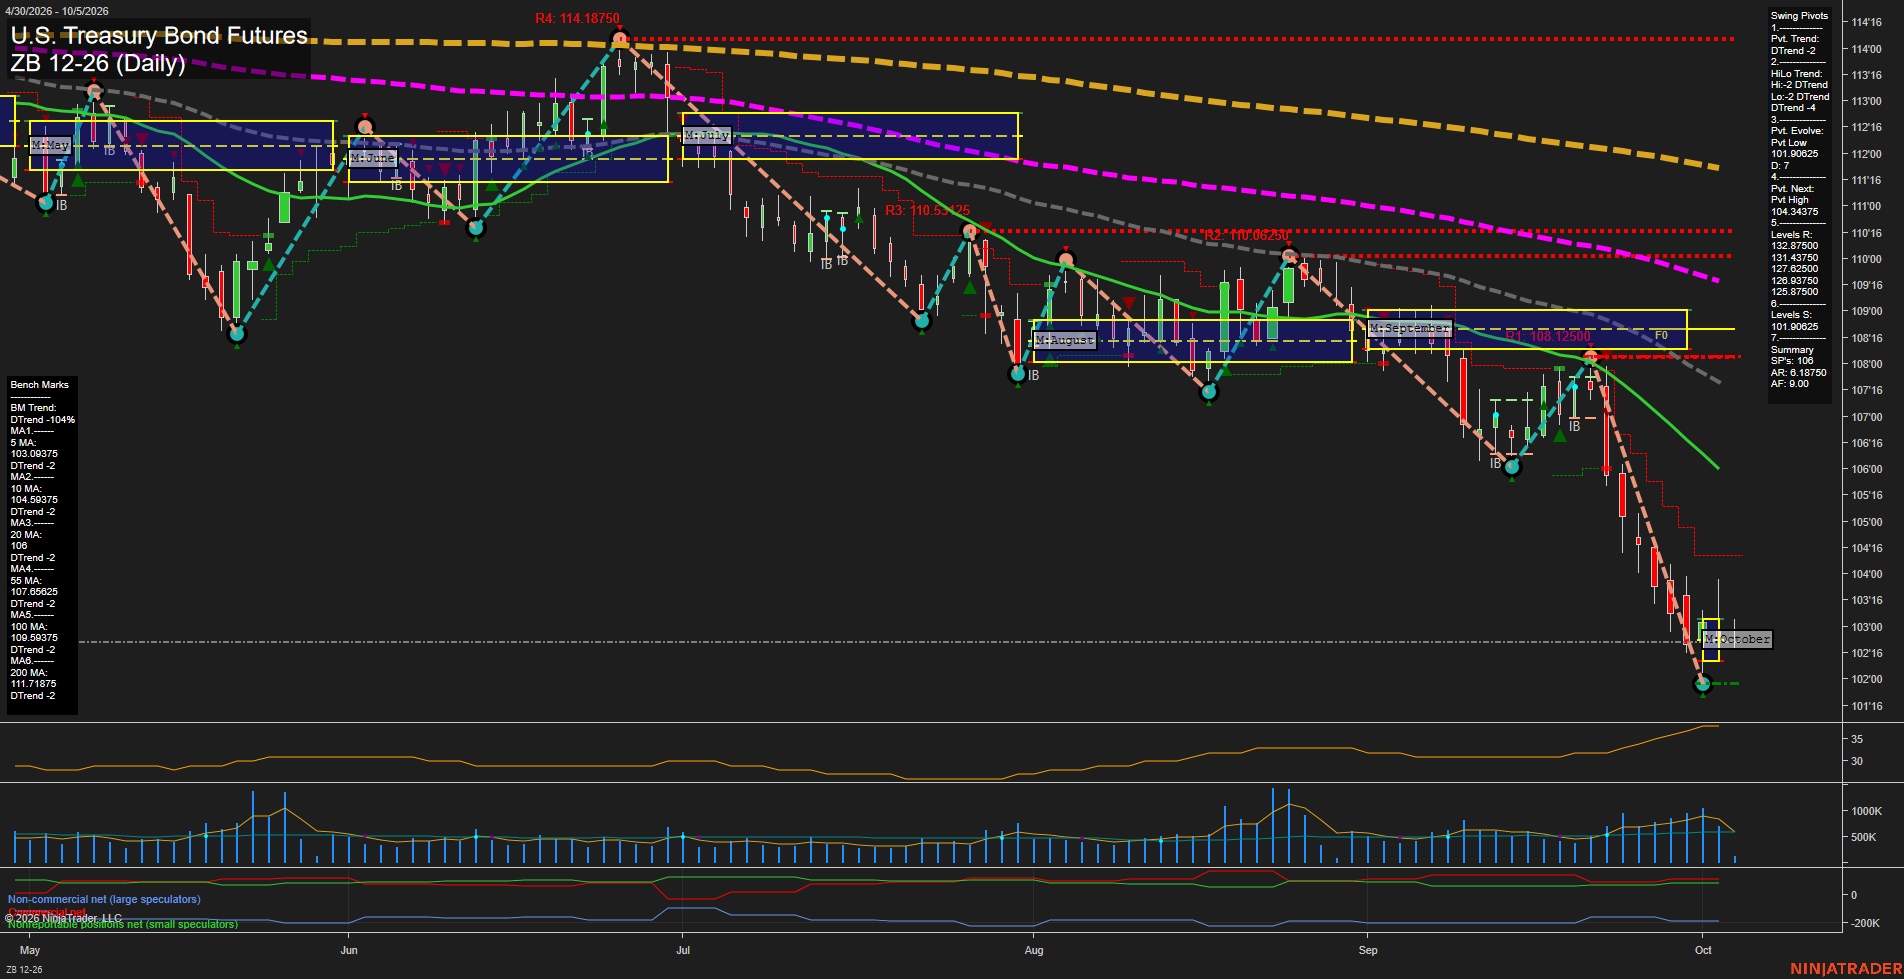
Overall Rating
- Short-Term: Bearish
- Intermediate-Term: Bearish
- Long-Term: Bearish.
Key Insights Summary
Price is in a broad, accelerating daily decline, with a sequence of lower highs and lower lows confirmed by bearish short-term and intermediate-term pivot structures. The contract is below every benchmark average and below the October monthly grid, while the 5-day average remains beneath the 10-day average and both slope lower. The recent selloff expanded daily ranges and lifted ATR toward 35, indicating elevated directional volatility. The 101.90625 pivot low is the nearest structural support, while 104.34375 is the first pivot-reversal threshold and the 5-day average near 103.09375 is the closest benchmark overhead. The technical backdrop remains trend-continuation bearish rather than a completed base or recovery pattern.
View charts on: AlphaWebTrader HTF Charts